


Best Incident Management Software for Engineering Teams (2026)
Compare 9 incident management tools: PagerDuty, Opsgenie, Incident.io, Rootly, FireHydrant, BetterStack, Grafana OnCall, Squadcast, and Last9. Features, pricing, and which fits your team.
Sahil Khan
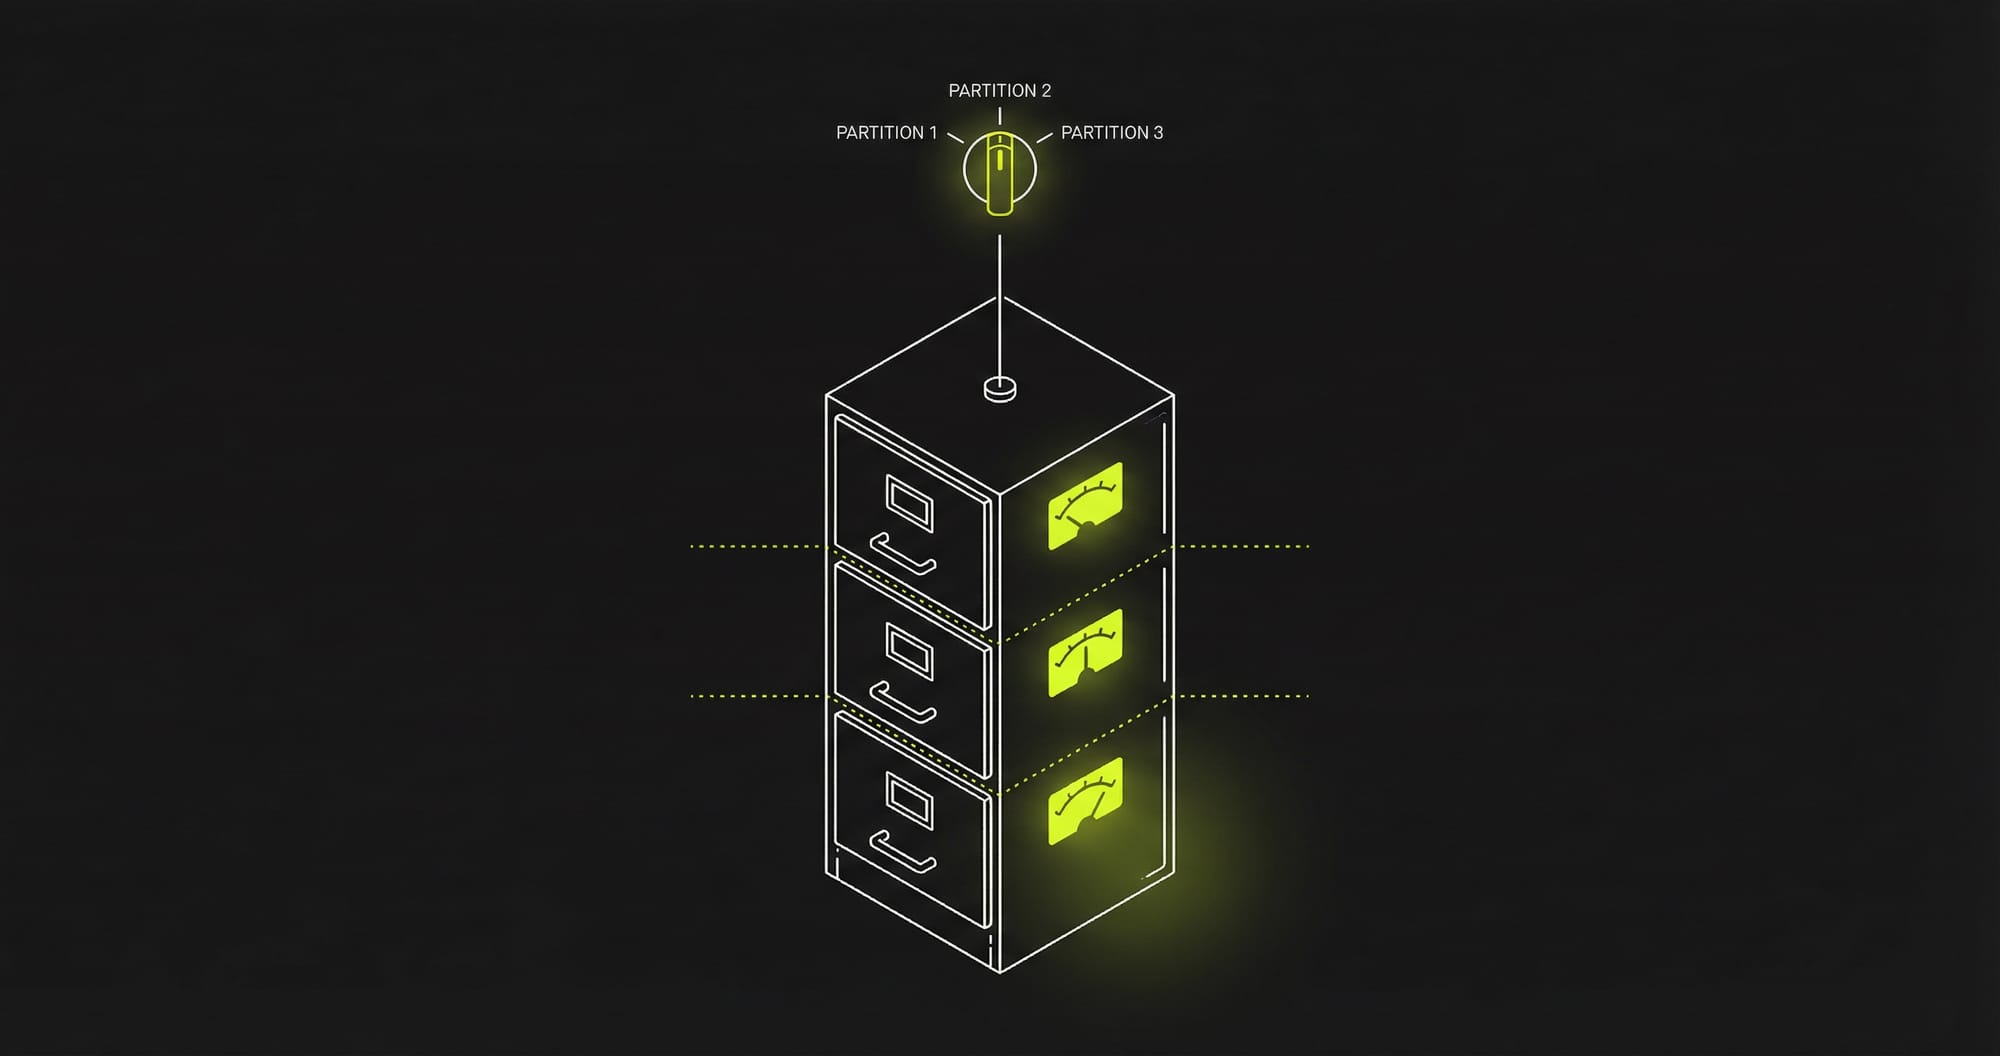
Database Partitioning: Types, Strategies, and When to Use Each
How database partitioning works in PostgreSQL and MySQL. Range, list, and hash partitioning with SQL examples and guidance on when to partition vs shard.
Prathamesh Sonpatki
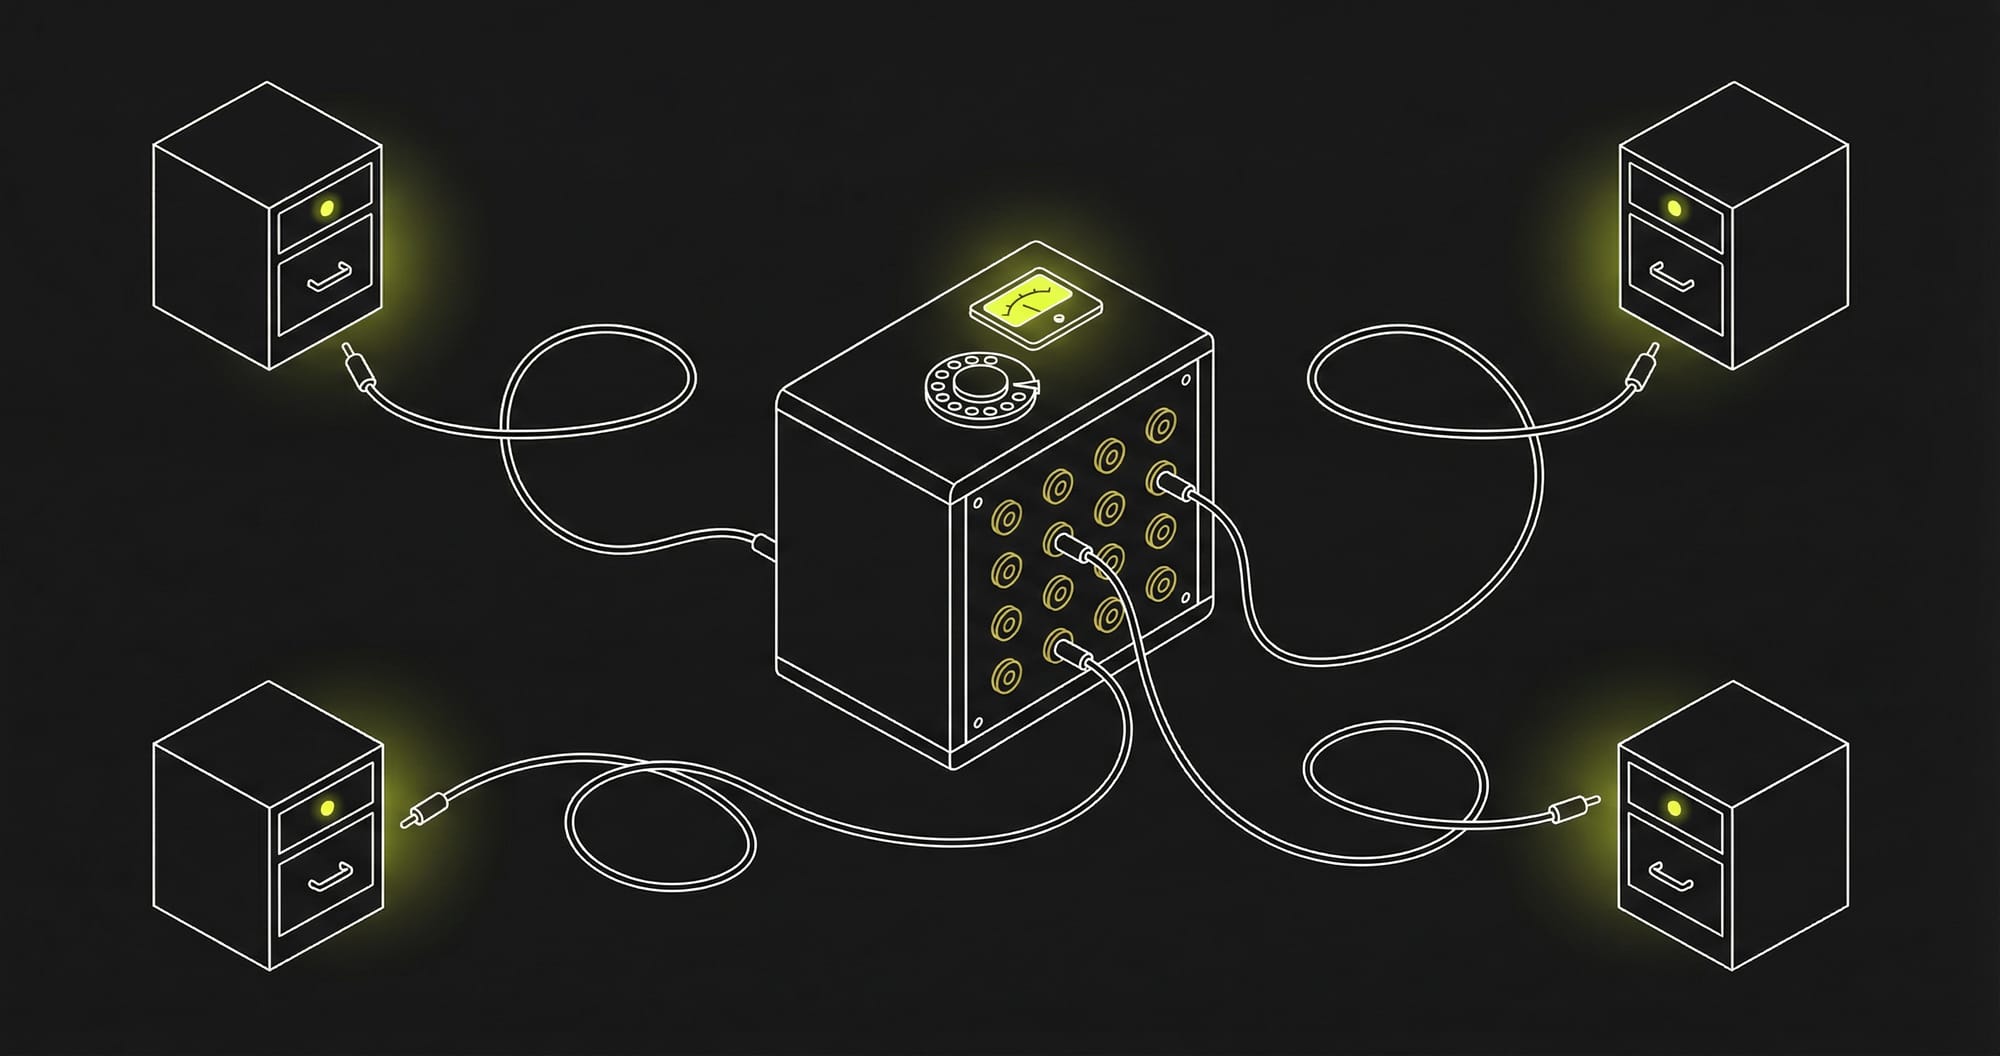
Database Sharding: How It Works and When You Actually Need It
How database sharding works, common strategies (hash, range, directory), shard key selection, and the operational cost of running a sharded database in production.
Prathamesh Sonpatki

Database Performance Tuning: A Practical Guide for Production Systems
Tune PostgreSQL and MySQL for production with connection pooling, memory configuration, write path optimization, vacuum management, and lock contention fixes.
Preeti Dewani

Traces Are Not Your Business Logic
Distributed traces track how your system processed a single request — not what your customers did over time. Confusing the two leads to poorly instrumented systems.
Mukta Aphale

SQL Query Optimization: Techniques That Actually Improve Performance
Find and fix slow SQL queries using execution plans, missing index detection, N+1 pattern fixes, and pagination strategies for PostgreSQL and MySQL.
Sahil Khan
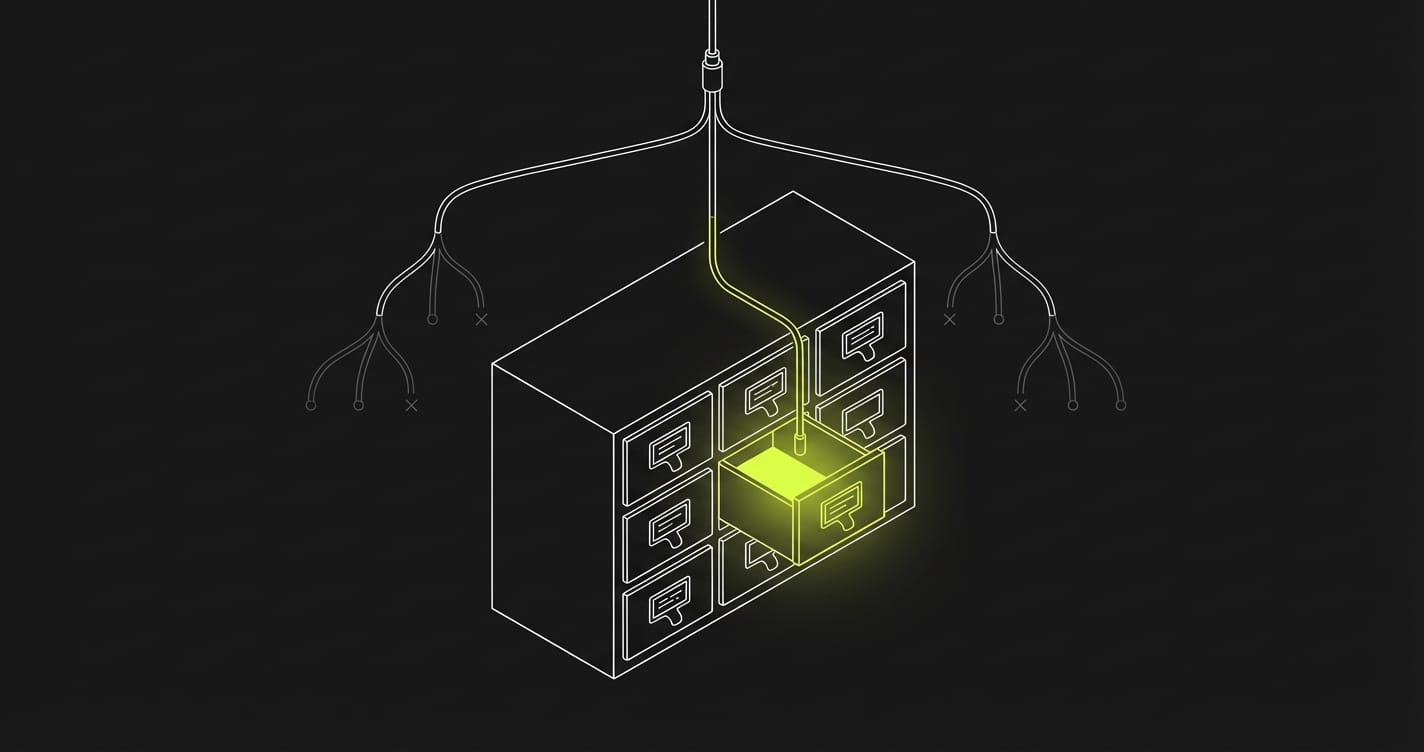
Database Indexing: How It Works, Types, and When to Use It
How database indexes work, when to use B-tree vs hash indexes, clustered vs non-clustered indexes, and how to tell if your indexes are actually helping.
Faiz Shaikh
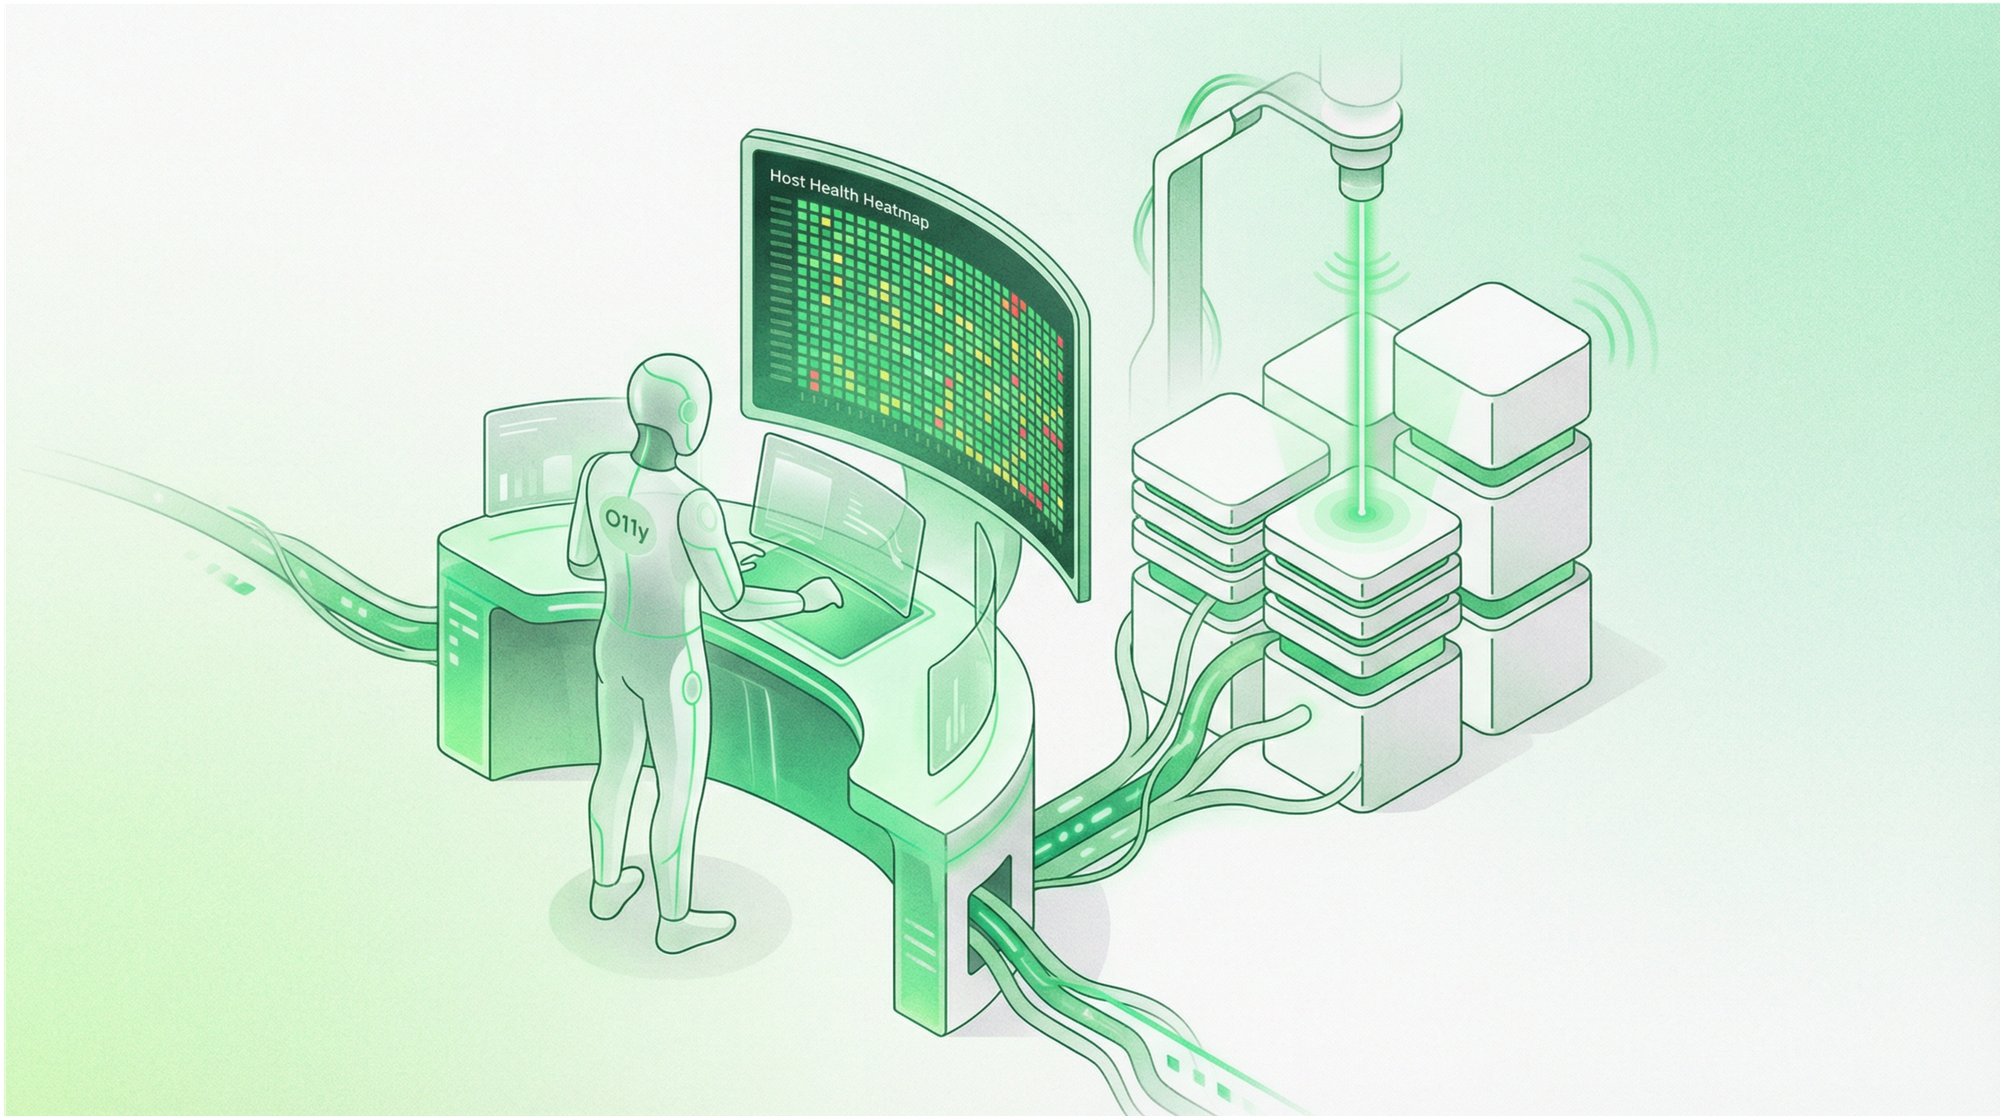
Stop Flying Blind: Synthetic Monitoring, Host heat-maps, and Process-Level Visibility
Most teams learn about outages from customers. Synthetic monitoring, host heat-maps, and AI streaming help you know before being told.
Nishant Modak

High Cardinality Metrics: How Prometheus and ClickHouse Handle Scale
Prometheus pays for high cardinality metrics at write time. ClickHouse pays at query time. Neither solves it : they fail differently. Here's how to choose.
Aditya Godbole
Preeti Dewani

Logs vs Metrics: A Practical Guide for Engineers
Metrics tell you something is wrong. Logs tell you what is wrong. A practical guide on when to use each for effective observability.
Mukta Aphale

New Relic Pricing: Plans, Data Costs & How to Cut Your Bill
New Relic charges per user ($99-$349/month) plus per GB of data ingested ($0.40/GB after 100 GB free). A team of 5 engineers with 500 GB/month pays $650-$2,000. See full cost breakdowns and 5 ways to save.
Tripad Mishra

Sentry Pricing: Full Breakdown, Real Cost Examples & How to Save
Sentry pricing starts free (5K errors/month) and scales to $80/month on the Business plan. Actual costs depend on error volume, tracing spans, and session replays. See real cost examples and 5 ways to cut your bill.
Faiz Shaikh

Podman vs Docker 2026: Security, Performance & Which to Choose
Podman vs Docker: Explore key differences in architecture, security, and tooling to choose the right containerization tool for your needs.
Anjali Udasi

Log Analytics: How to Turn Raw Logs Into Actionable Insights
The difference between storing logs and actually learning from them — querying, pattern detection, anomaly analysis, and choosing the right log analytics tool.
Tripad Mishra

Datadog Pricing 2026: Full Cost Breakdown + How to Save 40-90%
See real Datadog pricing for Infrastructure, APM, Logs & Security. Learn the hidden costs that inflate bills and 4 proven ways to cut your observability spend by 40-90%.
Anjali Udasi

Why High-Cardinality Metrics Break Everything
What actually breaks when teams add high cardinality metrics and why those failures are hard to avoid unless the system is built for it.
Prathamesh Sonpatki
Mukta Aphale

OTel Updates: OpenTelemetry Deprecates Zipkin Exporters
OpenTelemetry deprecates Zipkin exporters in favor of native OTLP support. Migration paths and timeline through December 2026.
Anjali Udasi

Last9 integration with TrueFoundry AI Gateway
TrueFoundry AI Gateway now integrates with Last9. Get unified observability for LLM traffic alongside your existing traces, metrics, and logs.
Sahil Khan

How to Handle Cloud Monitoring Overload?
Learn how to reduce cloud monitoring overload without dropping critical signals or blowing up observability costs.
Anjali Udasi

OTel Updates: OpenTelemetry Proposes Changes to Stability, Releases, and Semantic Conventions
OpenTelemetry proposes stability changes: stable-by-default distributions, decoupled instrumentation, and epoch releases for production deployments.
Anjali Udasi
How to Track Down the Real Cause of Sudden Latency Spikes
Sudden latency spikes rarely have a single cause. This blog shows how to uncover the real source using traces, histograms, and modern debugging signals.
Anjali Udasi

Which Observability Tool Helps with Visibility Without Overspend
A detailed look at observability platforms so you can choose tools that keep visibility high and costs steady as your systems scale.
Anjali Udasi

OTel Updates: Unroll Processor Now in Collector Contrib
The OTel unroll processor splits bundled log records into individual events. Now in Collector Contrib v0.137.0 for VPC and CloudWatch logs.
Anjali Udasi

docker compose restart: Commands, Options & Common Fixes
Master docker compose restart with examples for restarting single services, all containers, and applying config changes. Includes restart vs down vs recreate comparison and troubleshooting tips.
Preeti Dewani

9 Monitoring Tools That Deliver AI-Native Anomaly Detection
A technical guide comparing nine observability platforms built to detect anomalies and support modern AI-driven workflows.
Anjali Udasi

Instrument Jenkins With OpenTelemetry
Instrument Jenkins with OpenTelemetry to understand pipeline behavior, stage latency, and deploy steps using a single telemetry flow.
Anjali Udasi

7 Observability Solutions for Full-Fidelity Telemetry
A quick guide to how seven leading observability tools support full-fidelity telemetry and the architectural choices behind them.
Anjali Udasi

Top 7 Observability Platforms That Auto-Discover Services
Auto-discovery tools now detect services as they appear and build dashboards instantly. Here are seven platforms that do it well.
Anjali Udasi

How to Reduce Log Data Costs Without Losing Important Signals
Reduce log costs by cutting repetitive, low-value logs early and keeping only the signals that help you debug issues with full clarity.
Anjali Udasi

What is AWS Fargate for Amazon ECS?
Understand how AWS Fargate runs your ECS containers without servers—just define CPU, memory, and networking, and AWS handles the compute.
Anjali Udasi

OTel Updates: Complex Attributes Now Supported Across All Signals
OTLP 1.9.0 adds support for maps, arrays, and byte arrays across all OTel signals. Here's when to use complex attributes and when to stick with flat.
Anjali Udasi

Top 9 Web Application Performance Monitoring Tools for 2025
Explore 2025’s top APM tools — from open-source stacks to enterprise platforms — and see how each helps you monitor smarter.
Anjali Udasi

Build Your Kubernetes Monitoring Foundation with kube-prometheus-stack
Set up production-grade Kubernetes monitoring with kube-prometheus-stack using Prometheus, Grafana, and Alertmanager.
Anjali Udasi

OTel Updates: OpenTelemetry eBPF Instrumentation (OBI) Hits Alpha
OpenTelemetry eBPF Instrumentation (OBI) is now in alpha, bringing protocol-level telemetry capture without code changes or restarts.
Anjali Udasi

OpenTelemetry Metrics in Quarkus Explained
Understand how to enable, export, and extend OpenTelemetry metrics in your Quarkus application with practical examples.
Anjali Udasi

How Prometheus Exporters Work With OpenTelemetry
Learn how Prometheus exporters expose OTLP metrics in Prometheus format, making it easier to scrape OpenTelemetry data.
Anjali Udasi

What Are AI Guardrails
Learn the core concepts of AI guardrails and how they create safer, more reliable, and well-structured AI systems in production.
Anjali Udasi

Grafana Tempo: Setup, Configuration, and Best Practices
A practical guide to setting up Grafana Tempo, configuring key components, and understanding how to use tracing across your services.
Anjali Udasi

OTel Updates: Declarative Config — A Steadier Way to Configure OpenTelemetry SDKs
Declarative Config brings structure to OTel SDKs with clean, rule-based settings that stay consistent across every environment.
Anjali Udasi

Sidecar or Agent for OpenTelemetry: How to Decide
Sidecar or agent? See when per-service isolation beats node-level efficiency, and how gateways fit into a scalable OTel pipeline.
Anjali Udasi

OTel Updates: Consistent Probability Sampling Fixes Fragmented Traces
One sampling decision, propagated everywhere. OpenTelemetry's Consistent Probability Sampling fixes fragmented traces across services.
Anjali Udasi

OpenTelemetry Spans Explained: Deconstructing Distributed Tracing
Understand how OpenTelemetry Spans capture, connect, and explain every operation in your distributed system for deeper visibility.
Anjali Udasi

Top 11 Ruby APM Tools for 2025: A Performance-Driven Selection
Explore the top Ruby APM tools for 2025 — from open-source to enterprise — to monitor, trace, and optimize your app’s performance.
Anjali Udasi

Top 9 APM Tools for Node.js Performance Monitoring
Compare top APM tools for Node.js — from open-source options to enterprise-grade platforms — and choose the best fit for your stack.
Anjali Udasi

Implement Distributed Tracing with Spring Boot 3
A practical guide to add OpenTelemetry tracing to Spring Boot 3: agent setup, context propagation, messaging, sampling, and exports.
Anjali Udasi
Last9 Named a Gartner® Cool Vendor in AI for SRE and Observability
Gartner recognizes Last9 in their latest Cool Vendor report for unified telemetry and agentic SDK—moving teams from reactive monitoring to proactive ops.
Nishant Modak

Choosing the Right APM for Go: 11 Tools Worth Your Time
Explore 11 APM tools built for Go—from lightweight open-source options to enterprise-grade platforms that simplify debugging.
Faiz Shaikh

15 PHP APM Tools Worth Using in 2025
Compare 15 PHP APM tools for 2025 — from open-source options to managed platforms — and find what fits your performance needs.
Faiz Shaikh

How OpenTelemetry Auto-Instrumentation Works
OpenTelemetry auto-instrumentation uses runtime hooks and agents to collect telemetry without code changes—covering most modern stacks.
Anjali Udasi

How to Scale Prometheus APM for Modern Applications
Learn how to scale Prometheus APM for growing systems with practical strategies to keep queries fast and monitoring efficient.
Anjali Udasi

Observability vs. Visibility: What's the Difference?
Understand observability vs visibility: visibility shows current states, while observability uncovers why systems act the way they do.
Faiz Shaikh

OTel Updates: Naming Best Practices for Spans, Attributes, and Metrics
Understand how to name spans, attributes, and metrics in OpenTelemetry for consistent, queryable, and reliable observability data.
Anjali Udasi

Docker Daemon Logs: How to Find, Read, and Use Them
Learn where to find Docker daemon logs, how to read them, and use them for troubleshooting, monitoring, and auditing.
Faiz Shaikh

Top 11 Java APM Tools: A Comprehensive Comparison
Compare 11 top Java APM tools, from open-source options to enterprise platforms, and find the best fit for your applications.
Anjali Udasi

Monitor Kubernetes Hosts with OpenTelemetry
Monitor Kubernetes hosts with OpenTelemetry to track CPU, memory, disk, and network usage alongside your app telemetry.
Anjali Udasi

Key APM Metrics You Must Track
Understand key APM metrics like response time, error rates, throughput, and resource usage to keep your applications reliable and fast.
Anjali Udasi

How to Connect Jaeger with Your APM
Learn how to connect Jaeger with your APM to combine tracing and performance monitoring for deeper system visibility.
Anjali Udasi

AWS Prometheus: Production Patterns That Help You Scale
Run Prometheus reliably on AWS with patterns for scale, cost control, and visibility across EKS, EC2, and multi-region setups.
Anjali Udasi

What is Asynchronous Job Monitoring?
Know how asynchronous job monitoring tracks background tasks, ensuring they finish reliably, perform well, and stay visible at scale.
Anjali Udasi

Kubernetes Service Discovery Explained with Practical Examples
Understand Kubernetes Service Discovery with clear examples of Services, Endpoints, DNS, Ingress, and headless setups in action.
Faiz Shaikh

Background Job Observability Beyond the Queue
Understand what makes background jobs slow or fail by looking past queue depth to real execution signals.
Anjali Udasi

What is Service Catalog Observability and How Does It Work?
Service catalog observability tracks discovery, adoption, and runtime accuracy, turning catalogs into measurable infrastructure.
Faiz Shaikh

APM for Kubernetes: Monitor Distributed Applications at Scale
Understand Kubernetes APM by linking request flows with pod, node, and cluster data to get complete visibility at scale.
Anjali Udasi

Kubernetes Monitoring Metrics That Improve Cluster Reliability
Understand Kubernetes monitoring metrics that help detect issues early, improve reliability, and keep your cluster performing at its best.
Anjali Udasi

What is APM Tracing?
Understand APM tracing to see how a request moves through services, helping you spot delays, errors, and bottlenecks quickly.
Faiz Shaikh

A Single Hub for Telemetry: OpenTelemetry Gateway
Understand how the OpenTelemetry Gateway unifies metrics, logs, and traces, giving you one control point for all telemetry data.
Anjali Udasi

A Practical Guide to Python Application Performance Monitoring(APM)
Monitor, debug, and optimize Python apps in production with APM—track transactions, DB queries, errors, and external calls.
Anjali Udasi

What is Database Monitoring
Database monitoring tracks performance, health, and availability, helping detect issues early and maintain optimal operations.
Anjali Udasi

OpenTelemetry API vs SDK: Understanding the Architecture
Understand how the OpenTelemetry API and SDK work together, clean instrumentation in code, and flexible data processing in configuration.
Anjali Udasi

APM Logs: How to Get Started for Faster Debugging
Understand how APM logs connect metrics, traces, and events to speed up debugging and uncover root causes faster.
Anjali Udasi

From Cloud Native to AI Native: Why Your Observability Stack Needs to Speak Agent
Your production telemetry now speaks agent: ask questions in Slack, debug in VS Code, optimize in real-time. Same data, conversational interface.
Nishant Modak
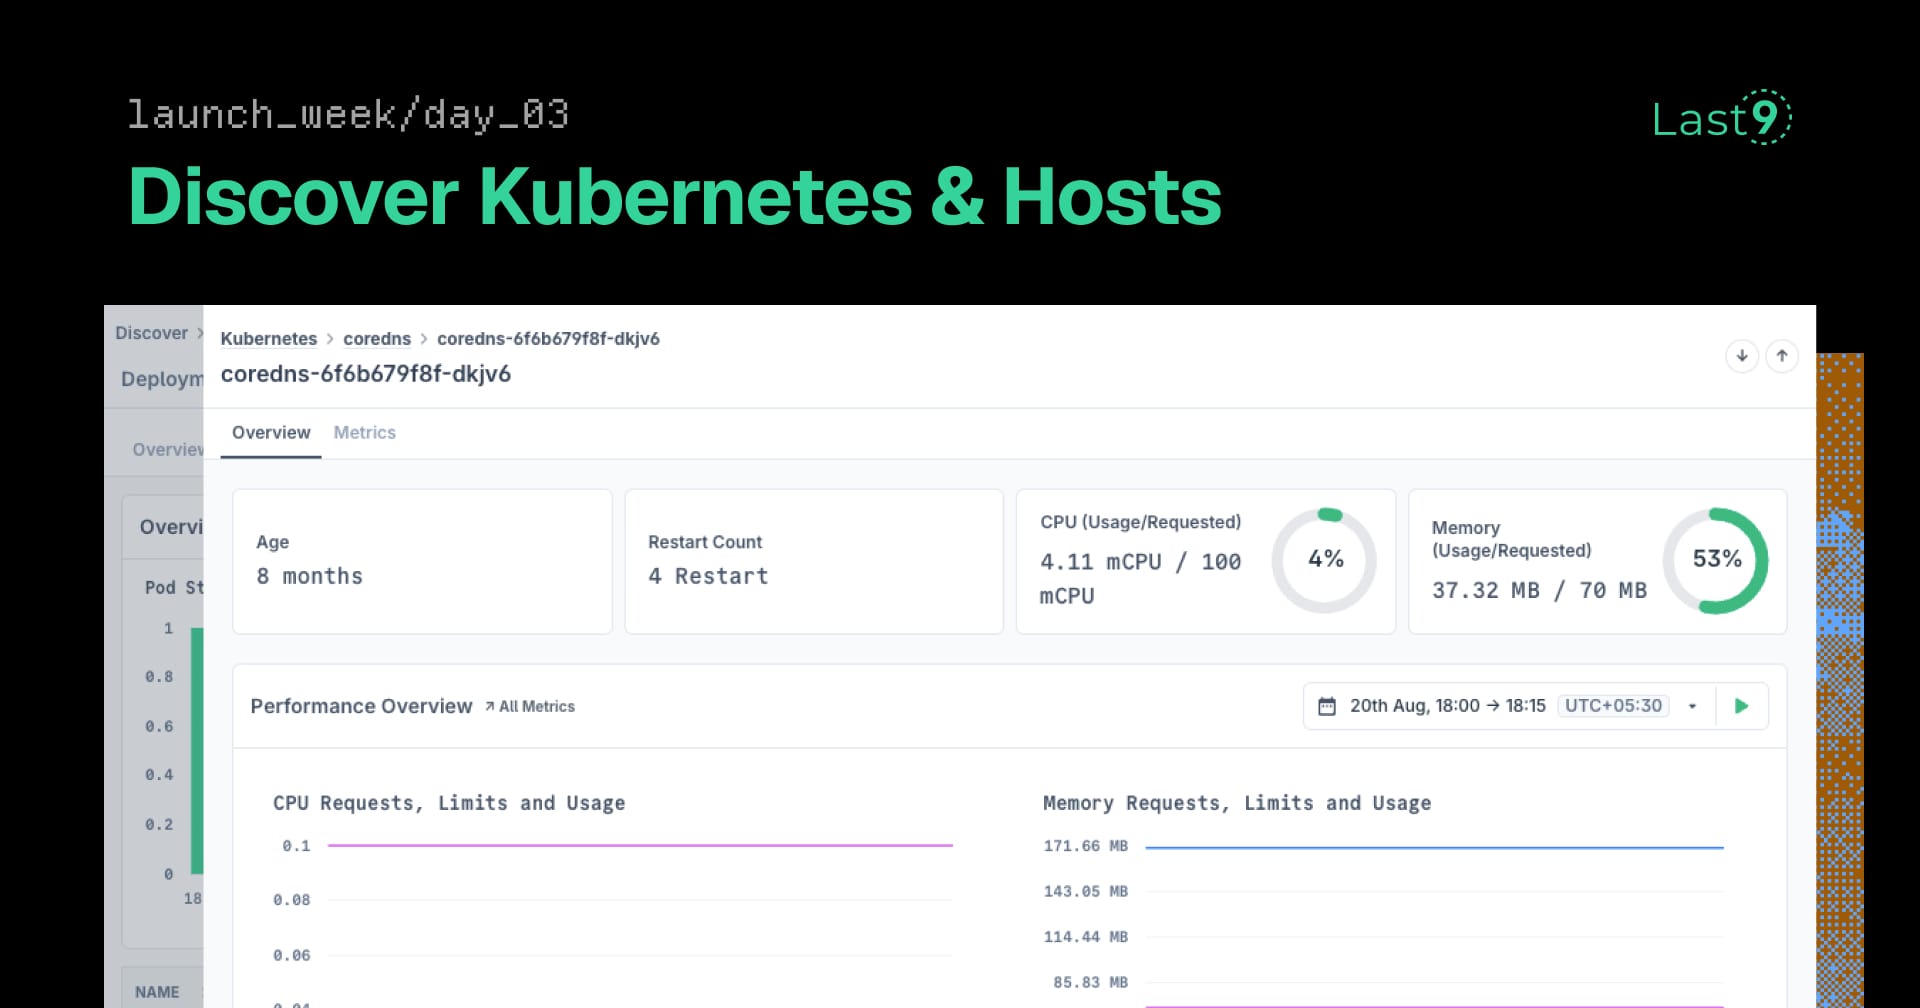
Your Apps Are Green. Your Infrastructure Is Dying.
Infra problems hide behind green dashboards. Discover Infrastructure monitors K8s and hosts from the same telemetry—unified visibility, AI-powered debugging.
Nishant Modak

A Detailed Guide to Azure Kubernetes Service Monitoring
Track the right AKS metrics, integrate with Azure Monitor, and optimize dashboards for reliable, cost-efficient Kubernetes operations.
Faiz Shaikh
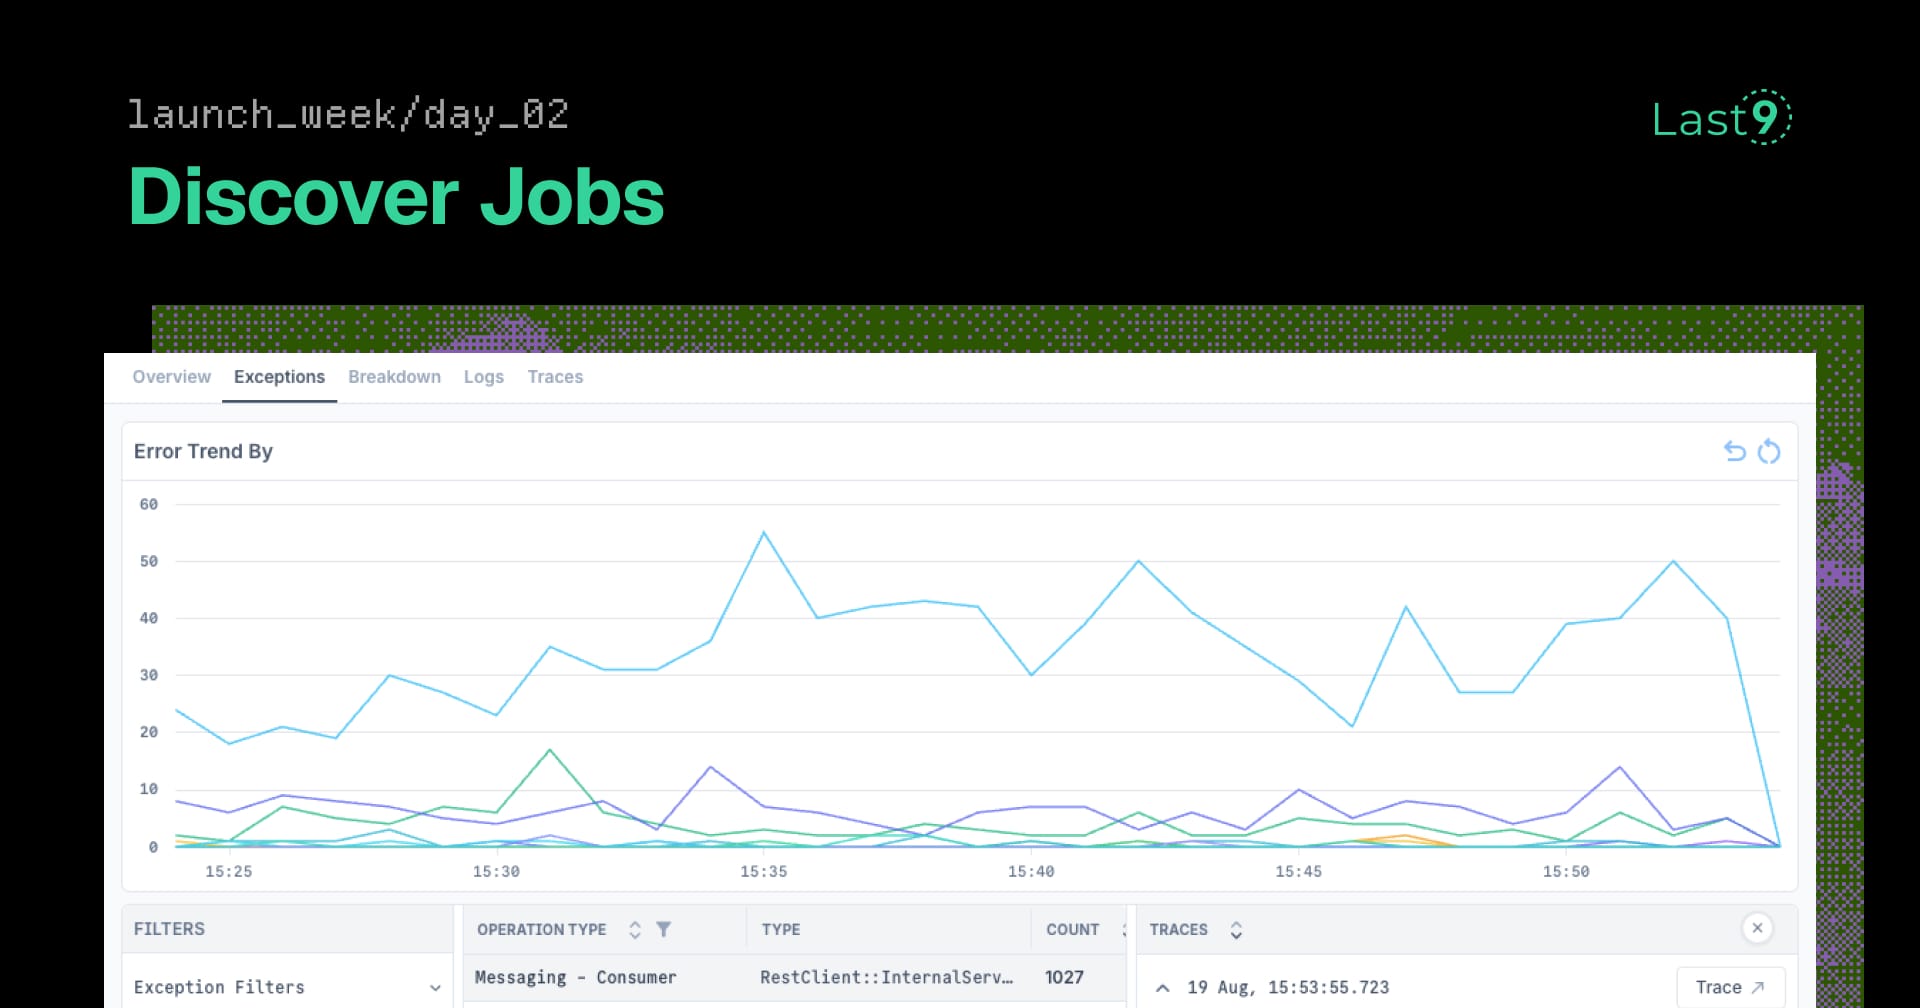
Your APIs Are Green. Your Background Jobs Are Dying.
Background jobs fail silently while your APIs look healthy. Discover Jobs gives async operations the same deep visibility as APIs—automatic detection, operation-level debugging.
Nishant Modak

What is Real User Monitoring
Understand how Real User Monitoring captures real user interactions to reveal true app performance, errors, and user experience patterns.
Anjali Udasi
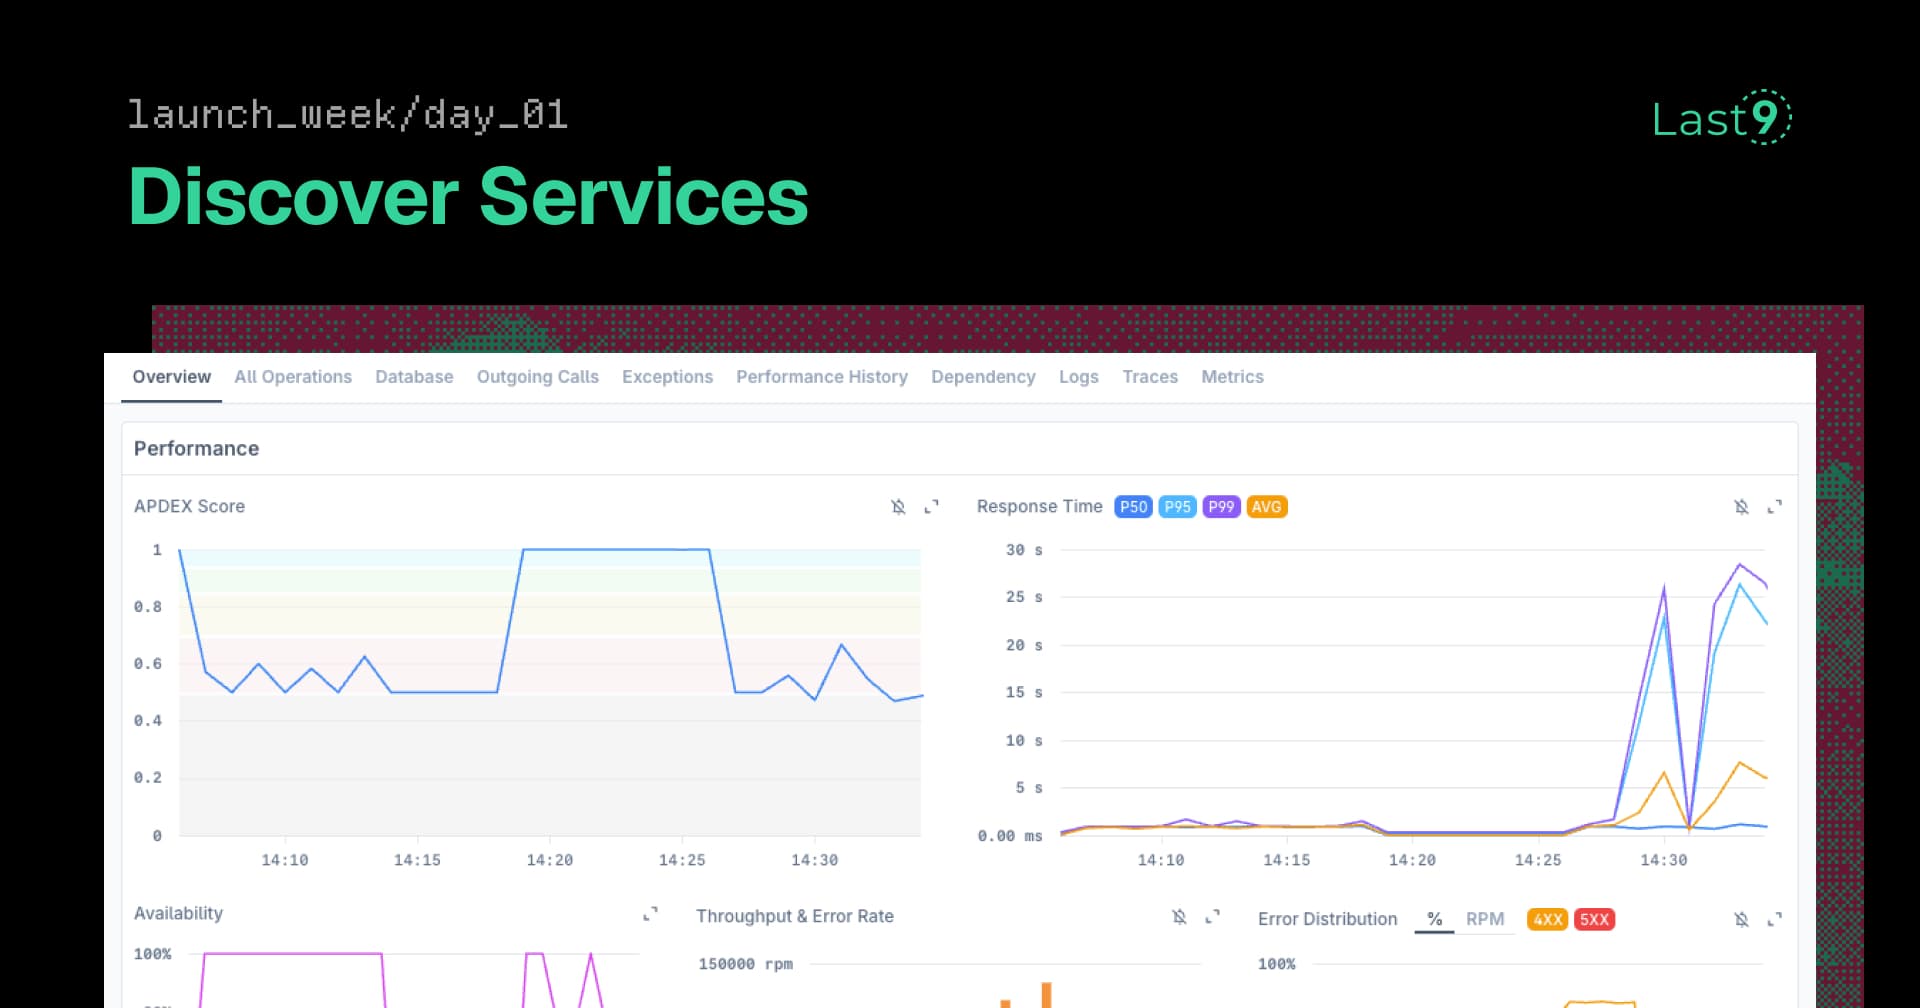
The Service Discovery Problem Every Developer Knows (But Pretends Doesn't Exist)
New services deploy faster than you can track them. Discover Services auto-discovers your entire architecture from traces—convention over configuration. No manual catalogs.
Nishant Modak

Top 12 LogicMonitor Alternatives for Developers in 2025
LogicMonitor fits traditional infra, but for microservices, high-cardinality data, and Kubernetes, these 12 alternatives work better.
Faiz Shaikh

Top 13 Application Performance Monitoring Tools
Discover 7 reliable APM tools that help you monitor performance, spot issues early, and keep your applications running without surprises.
Anjali Udasi

Log Format Standards: JSON, XML, and Key-Value Explained
A practical look at common log format standards, how JSON, XML, and key-value logs work, and when to use each in production systems.
Faiz Shaikh

PostgreSQL Performance Tuning: Cut Query Latency 50-80%
Slow Postgres queries killing your app? Learn proven tuning techniques for indexes, VACUUM, connection pooling, and query optimization. Real fixes that cut latency 50-80%.
Faiz Shaikh

What are Application Metrics?
Application metrics are key performance signals, like latency, error rate, and throughput, that help you understand how your app behaves in production.
Anjali Udasi

Jaeger Monitoring: Essential Metrics and Alerting for Production Tracing Systems
Monitor Jaeger in production with core metrics and alerting rules, track trace completion, queue depth, and storage performance at scale.
Anjali Udasi

Why Your Loki Metrics Are Disappearing (And How to Fix It)
Diagnose missing Loki metrics by fixing recording rule gaps, remote write failures, and high-cardinality issues in production setups.
Faiz Shaikh

OTel Updates: Auto-Instrument Your Apps with the OTel Injector
Automatically instrument your apps on Linux with the OTel Injector, no code changes, minimal setup, and support for Java, Node.js, Python, and .NET.
Anjali Udasi

OTel Updates: Weaver for Consistent Observability with Semantic Conventions
Achieve consistent, reliable observability with OTel Weaver, validate and standardize telemetry using semantic conventions at ingest.
Anjali Udasi

OTel Updates: How Prometheus 3.0 Fixes Resource Attributes for OTel Metrics
Prometheus 3.0 supports resource attribute promotion for OpenTelemetry metrics, enabling direct labeling without `target_info` joins.
Anjali Udasi

How sum_over_time Works in Prometheus
Understand how sum_over_time() aggregates metrics in Prometheus, handles gaps, and why step size and staleness can affect accuracy.
Faiz Shaikh

Use Telegraf Without the Prometheus Complexity
Collect metrics with Telegraf without running Prometheus. No scraping, no TSDB tuning, just clean, push-based telemetry to your backend.
Anjali Udasi

Ship Confluent Cloud Observability in Minutes
Push metrics into Last9 and start tracking Kafka lag, retries, and throughput in real-time.
Anjali Udasi

How to Set Up Real User Monitoring
Set up Real User Monitoring (RUM) with safe defaults, proper sampling, and consent handling,without breaking your production code.
Anjali Udasi

Monitor Nginx with OpenTelemetry Tracing
Instrument NGINX with OpenTelemetry to capture traces, track latency, and connect upstream and downstream services in a single request flow.
Prathamesh Sonpatki

Set Up ClickHouse with Docker Compose
Spin up a full ClickHouse stack with Docker Compose, includes clustering, ZooKeeper, monitoring, and performance tuning tips.
Preeti Dewani

Stream AWS Metrics to Grafana with Last9 in 10 minutes
Visualize AWS metrics like Lambda, API Gateway, and RDS in Grafana using Last9. No agents, no code, set it up in under 10 minutes.
Faiz Shaikh

Trace Go Apps Using Runtime Tracing and OpenTelemetry
Instrument Go apps with runtime tracing and OpenTelemetry to spot goroutine issues, lock contention, and performance bottlenecks early.
Preeti Dewani

Query and Analyze Logs Visually, Without Writing LogQL
Visually build, parse, and analyze logs across services, no LogQL required. Get structured insights faster with Query Builder.
Anjali Udasi

Build Log Automation with Last9's Query API
Here's how you can build automated log analysis workflows with Last9's Query Logs API
Prathamesh Sonpatki

Enable Kong Gateway Tracing in 5 Minutes
Instrument Kong with OpenTelemetry for end-to-end API visibility, no code changes required.
Anjali Udasi

Kibana Logs: Advanced Query Patterns and Visualization Techniques
A practical guide to querying, filtering, and visualizing logs in Kibana, built for speed, scale, and real-world debugging workflows.
Anjali Udasi

Jaeger Metrics: Internal Operations and Service Performance Monitoring
Understand Jaeger metrics for internal health and service performance. Learn how to set up, monitor, and scale tracing with real insights.
Faiz Shaikh

Optimize LangChain Performance with Trace Analytics
Analyze trace data to spot slow chains, high token usage, and memory issues in LangChain apps.
Anjali Udasi

How to Get Grafana Iframe Embedding Right
Know how to securely embed Grafana dashboards using iframes, covering auth, config, performance, and monitoring with Last9.
Anjali Udasi

Elasticsearch with Python: A Detailed Guide to Search and Analytics
Know how to use Elasticsearch with Python for indexing, searching, and analyzing data, complete with code, tips, and integration examples.
Anjali Udasi

What is Log Loss and Cross-Entropy
Log loss and cross-entropy are core loss functions for classification tasks, measuring how well predicted probabilities match actual labels.
Faiz Shaikh

Cloud Log Management: A Developer's Guide to Scalable Observability
Centralized logging helps you debug faster, scale smarter, and cut through noise. Here's how to get it right from the start.
Anjali Udasi

Troubleshooting LangChain/LangGraph Traces: Common Issues and Fixes
Troubleshoot LangChain and LangGraph tracing issues with common causes and clear fixes to keep your observability on point.
Anjali Udasi

How to Get Logs from Docker Containers
Learn how to access, filter, and monitor Docker container logs, plus tips for structured logging, rotation, and production-ready setups.
Preeti Dewani

How Replicas Work in Kubernetes
Understand how Kubernetes uses replicas to ensure your application stays available, handles traffic spikes, and recovers from pod failures automatically.
Faiz Shaikh

OTel Updates: Improve Consistency Across Signals with OTel Semantic Conventions
Correlate logs, metrics, and traces faster by using consistent field names and schemas with OpenTelemetry semantic conventions.
Anjali Udasi

Prometheus Group By Label: Advanced Aggregation Techniques for Monitoring
Know how to use group by in Prometheus for advanced metric aggregation, reduce noise, and improve observability across services.
Faiz Shaikh

Instrument LangChain and LangGraph Apps with OpenTelemetry
Understand how to trace, monitor, and debug LangChain and LangGraph apps using OpenTelemetry, down to chains, tools, tokens, and state flows.
Anjali Udasi

Docker Status Unhealthy: What It Means and How to Fix It
What Docker’s “unhealthy” status means, why it happens, and how to debug failing containers with clarity and control.
Faiz Shaikh

LangChain Observability: From Zero to Production in 10 Minutes
Add tracing, metrics, and cost visibility to your LangChain app in minutes using OpenTelemetry and LangSmith, no rewrites needed.
Anjali Udasi

How to Run Elasticsearch on Kubernetes
Understand how to deploy, scale, and manage Elasticsearch on Kubernetes with the right configs for storage, availability, and performance.
Anjali Udasi

LangChain & LangGraph: The Frameworks Powering Production AI Agents
LangChain and LangGraph help build production-grade AI agents. Here's how they work, and why observability is key to running them reliably.
Anjali Udasi

How to Write Logs to a File in Go
Understand how to write logs to a file in Go, avoid common pitfalls, and build a production-ready logging setup with performance and safety in mind.
Anjali Udasi

Logging in Docker Swarm: Visibility Across Distributed Services
Know how to access, troubleshoot, and centralize logs in Docker Swarm for better visibility into your distributed services.
Faiz Shaikh

Prometheus Gauges vs Counters: What to Use and When
Understand the difference between Prometheus gauges and counters, when to use each, and how to avoid common metric pitfalls.
Anjali Udasi

Prometheus and CloudWatch Integration for AWS Metric Collection
Understand how to collect and query AWS CloudWatch metrics in Prometheus using the CloudWatch exporter, setup, IAM config, and best practices.
Anjali Udasi

How to Configure Docker’s Shared Memory Size (/dev/shm)
Understand how to configure Docker’s /dev/shm size to avoid memory errors in Chrome, PostgreSQL, and other high-memory workloads.
Faiz Shaikh

Amazon SQS Metrics: Monitor, Debug, and Optimize Your Message Queues
Get visibility into your SQS queues with key CloudWatch metrics, custom insights, and alerting strategies for smooth, reliable processing.
Anjali Udasi

11 Best Log Monitoring Tools for Developers in 2025
A technical comparison of 11 log monitoring tools developers use in 2025—features, trade-offs, pricing, and platform compatibility
Anjali Udasi

Prometheus Logging Explained for Developers
Understand how Prometheus logging captures structured metrics, improves query performance, and scales observability in production systems.
Prathamesh Sonpatki

Docker Stop vs Kill: When to Use Each Command
docker stop gives containers time to shut down cleanly. docker kill doesn't—use it only when you need an immediate shutdown.
Anjali Udasi

Log Management and Query Optimization in Kibana
Understand how to manage, search, and optimize logs in Kibana using structured data, efficient queries, and performance-aware setup techniques.
Faiz Shaikh

Access Logs: Format Specification and Practical Usage
Learn how access logs work, what they capture, and how to use them to debug issues, monitor performance, and spot security red flags.
Anjali Udasi

Azure CDN for Static Assets, APIs, and Front Door
Know how to use Azure CDN for static assets and APIs, and when to switch to Azure Front Door for smarter routing and dynamic content delivery.
Faiz Shaikh

Network Latency: Types, Causes, and Fixes
Learn what network latency means, what causes it, and how to fix slowdowns before they start affecting your users.
Anjali Udasi

Everything You Need to Know About Event Logs
A practical guide to event logs—what to capture, how to structure them, and why they matter for debugging, monitoring, and visibility.
Faiz Shaikh

Fluent Bit Helm Chart: Simplify Log Collection in Kubernetes
Learn how to set up Fluent Bit using Helm to collect, process, and route logs efficiently in your Kubernetes clusters.
Anjali Udasi

An Easy Guide to Getting Started with Elastic APM
Learn how to set up Elastic APM, track what your app’s doing in production, and catch slowdowns before your users do.
Faiz Shaikh

How to Monitor Kafka Producer Metrics
Monitor critical Kafka producer metrics like record-send-rate, error-rate, and buffer-available-bytes to troubleshoot performance issues in production.
Anjali Udasi

A Complete Guide to Linux Log File Locations and Their Usage
Learn where Linux stores logs, what each file does, and how to use them for debugging, monitoring, and keeping your systems in check.
Anjali Udasi

How to Integrate OpenTelemetry Collector with Prometheus
Understand how to set up OpenTelemetry Collector with Prometheus for easy, vendor-neutral metrics collection and storage.
Prathamesh Sonpatki

How to Configure and Optimize Prometheus Data Retention
Learn how to set Prometheus retention limits, avoid storage bloat, and keep the metrics that matter for your systems.
Preeti Dewani

How to Log Into a Docker Container
Understand how to quickly log into a Docker container using simple commands to troubleshoot and manage your apps effectively.
Anjali Udasi

How to Monitor and Manage Grafana Memory
Understand how to monitor and manage Grafana memory usage to keep your dashboards running smoothly and avoid crashes or slowdowns.
Anjali Udasi

Graylog vs ELK: Which Log Management Solution Fits Your Stack?
Graylog or ELK? Discover which log management tool fits your team’s needs, from quick setup to deep customization.
Faiz Shaikh

Jaeger vs Zipkin: Which is Right for Your Distributed Tracing
Compare Jaeger and Zipkin to find the best fit for your distributed tracing needs, infrastructure, and observability goals.
Anjali Udasi

Prometheus Alerting Examples for Developers
Know how to set up smarter Prometheus alerts from basic CPU checks to app-aware rules that reduce noise and catch real issues early.
Prathamesh Sonpatki

Traceparent: How OpenTelemetry Connects Your Microservices
Know how traceparent in OpenTelemetry connects requests across microservices for seamless distributed tracing and better observability.
Preeti Dewani

How Auditd Logs Help Secure Linux Environments
Understand auditd logs as a way to track important actions on your Linux system, helping you spot security issues and keep things running smoothly.
Anjali Udasi

Windows Error Logs: Your Guide to Simplified Debugging
Windows error logs hold clues to what’s going wrong. Learn how to read them and make debugging faster and less frustrating.
Faiz Shaikh

Docker Container Lifecycle: Key States and Best Practices
Explore the key stages of the Docker container lifecycle and learn best practices to manage containers efficiently and reliably.
Faiz Shaikh

Kubernetes Logs: How to Collect and Use Them
Understand how to collect, manage, and troubleshoot Kubernetes logs to keep your applications running smoothly and issues easy to debug.
Anjali Udasi

Server Performance Metrics Explained
Understand the key server performance metrics to monitor for better reliability, faster troubleshooting, and smarter capacity planning.
Faiz Shaikh

An Easy and Practical Guide to CDN Monitoring
Understand how to monitor your CDN effectively with this easy, practical guide focused on key metrics, common issues, and real-world tips.
Preeti Dewani

Graylog vs Loki: Key Differences and Use Cases
Graylog and Loki offer different logging approaches—full-text search vs. label-based indexing—for varied needs and scale. Know more here!
Anjali Udasi

How to Monitor and Optimize Prometheus CPU Usage
Know how to monitor, understand, and optimize Prometheus CPU usage to keep your observability reliable and efficient.
Faiz Shaikh

VPC Log Format: Custom and Advanced Configurations
Customize your VPC log format to capture the data you need. Know advanced field configurations to optimize cost, performance, and security.
Anjali Udasi

Common Issues with Grafana Login and How to Fix Them
Forgot your Grafana password or locked out? Know common login issues and simple fixes to get you back into your dashboards fast.
Anjali Udasi

Track the Right Elasticsearch Metrics Without the Noise
Learn how to monitor the most important Elasticsearch metrics to keep your cluster healthy—without getting lost in unnecessary data noise.
Faiz Shaikh

OpenTelemetry vs Micrometer: Here’s How to Decide
Trying to pick between OpenTelemetry and Micrometer? Here’s a clear look at how they differ and where each one fits best.
Anjali Udasi

.NET Logging with Serilog and OpenTelemetry
Bring structure and trace context to your .NET logs by combining Serilog with OpenTelemetry for better debugging and observability.
Faiz Shaikh

Getting Started with Loki for Log Management
A practical guide to setting up Loki for logs—how it works, how to query, and what to watch out for in real-world environments.
Anjali Udasi

Grafana Tempo vs Jaeger: Key Features, Differences, and When to Use Each
Grafana Tempo vs Jaeger: Understand how they differ in storage, querying, and setup—so you can choose the right tracing tool for your stack.
Anjali Udasi

Top 11 Application Logging Tools for DevOps Engineers in 2025
Explore the top 11 logging tools of 2025—compare features, use cases, and pricing to find the perfect fit for your DevOps observability stack.
Faiz Shaikh

Monitoring Node.js: Key Metrics You Should Track
Understand which metrics matter in Node.js applications, why they’re important, and how to track them effectively in production.
Faiz Shaikh

How to Handle Logging in Microservices Architectures
Learn how to manage logging in microservices—from common challenges to tools and practices that actually help in real-world systems.
Anjali Udasi

JVM Metrics: A Complete Guide for Performance Monitoring
Learn which JVM metrics matter, how to track them, and use that data to troubleshoot and improve Java application performance.
Faiz Shaikh

Linux Security Logs: Complete Guide for DevOps and SysAdmins
A practical guide to understanding, finding, and using Linux security logs — built for DevOps, SysAdmins, and anyone managing production systems.
Anjali Udasi

Ubuntu Cron Logs: A Complete Guide for Engineers
A practical guide to Ubuntu cron logs—where to find them, how to read them, and how to set up logging that actually helps during failures.
Faiz Shaikh

Angular OpenTelemetry Setup and Troubleshooting
Learn how to set up OpenTelemetry in your Angular app and troubleshoot common issues with tracing, instrumentation, and export configuration.
Prathamesh Sonpatki

Solr Key Metrics: The Essential Guide for DevOps & SREs
Track what matters in Solr. This guide covers key Solr metrics every DevOps and SRE team should monitor to keep search performance sharp.
Faiz Shaikh

CloudWatch vs OpenTelemetry: Choosing What Fits Your Stack
CloudWatch vs OpenTelemetry: Understand the trade-offs and choose the observability approach that fits your team's architecture and workflows.
Anjali Udasi

OpenTelemetry PHP: A Detailed Implementation Guide
Learn how to set up OpenTelemetry PHP to collect traces, metrics, and logs from your PHP apps and improve observability across your stack.
Preeti Dewani

Track MongoDB Performance Metrics Without the Noise
Learn which MongoDB performance metrics matter most, how to track them, and avoid the noise that clutters your monitoring setup.
Anjali Udasi

The Complete Guide to Observing RabbitMQ
Learn how to monitor, troubleshoot, and improve RabbitMQ performance with the right metrics, tools, and observability practices.
Faiz Shaikh

Kubernetes Alerting That Won’t Burn You Out
A practical guide to Kubernetes alerting—cut the noise, catch what matters, and avoid those unnecessary 3AM wake-up calls.
Anjali Udasi

A Detailed Guide on Docker Container Performance Metrics
Learn how to track, collect, and use key Docker container performance metrics to keep your containerized apps stable and efficient.
Preeti Dewani

Essential Python Monitoring Techniques You Need to Know
Learn the key techniques to monitor Python performance, catch bottlenecks early, and keep your applications fast and reliable at scale.
Anjali Udasi

The Complete Guide to Node.js Logging Libraries in 2025
Discover the most effective Node.js logging libraries, their implementation patterns, and how to choose the right one for your specific project needs.
Faiz Shaikh

SQL Server Observability: Monitoring, Troubleshooting, and Best Practices
Essential techniques for comprehensive SQL Server observability: from setting up monitoring to troubleshooting performance issues and implementing best practices.
Preeti Dewani

OpenTelemetry Collector vs Exporter: Understanding the Key Differences
Confused between OpenTelemetry Collector and Exporter? Here's a quick guide to help you understand what each does and when to use them.
Faiz Shaikh

Complete Guide to OTel Exporters: OTLP Endpoint Setup & Best Practices
OpenTelemetry exporters: the crucial bridge between your code and monitoring backends. Learn how to choose, configure, and optimize for performance at scale.
Anjali Udasi

Getting Started with Jaeger for Distributed Tracing
Learn how to set up Jaeger for distributed tracing, track requests across services, and troubleshoot issues in modern microservice apps.
Preeti Dewani

How Docker Logging Drivers Work
Learn how Docker logging drivers collect, route, and store container logs—and which one makes sense for your monitoring setup.
Anjali Udasi

React Logging: How to Implement It Right and Debug Faster
Learn how to set up logging in React the right way—avoid noisy logs, catch bugs early, and make debugging less of a headache.
Faiz Shaikh

Easily Query Multiple Metrics in Prometheus
Learn how to efficiently query multiple metrics in Prometheus, simplifying your monitoring workflow and enhancing visibility into your systems.
Preeti Dewani

Apache Logs Explained: A Guide for Effective Troubleshooting
Learn how to read and analyze Apache logs to troubleshoot issues effectively and keep your web server running smoothly.
Faiz Shaikh

A Practical Guide to Monitoring Ubuntu Servers
Learn how to set up effective monitoring for your Ubuntu servers, from basic to advanced strategies, to keep your systems running smoothly.
Anjali Udasi

AWS Centralized Logging: A Complete Implementation Guide
Learn how to set up centralized logging in AWS, from basic setup to advanced implementations, with troubleshooting tips for smooth operations.
Anjali Udasi

The Ultimate Guide to GCP Logs for DevOps Engineers
Discover everything DevOps engineers need to know about GCP logs, from collection to analysis, to optimize performance and troubleshooting.
Preeti Dewani

What Is a Logging Formatter and Why Use One?
Learn what a logging formatter is, why it’s important, and how it helps make your logs easier to read and more useful for troubleshooting.
Faiz Shaikh

Simplifying Container Observability for DevOps Teams
Learn how to simplify container observability for your DevOps team by effectively tracking metrics, logs, and traces to improve performance.
Anjali Udasi

Apache Tomcat Performance Monitoring: Basics and Troubleshooting Tips
Learn how to monitor Apache Tomcat performance, troubleshoot common issues, and optimize your server for better reliability and efficiency.
Faiz Shaikh

A Guide to OpenTelemetry Tracing in Distributed Systems
Learn how OpenTelemetry tracing helps monitor and optimize distributed systems, providing valuable insights for DevOps teams.
Prathamesh Sonpatki

RUM vs Synthetic Monitoring: Understanding the Core Differences
Learn the key differences between RUM and synthetic monitoring, and how each approach helps track performance in real-time and preemptively.
Anjali Udasi

Prometheus Distributed Tracing: An Easy-to-Follow Guide for Engineers
Learn how to implement Prometheus distributed tracing in your microservices architecture to quickly identify and resolve performance issues.
Preeti Dewani

Adding OpenTelemetry to Your React Apps: A Practical Guide
Learn how to integrate OpenTelemetry into your React apps for improved observability and better performance tracking.
Prathamesh Sonpatki

What is API Monitoring and How to Build API Metrics Dashboards
API monitoring helps track performance, uptime, and errors. Learn how to build dashboards that give you real-time insights into API health.
Anjali Udasi

The Ultimate HBase Monitoring Guide for Engineers
Learn how to effectively monitor HBase performance with key metrics, tools, and best practices to ensure your cluster runs smoothly.
Faiz Shaikh

Trace ID vs Correlation ID: Understanding the Key Differences
Learn the difference between Correlation IDs and Trace IDs, and how they help track requests and diagnose issues in distributed systems.
Faiz Shaikh

Everything You Need to Know About OpenTelemetry Histograms
OpenTelemetry histograms help you go beyond averages. Learn how they work and why they matter for real-world observability in DevOps.
Prathamesh Sonpatki

How Does OpenTelemetry Logging Work?
OpenTelemetry logging helps standardize how logs are collected and processed across different systems, providing clear visibility into your apps.
Anjali Udasi

Why Should You Care About Endpoint Monitoring?
Understand why endpoint monitoring is crucial for tracking and securing key touchpoints between services, users, and security defenses.
Anjali Udasi

Why Grafana's Rate Function Is Your Dashboard's Best Kept Secret
Grafana’s rate() function helps you make sense of noisy metrics, spot trends faster, and build dashboards that tell a clearer story.
Anjali Udasi

How to Use OpenTelemetry with Your GraphQL Stack
Learn how to add observability to your GraphQL APIs using OpenTelemetry—track requests, monitor performance, and troubleshoot faster.
Anjali Udasi

Metrics Monitoring: The Only Guide You'll Need
Everything you need to know about metrics monitoring—what they are, why they matter, and how to use them to keep your systems healthy.
Faiz Shaikh

Getting Started with OpenTelemetry Custom Metrics
Learn how to use OpenTelemetry custom metrics to track what truly matters in your systems—and build more reliable, observable services.
Prathamesh Sonpatki

Traces & Spans: Observability Basics You Should Know
Learn how traces and spans help you see inside distributed systems—so you can troubleshoot faster and build more reliable software.
Anjali Udasi

Zabbix vs Grafana: Which Monitoring Tool Fits You Best?
Comparing Zabbix and Grafana? Here's a no-fluff look at which monitoring tool fits your stack, your team, and your future needs.
Faiz Shaikh

Loki vs Prometheus: Side-by-Side Comparison for Logs and Metrics
Loki handles logs. Prometheus handles metrics. Here’s a side-by-side look at what they do, how they work, and when to use each.
Anjali Udasi

Distributed Network Monitoring: Guide to Getting Started & Troubleshooting
A practical guide to getting started with distributed network monitoring and solving common issues across modern, complex systems.
Anjali Udasi

7 Top ELK Alternatives: Finding the Right Observability Stack
Discover the top 7 ELK stack alternatives for observability and find the right solution for your data and monitoring needs.
Anjali Udasi

How to Use MySQL Performance Analyzer
Learn how to optimize MySQL queries and identify bottlenecks with a performance analyzer to keep your database running smoothly.
Anjali Udasi

A Comprehensive Guide to Monitoring Disk I/O on Linux
Learn how to monitor and optimize disk I/O performance on Linux with this comprehensive guide to better manage system resources.
Anjali Udasi

Apache Cassandra Monitoring: Tools, Challenges & Best Practices
A quick guide to monitoring Apache Cassandra—tools that help, challenges to watch for, and tips to keep things running smoothly.
Anjali Udasi

GDPR Log Management: A Practical Guide for Engineers
Learn how to manage logs under GDPR—handle personal data, set retention rules, and stay compliant without losing observability.
Prathamesh Sonpatki

Ubuntu var log messages: A Complete Guide for System Admins
A complete guide to Ubuntu's /var/log/messages—your go-to log file for system events, errors, and troubleshooting insights.
Preeti Dewani

Getting Started with Elastic Load Balancer (ELB) Metrics
Learn the key ELB metrics that help you monitor traffic, spot issues early, and keep your load balancers running smoothly in production.
Anjali Udasi

A Closer Look at Docker Build Logs for Troubleshooting
Understand Docker build logs to troubleshoot errors, optimize builds, and keep your containers running smoothly.
Faiz Shaikh

How to Connect ELK Stack with Grafana
Learn how to connect ELK with Grafana to bring logs and dashboards together for better visibility across your systems.
Anjali Udasi

Everything You Need to Know to Start Monitoring Postgres
Learn the essentials of Postgres monitoring, from key metrics to best practices, and ensure your database stays healthy in production environments.
Faiz Shaikh

What is /var/log: Understanding Linux System Logs
Learn what /var/log is, why it matters, and how understanding Linux system logs can help you troubleshoot and maintain systems more effectively.
Anjali Udasi

Log Consolidation Made Easy for DevOps Teams
Log consolidation simplifies managing and analyzing data for DevOps teams, improving efficiency and streamlining operations across systems.
Faiz Shaikh

APM Observability: A Practical Guide for DevOps and SREs
A no-fluff guide to APM observability for DevOps and SREs—tools, tips, and what actually matters when keeping systems healthy.
Anjali Udasi

Getting Started with Prometheus Metrics Endpoints
Learn how to get started with Prometheus metrics endpoints to collect, expose, and query critical data for better system monitoring.
Anjali Udasi

Troubleshooting LoggerFactory Logging Issues
Running into LoggerFactory.getLogger errors in Java? Here’s how to fix common logging issues and get your logs flowing again—fast.
Preeti Dewani

Database Monitoring Metrics: Each Stage Guide (2025)
Not all database metrics are created equal. Learn which ones to track, why they matter, and how they help you stay ahead of performance issues.
Faiz Shaikh

Histogram Buckets in Prometheus Made Simple
Learn how Prometheus histogram buckets work, why they matter, and how to fine-tune them for better observability and smarter alerting.
Prathamesh Sonpatki

How to Use OpenTelemetry with Postgres
Learn how to set up OpenTelemetry with Postgres to trace queries, monitor performance, and get better visibility into your database activity.
Prathamesh Sonpatki

Logging vs Monitoring: What’s the Real Difference?
Logging and monitoring work together, but they’re not the same. Here’s how they help you understand, fix, and improve your systems.
Anjali Udasi

Debug Logging: A Comprehensive Guide for Developers
A clear guide to debug logging—what it is, how to use it well, and why it matters when you're trying to understand what your code is doing.
Anjali Udasi

Observability vs APM: Complete Comparison Guide 2025
Observability goes beyond APM—it's not just about metrics, it's about understanding why things break, not just that they did.
Anjali Udasi

How to Use Prometheus for APM
Learn how to turn Prometheus into a powerful APM tool—track app performance, reduce guesswork, and get real visibility into your systems.
Prathamesh Sonpatki

Regex Optimization Techniques: 14 Methods for DevOps Performance
A practical guide to writing better regex—cleaner, faster patterns that won’t trip up your logs, scripts, or search tools.
Anjali Udasi

HAProxy vs NGINX Performance: A Comprehensive Analysis
Compare HAProxy and NGINX performance with real-world insights. Find out which one handles traffic, load, and speed better for your setup.
Faiz Shaikh

Logstash Grok Examples: A Detailed Guide to Pattern Matching
Learn how to use Logstash Grok with simple examples. Match and parse logs easily using patterns that are easy to understand.
Anjali Udasi

FastAPI Python for Infra and Ops, Made Simple
Build fast, async-ready Python APIs that simplify tooling, automation, and observability pipelines.
Anjali Udasi

Comparing ELK, Grafana, and Prometheus for Observability
A clear-eyed look at ELK, Grafana, and Prometheus—how they handle logs, metrics, and alerts, and which one fits your observability goals best.
Anjali Udasi

Envoy vs HAProxy: Which Proxy Server Is Right for Your Infrastructure?
Envoy or HAProxy? Pick the right proxy server for performance, observability, and scale—without the jargon.
Faiz Shaikh

How to View and Understand VPC Flow Logs
Learn how to view and make sense of VPC Flow Logs—spot issues, trace traffic, and decode what’s really happening inside your cloud network.
Anjali Udasi

OpenTelemetry for Spring: Full Implementation Guide
Set up OpenTelemetry in your Spring app with ease. This guide covers implementation, common issues, and how to get tracing working right.
Prathamesh Sonpatki

Java Util Logging Configuration: A Practical Guide for DevOps & SREs
A hands-on guide to setting up and managing Java Util Logging—built for DevOps and SREs who need clarity, not more config headaches.
Anjali Udasi

An Easy Guide to Pausing Docker Containers
Learn how to pause and resume Docker containers safely—handy for debugging, saving resources, or just hitting pause without stopping everything.
Anjali Udasi

Essential Unix Commands Cheat Sheet for DevOps Engineers
A practical Unix commands cheat sheet for DevOps engineers — no fluff, just the essentials you’ll use in day-to-day operations.
Faiz Shaikh

Java GC Logs: How to Read and Debug Fast
When Java apps slow down, GC logs often hold the clues. This guide helps you read and debug them fast—no jargon, just what you need.
Anjali Udasi

Pod Memory Usage: Tracking, Commands & Troubleshooting
Learn how to track pod memory usage, run key kubectl commands, and troubleshoot spikes before they crash your Kubernetes apps.
Anjali Udasi

API Latency: Definition, Measurement, and Optimization Techniques
Learn what API latency really means, how to measure it the right way, and practical ways to make your APIs respond faster.
Anjali Udasi

The Ultimate Guide to Ubuntu Performance Monitoring
A practical guide to monitoring performance on Ubuntu—tools, tips, and commands to keep your system running efficiently.
Faiz Shaikh

The Role of Log Shippers in Your Stack
Log shippers quietly move logs to where they’re needed—making debugging, monitoring, and observability possible without the chaos.
Anjali Udasi

Best 6 AWS EC2 Alternatives for DevOps Teams in 2025
Explore the top 6 AWS EC2 alternatives for DevOps teams in 2025. Compare cost, performance, and features to find the best fit for your needs.
Anjali Udasi

How to Master Log Management with Logrotate in Docker Containers
Manage logs in Docker with Logrotate. Keep them small, organized, and automatically cleaned up.
Anjali Udasi

Kubernetes ContainerPort Explained: A Practical Guide for 2026
Confused by ContainerPort in Kubernetes? This guide breaks down what it is, why you need it, and how to configure it with clear, step-by-step examples. Avoid common networking errors.
Anjali Udasi

Log4j vs Log4j2: Which Logging Framework Should You Choose
Choosing between Log4j and Log4j2? Log4j2 offers better performance, security, and flexibility. Here's why it might be the right choice for you.
Faiz Shaikh

Why Do You Need a Redis Monitor in Place?
A Redis monitor helps track performance, spot memory issues, and prevent unexpected failures—ensuring stability before problems escalate.
Prathamesh Sonpatki

How Sumo Logic Pricing Works
Sumo Logic pricing varies based on data volume, retention, and features. Understanding the costs can help you choose the right plan for your needs.
Faiz Shaikh

When Should You Enable Trace-Level Logging?
Enable trace-level logging when diagnosing complex issues, tracking request flow, or debugging performance without drowning in data.
Anjali Udasi

9 Best Container Monitoring Tools You Should Know in 2025
Discover the 9 best container monitoring tools of 2025—optimize performance, track issues, and keep your infrastructure running smoothly!
Anjali Udasi

Breaking Down Splunk Costs for SREs and DevOps Teams
Explore Splunk's pricing and how it impacts SREs and DevOps teams. Learn how to manage costs while maintaining performance.
Anjali Udasi

Reliability vs Availability: A Simple Breakdown
Reliability and availability are crucial concepts in DevOps. Here's a simple breakdown to help you understand their key differences and importance.
Anjali Udasi

Java Logging: Troubleshooting Tips and Best Practices
Having trouble with Java logs? Here are some simple troubleshooting tips and best practices to keep your logs clear and helpful.
Faiz Shaikh

Python Loguru: The Logging Cheat Code You Need in Your Life
If logging in Python feels like a chore, Loguru is the cheat code you need—zero boilerplate, rich features, and pure simplicity!
Preeti Dewani

New Relic vs Datadog: The Complete Comparison
New Relic or Datadog? Compare features, pricing, and performance to find the right observability tool for your needs.
Anjali Udasi

MySQL Logs: Your Guide for Database Performance
Struggling with slow queries? MySQL logs hold the answers! Learn how to read them, fix issues, and boost your database performance.
Faiz Shaikh
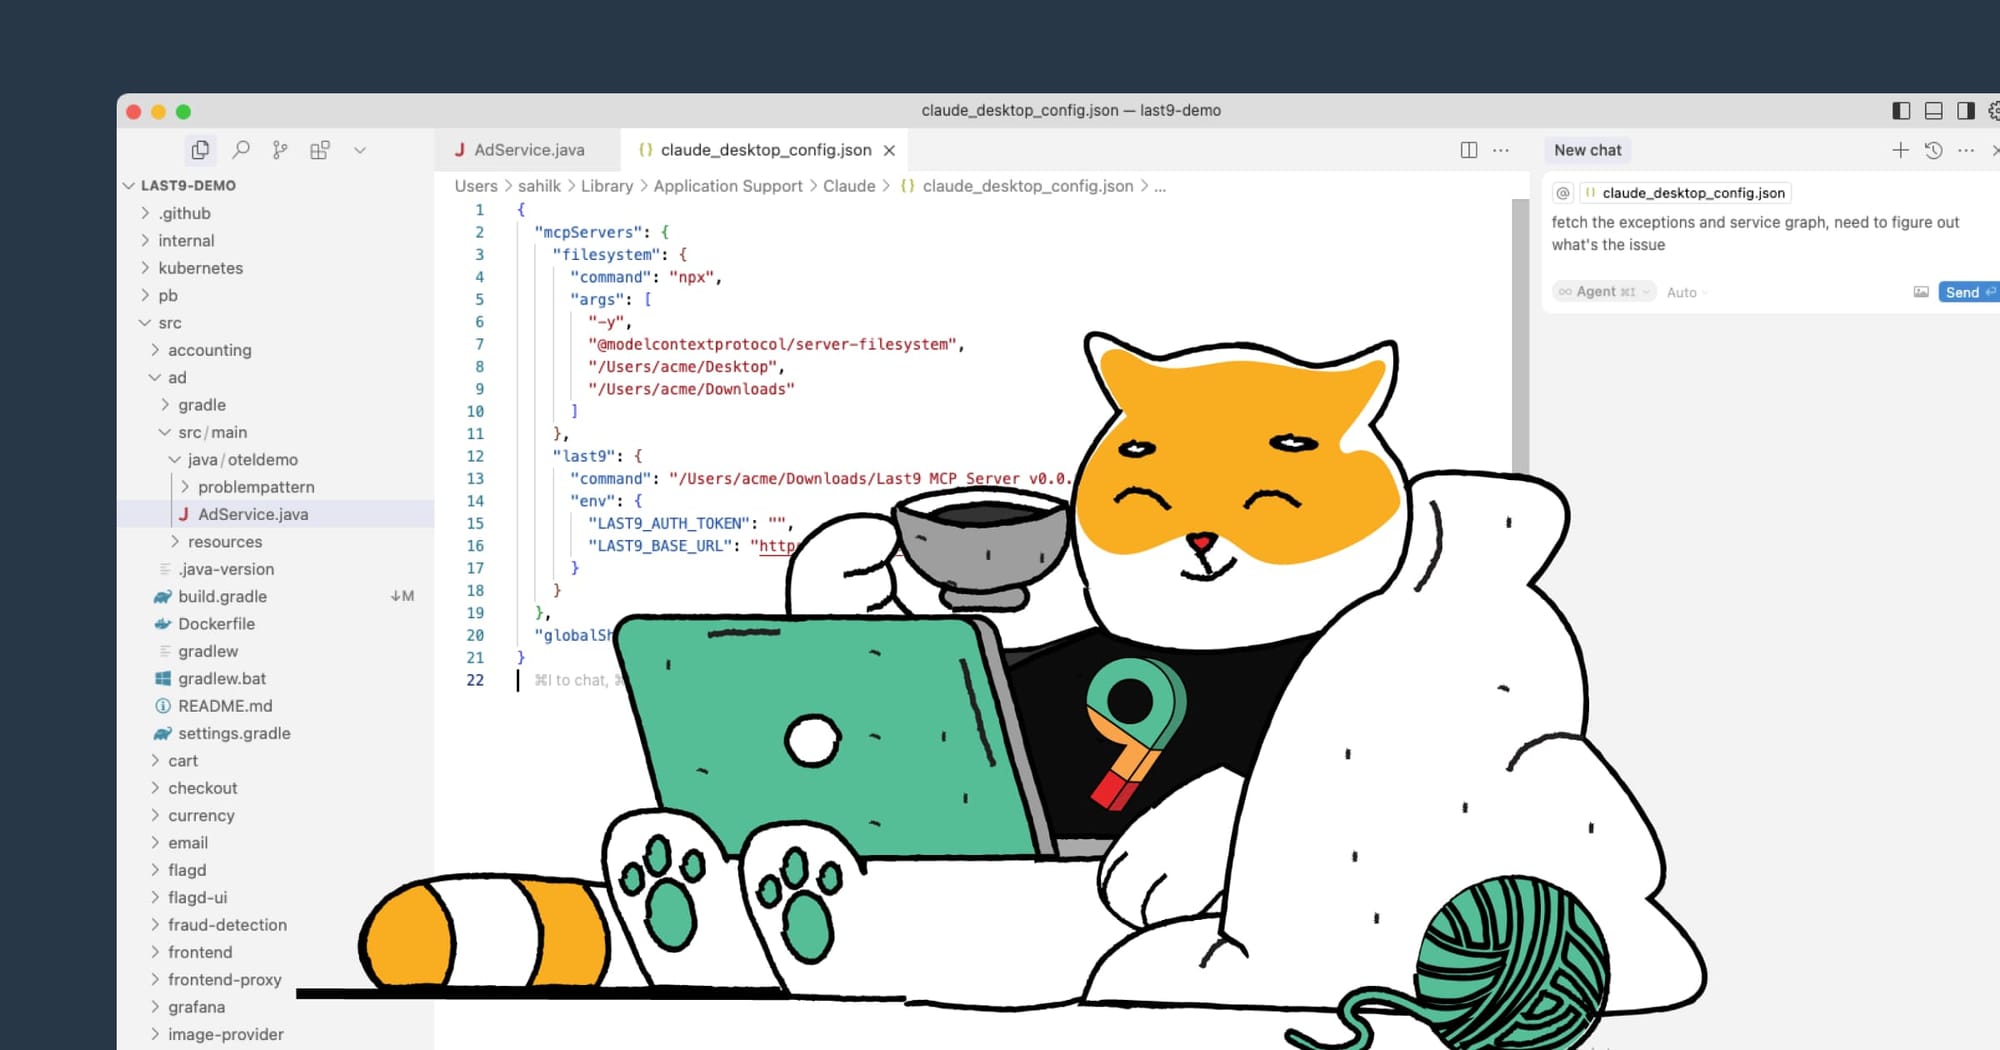
Last9 MCP Server: Fix Production Issues in Your Local Environment
Ask your agent to bring production context to your local environment, debug issues, and fix them. Sit back and vibe monitor.
Nishant Modak

SRECon Americas 2025 Recap Day 3
Day 3 at SRECon Americas 2025—insights, talks stories, and lessons learned. Catch the highlights from the final day!
Prathamesh Sonpatki

SRECon Americas 2025 Recap Day 2
Highlights from SREcon Americas 2025 Day 2—key takeaways, SRE challenges, and lessons from industry leaders.
Prathamesh Sonpatki

Getting Started with E-commerce Audit Logs: A Simple Guide
Learn how to set up e-commerce audit logs to track changes, ensure security, and maintain compliance—without adding unnecessary complexity.
Anjali Udasi

21 PromQL Tricks Every Developer Should Know
Boost your PromQL skills with these 21 handy tricks—optimize queries, troubleshoot faster, and get deeper insights from your metrics.
Preeti Dewani

Docker Compose Health Checks: An Easy-to-follow Guide
Ensure your containers are truly ready, not just running. This guide covers Docker Compose health checks and how to use them effectively.
Anjali Udasi

An Easy and Comprehensive Guide to Prometheus API
Unlock the full potential of Prometheus API with this easy yet comprehensive guide—learn how to query, integrate, and automate monitoring.
Faiz Shaikh

SRECon Americas 2025 Recap Day 1
Key takeaways from Day 1 at SRECon Americas 2025—insights, challenges, and what’s shaping the future of site reliability engineering.
Prathamesh Sonpatki

Linux Event Logs: Your Troubleshooting Guide
Lost in Linux event logs? This guide helps you decode, filter, and troubleshoot issues like a pro—no more staring at endless logs in despair!
Anjali Udasi

Ubuntu Crash Logs: Find, Fix, and Prevent System Failures
Learn how to find and use Ubuntu crash logs to troubleshoot issues, prevent future failures, and keep your system running smoothly.
Preeti Dewani

RabbitMQ Logs: Monitoring, Troubleshooting & Configuration
If RabbitMQ queues are backing up or messages aren’t being consumed, logs can help you figure out what’s wrong. Here’s how to monitor and fix issues.
Prathamesh Sonpatki

Top 7 Microservices Monitoring Tools to Consider in 2025
Get the right tools to monitor your microservices in 2025. Track performance, detect issues, and keep your systems running smoothly.
Anjali Udasi

End-to-End Monitoring: Your Guide to System Visibility
Get full visibility into your system with end-to-end monitoring. Understand issues faster and keep your applications running smoothly.
Faiz Shaikh

Zero Code Instrumentation: The Missing Link in Observability
Struggling with gaps in your monitoring? Zero code instrumentation fills them by capturing key telemetry without modifying your code.
Anjali Udasi

Observability Pipeline: An Easy-to-Follow Guide for Engineers
Learn how to build and optimize observability pipelines with this easy-to-follow guide designed for engineers.
Anjali Udasi

An In-Depth Metricbeat Guide for DevOps Teams
Learn how to set up, configure, and optimize Metricbeat for system monitoring. A must-read guide for DevOps teams looking to streamline observability.
Preeti Dewani

No-Jargon Guide to Application Dependency Mapping
Cut through the complexity! This no-jargon guide simplifies application dependency mapping for better system clarity and reliability.
Faiz Shaikh

What Is CDN? The Complete Guide for DevOps Engineers
A CDN improves site speed, reliability, and security by distributing content across global servers. Here’s what DevOps engineers need to know.
Anjali Udasi

Your Observability Questions, Answered
Get clear answers to the most common observability questions—tools, best practices, and strategies for better monitoring.
Anjali Udasi

Website Logging: Everything You Need to Get Started
Learn what website logging is, why it matters, and which tools can help you track issues, improve performance, and keep your site running smoothly.
Anjali Udasi

OpenTelemetry Backends: A Practical Implementation Guide
Learn how to choose, set up, and optimize an OpenTelemetry backend for better observability, faster troubleshooting, and improved performance.
Prathamesh Sonpatki

Log File Analysis: A Guide for DevOps Engineers
Learn how to analyze log files effectively, troubleshoot issues faster, and improve system reliability with this practical guide for DevOps engineers.
Faiz Shaikh

Syslog Servers Explained: How They Help with Logging
A syslog server collects and centralizes logs, making troubleshooting faster and easier. Learn how it works and why it’s useful.
Preeti Dewani

systemctl: The Complete Guide to Managing Linux Services
Learn how to use systemctl to start, stop, and manage services on Linux. From basics to advanced tips, this guide covers it all.
Prathamesh Sonpatki

Distributed Tracing: An Advanced Guide for DevOps & SREs
Learn how to implement distributed tracing effectively with this advanced guide for DevOps and SREs—optimize performance and troubleshoot faster.
Anjali Udasi
![Full-Stack Observability: What It Is [Minus the Fluff]](https://last9.ghost.io/content/images/2025/03/observability.webp)
Full-Stack Observability: What It Is [Minus the Fluff]
Get a clear, no-nonsense look at full-stack observability—what it is, why it matters, and how it helps you stay on top of your systems.
Anjali Udasi
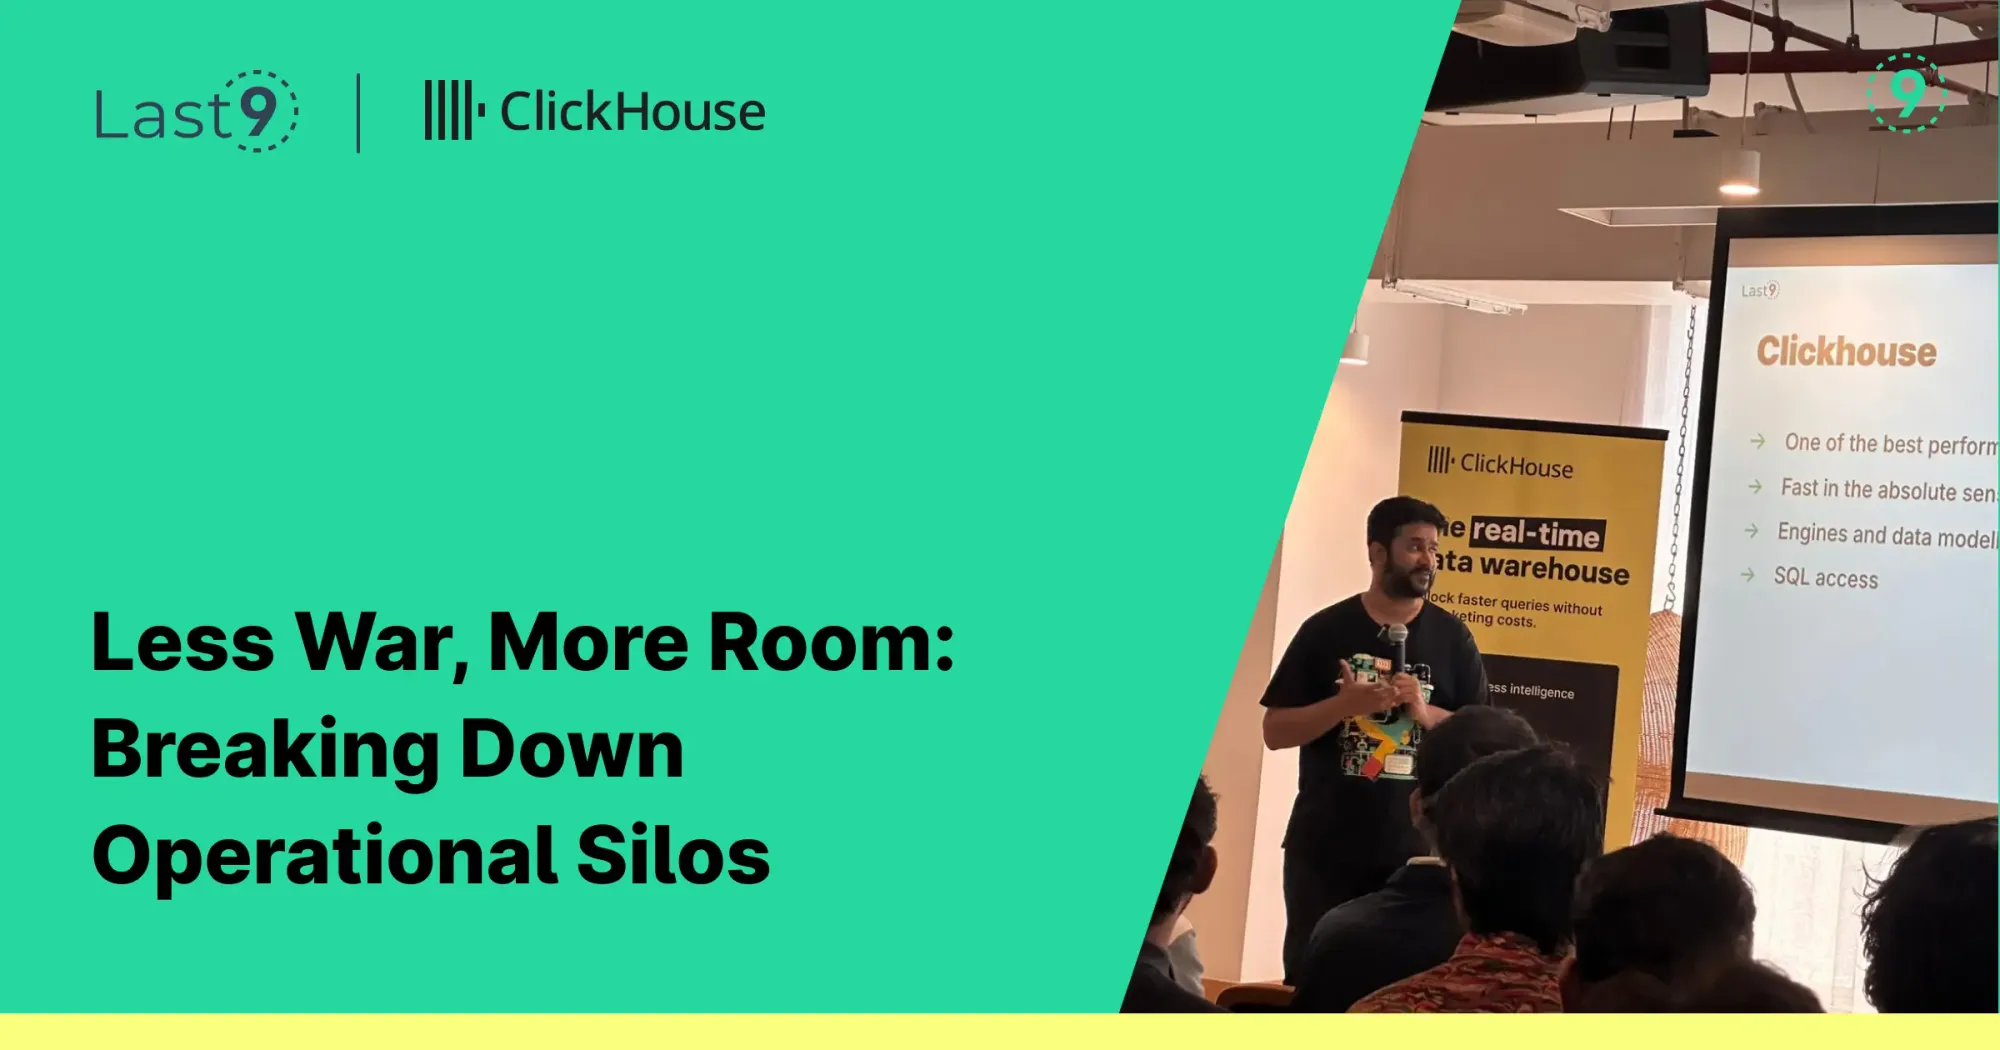
Less War, More Room: Breaking Down Operational Silos
Our Dev Evangelist, Prathamesh Sonpatki, shared insights on alert fatigue at a ClickHouse meetup—sparking great conversations on observability.
Prathamesh Sonpatki
Sahil Khan

Essential Prometheus Queries: Simple to Advanced
Learn essential Prometheus queries, from simple to advanced, to monitor, troubleshoot, and optimize your systems with confidence.
Anjali Udasi

How to Set Up Logging in Node.js (Without Overthinking It)
Set up logging in Node.js without the headache—learn the essentials, pick the right tools, and keep it simple yet effective.
Preeti Dewani

The Complete Guide to Monitoring Container CPU Usage
Find out how to track container CPU usage, catch performance issues early, and keep your workloads running efficiently.
Anjali Udasi

A Practical Guide to the OpenTelemetry Java Agent
Learn how to set up, configure, and optimize the OpenTelemetry Java Agent for better observability and performance monitoring.
Prathamesh Sonpatki

How Do Dropwizard Metrics Help Monitor Application Performance?
Learn how Dropwizard Metrics tracks performance, latency, and system health, helping you monitor and optimize your applications effectively.
Anjali Udasi

What is Log Data? The SRE's Essential Guide
Learn how log data helps SREs debug issues, monitor performance, and understand system behavior effectively.
Anjali Udasi

Performance Impact of High Cardinality in Time-Series DBs
High cardinality in time-series databases can slow queries, increase storage costs, and strain indexing. Here’s how it impacts performance and scaling.
Anjali Udasi

Syslog Monitoring: A Guide to Log Management and Analysis
Master syslog monitoring to track system events, troubleshoot issues faster, and keep your infrastructure running smoothly.
Anjali Udasi

Prometheus Port Configuration: A Detailed Guide
Learn how to configure Prometheus ports correctly, whether using defaults or custom settings, to keep your monitoring setup running smoothly.
Prathamesh Sonpatki

How to Configure SAML SSO with Keycloak
Learn how to set up SAML SSO with Keycloak for secure authentication, manage user access, and integrate it with your applications.
Anjali Udasi

PHP Error Logs: The Complete Troubleshooting Guide You Need
Learn how to use PHP error logs to quickly identify and fix issues in your application, turning troubleshooting into a structured process.
Preeti Dewani

Getting Started with OpenTelemetry JavaScript
Learn how to set up OpenTelemetry JavaScript to capture traces, metrics, and logs, so you can spot issues before they become real problems.
Prathamesh Sonpatki

Auto Instrumentation: An In-Depth Guide
Auto instrumentation simplifies telemetry by capturing traces, metrics, and logs without code changes. Here’s how it works and why it matters.
Anjali Udasi
![A Guide to Fixing Kafka Consumer Lag [Without Jargon]](https://last9.ghost.io/content/images/2025/03/kafka.webp)
A Guide to Fixing Kafka Consumer Lag [Without Jargon]
Learn simple, practical strategies to fix Kafka consumer lag and keep your data pipeline running smoothly without the jargon.
Prathamesh Sonpatki

Retrieving All Keys in Redis: Commands & Best Practices
Learn how to retrieve all keys in Redis efficiently. Explore key commands, performance tips, and best practices to avoid slowing down your database.
Anjali Udasi

Logging Best Practices to Reduce Noise and Improve Insights
Too many logs, not enough clarity? Follow these logging best practices to cut through the noise and get the insights that actually matter.
Prathamesh Sonpatki

Elasticsearch vs. Solr: What Developers Need to Know in 2025
Compare Elasticsearch and Solr in 2025 with this guide for developers. Understand their key differences and which is best for your project.
Anjali Udasi

How to Make the Most of Redis Pipeline
Learn how Redis pipeline can boost performance by batching commands, reducing network overhead, and improving throughput with minimal code changes.
Anjali Udasi

Last9 Feb ‘25 Recap: What’s New
Catch up on Last9’s February 2025 updates, including new features, key highlights, and upcoming events.
Sahil Khan

Dynatrace vs. AppDynamics: 2025 Performance Monitoring Guide
Compare Dynatrace and AppDynamics in 2025—features, performance, and real-world usability to help you choose the right monitoring tool.
Anjali Udasi

Nginx Logging: A Complete Guide for Beginners
Learn how to set up, manage, and optimize Nginx logging for better debugging, monitoring, and performance insights in your applications.
Aditya Godbole

OpenSearch Operator: Deployment, Scaling, and Optimization
Optimize OpenSearch Operator for seamless deployment, scaling, and performance in Kubernetes. Automate management and enhance efficiency!
Preeti Dewani

Prometheus API: From Basics to Advanced Usage
Learn how to use the Prometheus API, from basic queries to advanced techniques, to monitor and analyze your system metrics effectively.
Prathamesh Sonpatki

journalctl Commands Cheatsheet for Troubleshooting
Quickly diagnose and resolve system issues with this journalctl cheat sheet—essential commands for filtering, viewing, and analyzing logs.
Anjali Udasi

An In-depth Guide on Ubuntu ZFS Guide
Thinking of using ZFS on Ubuntu? This guide breaks it down—setup, snapshots, RAID, and tips to keep your storage fast and reliable.
Anjali Udasi

Advanced Container Resource Monitoring with docker stats
Go beyond basics with docker stats! Learn how to monitor container CPU, memory, and I/O like a pro for peak performance.
Preeti Dewani

Why Server Health Monitoring Matters (And How to Do It Right)
Monitoring server health helps prevent downtime, spot issues early, and keep systems running smoothly. Here’s how to do it the right way.
Anjali Udasi

The Ultimate Guide to Docker Clear Logs
Learn how to monitor, manage, and clear Docker logs efficiently to free up space, improve performance, and keep your containers running smoothly.
Anjali Udasi

How to Read System Logs Without the Headache
System logs hold the clues to system issues—but they can be overwhelming. Learn how to read, filter, and analyze logs without the hassle.
Anjali Udasi

Windows Event Logs: Monitoring, Alerts, and Compliance
Learn how to monitor Windows Event Logs, set up alerts, and ensure compliance with proper log retention and archiving strategies.
Anjali Udasi

Everything You Need to Know About SIEM Logs
SIEM logs help detect threats and improve security. Learn how they work, why they matter, and how to use them effectively.
Anjali Udasi

Getting Started with the Grafana API: Practical Use Cases
Learn how to use the Grafana API to automate dashboards, manage users, and set up alerts—saving time and reducing manual effort.
Prathamesh Sonpatki

Python Logging Exceptions: The Setup Guide You Actually Need
Set up Python exception logging the right way—capture errors, add context, and integrate with monitoring tools for better debugging.
Preeti Dewani

Getting Started with Golang ORMs: A Beginner's Guide
Learn how Golang ORMs simplify database interactions, explore popular options, and get started with the right choice for your project.
Prathamesh Sonpatki

The Complete Guide to OpenTelemetry and APM
Learn how OpenTelemetry and APM work together to give you better visibility into your applications, from tracing requests to monitoring performance.
Anjali Udasi

Nginx Error Logs: Troubleshooting and Security Guide
Learn how to analyze Nginx error logs to troubleshoot issues, detect security threats, and improve performance with practical strategies.
Preeti Dewani

EC2 Monitoring: A Practical Guide for AWS Engineers
Learn how to monitor EC2 instances effectively, reduce costs, and prevent outages with practical insights for AWS engineers.
Anjali Udasi

How to Use journalctl --last to Check Recent System Logs
Use journalctl --last to quickly view recent system logs and troubleshoot issues by checking what happened just before an error or crash.
Prathamesh Sonpatki

What is OOM? A Guide to Out of Memory Issues
If your app crashes with an OOM error, it’s running out of memory. Here’s why it happens and how to fix it—no deep technical knowledge needed.
Anjali Udasi

How to Fix java.lang.OutOfMemoryError: Java Heap Space (with Code Examples)
Struggling with the dreaded java.lang.OutOfMemoryError? Learn the common causes and how to fix them with our step-by-step guide, including practical code examples and long-term solutions.
Prathamesh Sonpatki

CloudFront on AWS: Basics & Setup Guide
Learn how AWS CloudFront speeds up content delivery, reduces latency, and improves performance. A quick guide to setup and basics.
Preeti Dewani

OpenTelemetry vs. Datadog: Key Differences Explained
Comparing OpenTelemetry and Datadog? Explore their differences in monitoring, logging, and observability to find the right fit for your needs.
Anjali Udasi

Prometheus Functions: How to Make the Most of Your Metrics
Dig into your Prometheus metrics with functions that help you filter, analyze, and spot trends—so you can make sense of your data faster.
Preeti Dewani

9 Powerful Zabbix Alternatives You Shouldn’t Ignore
Looking for a Zabbix alternative? Explore 9 powerful monitoring tools that offer better scalability, flexibility, and ease of use.
Anjali Udasi

Your Go-To Linux Commands Cheat Sheet
Speed up your workflow with this Linux commands cheat sheet—practical, easy to follow, and packed with real-world use cases.
Anjali Udasi

How to Effectively Monitor Nginx and Prevent Downtime
Learn how to monitor Nginx effectively, track key metrics, analyze logs, and prevent downtime with the right tools and best practices.
Anjali Udasi

OpenTelemetry Agents: A Production Guide for Zero-Code Instrumentation
Discover how OpenTelemetry agents collect, process, and export telemetry data—plus how to set them up and avoid common pitfalls.
Prathamesh Sonpatki

A Guide to Configuring Logback for Java Applications
Configuring Logback in Java involves setting up loggers, appenders, and layouts in the logback.xml file to control logging behavior.
Anjali Udasi

Getting Started with OpenTelemetry for Browser Monitoring
Learn how to set up OpenTelemetry in your browser applications to track performance, capture telemetry data, and improve monitoring.
Preeti Dewani

How to Implement OpenTelemetry in NestJS
Learn how to integrate OpenTelemetry with NestJS to capture and export traces, improving observability and performance monitoring.
Aditya Godbole

Elasticsearch Reindex API: A Guide to Data Management
Learn how to use the Elasticsearch Reindex API for efficient data migration, restructuring, and management in your search and analytics workflows.
Prathamesh Sonpatki

Pino.js: The Ultimate Guide to High-Performance Node.js Logging
Speed up your Node.js application with Pino, the fastest JSON logger available. Our guide covers setup, best practices, and advanced usage to optimize your logging performance
Prathamesh Sonpatki

8 Best Grafana Alternatives: Open-Source & Commercial
Explore the top 8 Grafana alternatives, including open-source and commercial tools, to find the best monitoring solution for your needs.
Anjali Udasi

OpenTelemetry Metrics Aggregation: A Detailed Guide
Learn how OpenTelemetry handles metric aggregation, from delta and cumulative temporality to organizing and analyzing performance data.
Anjali Udasi

The 9 Best Sentry Alternatives for Error Monitoring in 2025
Discover the top 9 Sentry alternatives for error monitoring in 2025, offering scalable, cost-effective solutions for your team's needs.
Anjali Udasi

How to Build Observability into Chaos Engineering
Learn how to integrate observability into chaos engineering to better understand system behavior and improve resilience during failures.
Anjali Udasi

Complete OpenTelemetry Implementation Guide for Next.js
Learn how to implement OpenTelemetry in Next.js to monitor performance, trace requests, and gain insights into your application's behavior.
Preeti Dewani

Prometheus with Docker Compose: The Complete Setup Guide
Learn how to set up, configure, and run Prometheus with Docker Compose for efficient monitoring, alerting, and visualization.
Prathamesh Sonpatki

Apache Monitoring: Setup Guide, Tools, and Best Practices
Learn how to monitor Apache effectively with this guide on setup, essential tools, and best practices for performance optimization.
Anjali Udasi

OpenTelemetry Visualization Setup: A Developer's Guide
Learn how to set up OpenTelemetry visualization, choose the right tools, and configure dashboards for actionable insights.
Prathamesh Sonpatki

How to Use OpenSearch with Python for Search and Analytics
Learn how to set up, index data, run queries, and secure OpenSearch with Python for efficient search and analytics.
Preeti Dewani

MongoDB Monitoring: Everything You Need to Know
Discover the essentials of MongoDB monitoring, including key metrics, best practices, and top tools to optimize performance and security.
Anjali Udasi

An In-Depth Guide to Java Performance Monitoring for SREs
Learn how SREs can optimize Java performance with real-time monitoring, proactive insights, and the right observability tools.
Preeti Dewani

Integrating OpenTelemetry with Grafana for Better Observability
Learn how to integrate OpenTelemetry with Grafana to collect, visualize, and analyze telemetry data for better monitoring and observability.
Aditya Godbole

OpenTelemetry UI: The Ultimate Guide for Developers
Explore the best OpenTelemetry UIs for tracing, metrics, and observability. Find the right tool to optimize performance and debugging.
Prathamesh Sonpatki

Your 2025 Guide to the 11 Best Infrastructure Monitoring Tools
Discover the top 11 infrastructure monitoring tools for 2025, from open-source to fully managed solutions, and find the best fit for your stack.
Anjali Udasi

OpenTelemetry Java: A Detailed Guide with Examples and Troubleshooting
Learn how to set up OpenTelemetry in Java with examples, best practices, and troubleshooting tips to monitor and optimize your applications.
Anjali Udasi

Top 13 Kafka Monitoring Tools You Should Know
Discover the top 13 Kafka monitoring tools for efficient observability, real-time insights, and optimal performance in your data streams.
Anjali Udasi

Redis Metrics: Monitoring, Performance, and Best Practices
Learn how to monitor Redis metrics, optimize performance, and follow best practices to ensure reliability and efficiency in your deployments.
Anjali Udasi

How to Use OpenTelemetry for Kubernetes Autoscaling Metrics
Learn how to use OpenTelemetry to collect custom metrics for Kubernetes autoscaling, enabling smarter, workload-driven scaling decisions.
Prathamesh Sonpatki

OpenTelemetry vs. ELK: Key Differences and When to Use Each
Compare OpenTelemetry and ELK to understand their key differences, use cases, and when to use each for effective observability and logging.
Anjali Udasi

How to Overcome Challenges and Scale the OpenTelemetry Collector
Learn how to tackle scaling challenges and implement effective strategies to optimize the OpenTelemetry Collector for high performance and reliability.
Aditya Godbole

A Quick Guide for OpenTelemetry Python Instrumentation
Learn how to instrument your Python applications with OpenTelemetry to gain insights, track performance, and troubleshoot issues effectively.
Prathamesh Sonpatki

Linux OOM Killer: A Detailed Guide to Memory Management
Learn how the Linux OOM Killer manages memory pressure, terminates processes, and ensures system stability when memory runs low.
Anjali Udasi

Helm vs Terraform: A Detailed Comparison for Developers
Helm and Terraform are powerful tools for managing Kubernetes applications and infrastructure, each serving distinct roles in DevOps workflows.
Anjali Udasi

Tomcat Logs: Locations, Types, Configuration, and Best Practices
Learn about Tomcat logs: their locations, types, configuration, and best practices to optimize performance and troubleshoot efficiently.
Anjali Udasi

Kubernetes QoS Explained: Classes & Resource Management
Kubernetes QoS ensures efficient resource allocation by categorizing pods into Guaranteed, Burstable, and BestEffort classes based on requests and limits.
Anjali Udasi

The Ultimate Guide to HAProxy Log Format
Learn how to read, customize, and optimize HAProxy logs to gain valuable insights and improve performance with our ultimate guide.
Preeti Dewani

An Easy Guide to OpenFeature Flagging
Learn how to get started with OpenFeature flagging and manage feature rollouts seamlessly in this easy-to-follow guide.
Anjali Udasi

What is DynamoDB Throttling and How to Fix It
DynamoDB throttling occurs when requests exceed table capacity. Learn how to identify, prevent, and resolve throttling issues effectively.
Anjali Udasi

Understanding Syslog Formats: A Quick and Easy Guide
Learn the basics of syslog formats, from BSD to RFC 5424 and JSON, and how they impact log management and troubleshooting.
Anjali Udasi
Elastic vs. Splunk: Which One Is Right for You?
Compare Elastic and Splunk on pricing, scalability, and features to find the best fit for your log management and observability needs.
Anjali Udasi

Log Retention: Policies, Best Practices & Tools (With Examples)
Learn key log retention best practices, tackle challenges, and adopt effective strategies to optimize storage, compliance, and performance.
Anjali Udasi

Telemetry Data Platform: Everything You Need to Know
Learn how a telemetry data platform helps monitor, analyze, and optimize system performance for complex, scalable environments.
Anjali Udasi

Types of Pods in Kubernetes: An In-depth Guide
Learn about different pod types in Kubernetes, their use cases, and best practices to optimize deployment and performance.
Anjali Udasi

Ubuntu System Logs: How to Find and Use Them
Learn how to find, analyze, and manage Ubuntu system logs to troubleshoot issues, monitor performance, and enhance system security.
Anjali Udasi

How to Filter Docker Logs with Grep
Learn how to filter Docker logs using grep for faster debugging and log analysis. Find errors, track events, and refine searches with ease.
Anjali Udasi
Monitoring Kubernetes Resource Usage with kubectl top
Learn how to efficiently monitor Kubernetes resource usage with the kubectl top command, and optimize your cluster's performance and efficiency.
Faiz Shaikh

AWS CSPM Explained: How to Secure Your Cloud the Right Way
Learn how AWS CSPM helps detect misconfigurations, ensure compliance, and automate security, keeping your cloud environment secure.
Anjali Udasi
Distributed Tracing 101: Definition, Working and Implementation
Learn the basics of distributed tracing, how it works, and how to implement it for better observability in your microservices architecture.
Anjali Udasi

The Ultimate Guide to OpenTelemetry Visualization
Learn how to turn OpenTelemetry data into actionable insights with effective visualization techniques, best practices, and tool selection.
Prathamesh Sonpatki

Log Levels: Answers to the Most Common Questions
Get clear answers to common log-level questions, from choosing the right level to mapping logs to Syslog.
Anjali Udasi

How Azure Observability Optimizes Performance and Monitoring
Learn how Azure Observability empowers you to monitor, optimize, and enhance the performance of your cloud applications and infrastructure.
Anjali Udasi

Everything You Need to Know About Microsoft Sentinel Pricing
Learn how Microsoft Sentinel pricing works, including cost-saving models, data retention fees, and optimization strategies.
Anjali Udasi

A Comprehensive Guide to Heaps in Java
Explore heaps in Java with this comprehensive guide, covering core operations, memory management, and essential concepts for developers.
Preeti Dewani

Apache Solr: Features, Architecture, and Use Cases
Explore Apache Solr’s features, architecture, and use cases to understand how it powers fast, scalable, and flexible search solutions.
Anjali Udasi

Postgres Logs 101: Types, Configuration, and Troubleshooting
Learn the essentials of PostgreSQL logs, including types, configuration tips, and troubleshooting strategies to optimize your database performance.
Anjali Udasi

NGINX Log Monitoring: What It Is, How to Get Started, and Fix Issues
Learn what NGINX log monitoring is, how to set it up, and how to troubleshoot issues to keep your server running smoothly and efficiently.
Anjali Udasi

How to Monitor Error Logs in Real-Time: An In-Depth Guide
Learn how to monitor error logs in real-time using various tools and techniques to enhance system stability and troubleshoot issues effectively.
Anjali Udasi
Sentry vs Datadog: Which is the Right Tool for Your DevOps Needs
Sentry is perfect for error tracking, while Datadog offers full-stack observability. Choose based on your DevOps needs and system complexity.
Anjali Udasi

AWS CloudWatch Custom Metrics: Types & Setup Guide [With Examples]
AWS CloudWatch custom metrics let you track application-specific data, monitor performance, and set alerts for key business and system metrics.
Anjali Udasi

Getting Started with OpenTelemetry Java SDK
Learn how to get started with the OpenTelemetry Java SDK to add observability to your application with traces, metrics, and logs.
Prathamesh Sonpatki

10 Kubernetes Monitoring Tools You Can't-Miss in 2025
Discover the top 10 Kubernetes monitoring tools in 2025 that help optimize performance, ensure reliability, and provide comprehensive observability.
Anjali Udasi

Top 11 API Monitoring Tools You Need to Know
Discover 11 top API monitoring tools to track performance, uptime, and reliability—helping you keep your APIs running smoothly.
Anjali Udasi
![Website Performance Benchmarks: What You Should Aim For [with Examples]](https://last9.ghost.io/content/images/2025/02/monitoring-927906281a0979ff.webp)
Website Performance Benchmarks: What You Should Aim For [with Examples]
Learn how to set realistic website performance benchmarks with examples, and discover what goals you should aim for to improve your site’s speed and UX.
Anjali Udasi

SSHD Logs 101: Configuration, Security, and Troubleshooting Scenarios
Learn how to configure SSHD logs, enhance security, and troubleshoot SSH connection issues with useful tips for effective log management.
Anjali Udasi

How to Master Zap Logger for Clean, Fast Logs
Learn how to use Zap Logger effectively for clean, fast logs in your applications with this simple, comprehensive guide.
Prathamesh Sonpatki

OpenTelemetry Processors: Workflows, Configuration Tips, and Best Practices
Explore OpenTelemetry processors: understand workflows, get configuration tips, and learn best practices for optimized observability.
Prathamesh Sonpatki

Logging in Go with Slog: A Detailed Guide
Learn how to simplify logging in Go with Slog. This guide covers customization, handlers, log levels, and more for effective logging.
Preeti Dewani

Logfiles: What They Reveal and How to Use Them
Know more about logfiles, what they reveal, and how to use them for better system performance, security, and troubleshooting.
Anjali Udasi

How to Spot and Fix Memory Leaks in Java?
Learn how to spot and fix Java memory leaks with practical tips, tools, and strategies to keep your application running smoothly.
Anjali Udasi

The Basics of Log Parsing (Without the Jargon)
Learn the basics of log parsing, from understanding logs to using the right tools, without all the technical jargon.
Anjali Udasi

JMX Metrics: Types, What to Monitor, and When to Check
Explore JMX metrics, the types to monitor, and when to check them for optimal Java application performance and proactive troubleshooting.
Anjali Udasi

JMX Monitoring: Your Go-To Guide for Java Application Management
Learn JMX monitoring to master Java app management, track performance, and ensure optimal health with this ultimate guide.
Anjali Udasi
Last9 Jan ‘25 Recap: What’s New
Catch up on Last9’s January 2025 updates—new features, key highlights, and upcoming events in observability.
Sahil Khan

Rails Logger: How to Customize, Configure, and Optimize Your Logs
Learn how to customize, configure, and optimize Rails Logger to improve logging and debugging in your application.
Prathamesh Sonpatki

MySQL Monitoring: Key Metrics, Built-in Tools, and Open-Source Solutions
Explore the pros and cons of open-source and commercial MySQL monitoring tools to find the best fit for your database needs.
Anjali Udasi

Pingdom Alternatives: The Best 7 Options for Website Monitoring
Looking for a Pingdom alternative? Explore the 7 best website monitoring tools for better insights, uptime tracking, and performance optimization.
Anjali Udasi

Pod Exec in K8s: Advanced Exec Scenarios and Best Practices
Learn advanced kubectl exec techniques in Kubernetes, covering best practices for troubleshooting, security, and resource management.
Prathamesh Sonpatki
Kubernetes Pods vs Nodes: What Sets Them Apart
Explore the key differences between Kubernetes Pods and Nodes to better understand their roles in container orchestration.
Anjali Udasi

OpenMetrics vs OpenTelemetry: A Detailed Comparison
Discover the key differences between OpenMetrics and OpenTelemetry, from scope and use cases to adoption and flexibility, to make an informed choice.
Anjali Udasi

Top 12 Dynatrace Alternatives: Compare Features, Pricing & More
Explore the best Dynatrace alternatives with feature comparisons, pricing insights, and user reviews to find the right observability tool for you.
Anjali Udasi

RUM Metrics Explained: What to Track for Better User Experience
Learn the key metrics in Real User Monitoring (RUM) and how to measure them for better performance and user experience insights.
Anjali Udasi

5 Common Incident Severity Levels You Should Know
Learn about the 5 common incident severity levels and how they impact your response to system issues, ensuring faster resolutions.
Anjali Udasi

Syslog Levels Made Simple: Why They Matter for Your Logs
Syslog levels help categorize log messages by severity, making it easier to monitor, troubleshoot, and prioritize system events.
Anjali Udasi

7 Best and Scalable SolarWinds Alternatives to Consider in 2025
Explore the top 7 scalable SolarWinds alternatives for 2025, offering powerful features, flexibility, and cost-effective solutions for your network.
Anjali Udasi

TCP Monitoring Made Simple: Keep Your Network in Check
Learn how TCP monitoring keeps your network fast, reliable, and free from issues like latency, packet loss, and connection hiccups.
Anjali Udasi

IoT Monitoring: Why It Matters and How to Do It Right?
Learn about IoT monitoring, its benefits, best practices, and use cases to optimize your systems and improve operational efficiency.
Anjali Udasi

Error Logs: What They Are, Why They Matter, and How to Use Them
Error logs are vital for troubleshooting, improving performance, and ensuring security. Learn how to use them effectively for system health.
Anjali Udasi

git fetch vs pull: Key Differences Explained
Learn the key differences between git fetch and git pull, and understand when to use each command for better control over your workflow.
Anjali Udasi

Your Go-To Git Commands CheatSheet
Master Git with this cheat sheet! Learn essential and advanced commands to simplify your workflow and fix mistakes.
Prathamesh Sonpatki

An Easy Guide to OpenTelemetry Environment Variables
Get up and running with OpenTelemetry environment variables in no time. This guide helps you configure and optimize your observability setup easily.
Anjali Udasi

OpenTelemetry vs Jaeger: Which Should You Pick?
Compare OpenTelemetry and Jaeger to determine which tool best fits your observability needs for distributed systems and performance tracking.
Anjali Udasi

OpenTelemetry Collector with Docker: A Detailed Guide
Learn how to set up and run the OpenTelemetry Collector with Docker, complete with configuration tips and step-by-step instructions.
Faiz Shaikh

8 Leading Network Monitoring Tools for Enterprises
Explore 8 top network monitoring tools that help enterprises ensure performance, reliability, and security across their networks.
Anjali Udasi
OpenTelemetry vs. Prometheus: An Easy to Follow Comparison
OpenTelemetry vs. Prometheus - Difference in architecture, and metrics
Anjali Udasi

AWS OpenSearch: Setup, Performance Tips, and Practical Examples
Discover how to set up, optimize, and use Amazon OpenSearch Service with this comprehensive, step-by-step tutorial.
Anjali Udasi

SIEM Architecture: Key Components, Integrations, and More
Explore the key components, integrations, and best practices for building a resilient SIEM architecture to safeguard your organization’s security.
Anjali Udasi

OpenTelemetry Profiling: A Look into Performance Insights
OpenTelemetry profiling helps you explore app performance, pinpointing issues and improving efficiency for better, more reliable apps.
Prathamesh Sonpatki

Apdex Score 101: Definition, Calculation, and Limitations
Learn what the Apdex score is, how to calculate it, and its limitations. A quick guide to measuring user satisfaction effectively.
Anjali Udasi

Everything You Should Know About OpenTelemetry Collector Contrib
Discover how OpenTelemetry Collector Contrib enhances observability with flexible, scalable components for monitoring cloud-native systems.
Anjali Udasi

Getting Started with the OpenTelemetry Helm Chart in K8s
Learn how to deploy and configure the OpenTelemetry Helm Chart in Kubernetes for streamlined observability and easy monitoring setup.
Anjali Udasi

A Complete Guide to Threat Hunting: Tools and Techniques
Discover everything you need to know about threat hunting, including the best tools and techniques to keep your organization safe from cyber threats.
Anjali Udasi

How to Use the Laravel Scheduler for Task Management
Learn how to automate and manage your tasks efficiently with the Laravel Scheduler, making repetitive processes easier to handle in your app.
Anjali Udasi

Getting Started with Bun.js: A Quick Guide
Learn how to quickly get started with Bun.js, a fast and efficient JavaScript runtime, and optimize your development workflow.
Prathamesh Sonpatki

Serilog: Configuration, Error Handling & Best Practices
Learn how to configure Serilog, handle errors, and explore best practices for effective logging in your .NET applications.
Anjali Udasi

How to Build a Cloud Strategy That Works for Your Business
Learn to craft a cloud strategy tailored to your business—align goals, optimize resources, and embrace the cloud confidently.
Anjali Udasi

SLF4J vs Log4j: Key Differences and Choosing the Right One
SLF4J offers flexibility with multiple logging frameworks, while Log4j provides rich features for detailed, high-performance logging.
Preeti Dewani

Total Blocking Time (TBT): What It Is, Why It Matters, and How to Fix It
Learn what Total Blocking Time (TBT) is, why it matters, and how to optimize it for better website performance and user experience.
Anjali Udasi

Log Levels: Different Types and How to Use Them
Learn about log levels, their types, and how to use them effectively for troubleshooting, performance, and system monitoring.
Anjali Udasi

What is Single Pane of Glass Monitoring and How It Works
Single pane of glass monitoring provides a unified view of your system's data, making it easier to track performance and troubleshoot issues.
Anjali Udasi

Node.js Worker Threads Explained (Without the Headache)
Learn how Node.js worker threads can boost performance by offloading tasks to background threads—simple, efficient, and headache-free!
Prathamesh Sonpatki

Loki S3 Storage: A Guide for Efficient Log Management
Learn how to optimize Grafana Loki with S3 storage for scalable, cost-effective log management and improved performance.
Anjali Udasi

Java Application Monitoring: How It Works, Tools, and Best Practices
Learn how Java application monitoring works, explore essential tools and discover best practices to optimize performance and reliability.
Faiz Shaikh

Windows Server Monitoring: Tools, Best Practices & Strategies
Discover essential tools, best practices, and strategies for effective Windows server monitoring to ensure smooth performance and minimize downtime.
Anjali Udasi

pino-pretty: A Guide to Pretty-Printing Your Logs
Learn about pino-pretty and how it can transform raw JSON logs into a readable, human-friendly format for easier debugging.
Preeti Dewani

CloudWatch Metrics: Key Features, Working & Cost Management
Learn about CloudWatch Metrics, how they work, key features, and best practices for managing costs while monitoring your AWS resources efficiently.
Anjali Udasi

Cloudcraft: A Simple Tool for Cloud Architecture Design
Cloudcraft simplifies cloud architecture design with an easy-to-use interface, helping you visualize and plan your cloud infrastructure.
Anjali Udasi

7 Best DigitalOcean Alternatives for Developers in 2025
Discover the top 7 DigitalOcean alternatives for developers in 2025, offering scalability, advanced features, and cost-effective solutions.
Anjali Udasi

gRPC vs HTTP vs REST: Which is Right for Your Application?
Explore the key differences between gRPC, HTTP, and REST to choose the best protocol for your application's performance and scalability.
Anjali Udasi

How to Set Up and Manage Cron Jobs in Node.js: Step-by-Step Guide
Learn how to set up and manage cron jobs in Node.js with this step-by-step guide to automate tasks efficiently in your applications.
Faiz Shaikh

10 Steps to Fix Upstream Connect Errors
Learn quick fixes for upstream connect errors, including troubleshooting tips, monitoring tools, and configuration adjustments to resolve issues fast.
Prathamesh Sonpatki

Heroku Logs: Everything You Need to Know
Everything you need to know about using Heroku logs for monitoring, troubleshooting, and improving app performance.
Anjali Udasi

Docker vs Docker Swarm: Key Differences Explained
Docker is for managing containers, while Docker Swarm orchestrates multiple containers across nodes, ensuring scalability and high availability.
Anjali Udasi

Why Data Observability is Important for Your Business
Learn how data observability helps your business catch issues early, ensuring accurate insights, smarter decisions, and smoother growth.
Anjali Udasi

Top 7 Cloud Providers: The Best AWS Alternatives
Discover the top 7 AWS alternatives, comparing features, benefits, and what makes each one a strong cloud solution for your needs.
Anjali Udasi

Splunk vs. Datadog: A Side-by-Side Comparison
Compare Splunk and Datadog in this detailed guide to understand their features, strengths, and key differences for your monitoring needs.
Anjali Udasi

npm Commands Cheatsheet: List, Install, Update & Troubleshoot
Complete npm cheatsheet with commands for listing packages, installing dependencies, fixing errors, and managing versions. Copy-paste examples for npm list, npm outdated, npm update & more.
Preeti Dewani

What Unified Observability Means for Your System
Learn how unified observability helps you track system health, improve performance, and quickly resolve issues across your environment.
Anjali Udasi

Getting the Most Out of Windows Event Logs
Learn how to harness the power of Windows Event Logs for better troubleshooting, system monitoring, and security with this easy-to-follow guide.
Anjali Udasi

Observability Platform Migration: What You Need to Know
Ready to migrate your observability platform? Here’s what you need to know to make the process smooth and set your team up for success.
Anjali Udasi

Container Security: What It Is, Architecture, and Best Practices
Learn about container security, its architecture, and essential best practices to protect your apps in cloud-native environments.
Anjali Udasi

OpenSearch Serverless: How It Works & Key Comparisons
OpenSearch Serverless simplifies search and analytics with auto-scaling, cost efficiency, and easy management, ideal for large-scale applications.
Anjali Udasi

Log Tracing vs Logging: Understanding the Difference
Log tracing tracks requests across systems while logging captures events within a system. Both are essential for effective observability.
Anjali Udasi

Essential Guide to Log Rotation in Linux
Learn how to configure log rotation in Linux to keep your system stable, manage log files, and prevent disk space issues effectively.
Preeti Dewani
The Power of Sidecar Containers in Kubernetes Explained
Sidecar containers in Kubernetes simplify architecture by offloading tasks like logging and monitoring, improving scalability and efficiency.
Anjali Udasi

Spring Boot Logging: Best Practices for Faster Debugging
Master Spring Boot logging with Logback, async appenders, MDC context, and OpenTelemetry integration. Debug issues 10x faster with structured logs and proper log levels.
Prathamesh Sonpatki

What Makes Azure WAF Essential for Web Apps?
Discover why Azure WAF is crucial for securing web applications, with features like bot protection, DDoS defense, and customizable security rules.
Anjali Udasi

A Simple Guide to Understanding MongoDB Logs
Learn how to use MongoDB logs for better performance, troubleshooting, and optimization with this simple, step-by-step guide.
Prathamesh Sonpatki

How to Set Up and Manage Cron Jobs in Windows
Learn how to set up and manage cron jobs in Windows using Task Scheduler, PowerShell, and Command Prompt to automate tasks like backups and system maintenance.
Anjali Udasi

Application Logs: Key Components, Types, & Best Practices
Explore the essential components, types, and best practices for managing application logs to optimize troubleshooting, performance, and security.
Anjali Udasi

Parquet vs CSV: Which Format Should You Choose?
Parquet outperforms CSV with its columnar format, offering better compression, faster queries, and more efficient storage for large datasets.
Anjali Udasi

Monolithic vs. Microservices: The Great Architecture Debate
Explore the pros and cons of monolithic vs. microservices architectures to find the best fit for your project's needs and scalability.
Anjali Udasi

Python Errors Explained: 15+ Types with Examples & Fixes
Fix Python errors fast: SyntaxError, TypeError, NameError, ValueError, KeyError, IndexError & more. Each error explained with code examples, causes, and copy-paste solutions.
Preeti Dewani

Understanding Logrus: The Ultimate Go Logger for Efficient Logging
Logrus is a powerful, flexible Go logger that simplifies logging, offering various log levels, thread safety, and easy integration with external systems.
Anjali Udasi

Cloud Tracing in Distributed Systems: Gaining Visibility
Cloud tracing provides essential visibility into distributed systems, helping track requests, identify bottlenecks, and improve performance. Learn the best practices and tools for effective monitoring.
Anjali Udasi

AWS WAF Guide: Setup, Best Practices & Configuration
Protect your apps with AWS WAF! This guide walks you through setup, rules, and keeping threats at bay, step by simple step.
Anjali Udasi

Production Winston Logging: From Basic Setup to Enterprise Scale
Learn how to integrate Winston for efficient logging in Node.js. Explore features, configurations, and best practices to optimize your app's performance.
Anjali Udasi

Kafka Observability: Key to Managing Distributed Systems
Effective Kafka observability is crucial for tracking performance, ensuring reliability, and troubleshooting issues in complex, distributed systems.
Preeti Dewani

eBPF for Enhanced Observability in Modern Systems
eBPF enhances observability by providing deep insights into system performance and security with minimal overhead, ideal for modern, distributed systems.
Anjali Udasi

Optimizing Systems with the Observability Maturity Model
The Observability Maturity Model helps organizations optimize systems by advancing through stages to improve reliability, performance, and troubleshooting.
Anjali Udasi

How to Set Up OpenTelemetry in Django
Learn how to integrate OpenTelemetry with Django to monitor performance, trace requests, and improve observability in your applications.
Prathamesh Sonpatki

Application Monitoring Best Practices: A Comprehensive Guide
Ensure your app's reliability with best practices in monitoring: choose key metrics, configure alerts, and stay proactive for optimal performance.
Anjali Udasi

Implementing OpenTelemetry in Ruby: A Guide for Developers
Learn how to integrate OpenTelemetry into your Ruby applications for better observability, performance insights, and debugging.
Aditya Godbole

Implement Distributed Tracing with OpenTelemetry
Implementing distributed tracing with OpenTelemetry helps track requests across services, providing insights into performance and pinpointing issues.
Prathamesh Sonpatki

The Essentials of SNMP Monitoring in Networks
SNMP monitoring is crucial for tracking network device performance, helping optimize and secure your network with real-time insights.
Anjali Udasi

Integrating OpenTelemetry with Elixir: A Step-by-Step Guide
Learn how to integrate OpenTelemetry with Elixir to monitor and troubleshoot your applications with traces, metrics, and logs.
Aditya Godbole

The Basics of Network Device Monitoring Explained
Network device monitoring tracks the performance and health of your network's devices, helping detect issues early, optimize performance, and ensure security.
Anjali Udasi

The Role of OpenTelemetry Events in Improving Observability
Learn how OpenTelemetry events enhance observability by providing detailed insights into application performance and system behavior.
Preeti Dewani

OpenTelemetry Context Propagation for Better Tracing
Learn how OpenTelemetry's context propagation improves tracing by ensuring accurate, end-to-end visibility across distributed systems.
Preeti Dewani

gRPC with OpenTelemetry: Observability Guide for Microservices
Learn how to integrate gRPC with OpenTelemetry for better observability, performance, and reliability in microservices architectures.
Prathamesh Sonpatki

Why You Need Server Monitoring Tools and How to Choose
Discover the importance of server monitoring tools and how to choose the best one to optimize performance, prevent downtime, and ensure security.
Anjali Udasi

OpenTelemetry with Flask: A Comprehensive Guide for Web Apps
Learn how to integrate OpenTelemetry with Flask to monitor and trace your web app’s performance with easy-to-follow setup and troubleshooting tips.
Sahil Khan

Top 5 Firebase Alternatives for 2024: Best Picks
Explore the top 5 Firebase alternatives for 2024, offering flexibility, scalability, and ease of use to meet your app development needs.
Anjali Udasi

Kafka with OpenTelemetry: Distributed Tracing Guide
Learn how to integrate Kafka with OpenTelemetry for enhanced distributed tracing, better performance monitoring, and effortless troubleshooting.
Prathamesh Sonpatki

Why Cloud Security Monitoring is Crucial for Your Business
Cloud security monitoring is essential to protect data, ensure compliance, and safeguard against growing cyber threats in cloud environments.
Anjali Udasi

Linux Syslog Explained: Configuration and Tips
Learn how to configure and manage Linux Syslog for better system monitoring, troubleshooting, and log management with these helpful tips.
Faiz Shaikh

A Complete Guide to Integrating OpenTelemetry with FastAPI
Learn how to integrate OpenTelemetry with FastAPI for enhanced observability, including automatic instrumentation, environment variables, and custom exporters.
Preeti Dewani

The Best Heroku Alternatives for Developers in 2024
Discover the top Heroku alternatives in 2024 with options for scalability, pricing, and flexibility to suit your development needs.
Anjali Udasi

The Best Linux Monitoring Tools for 2024
Discover the top Linux monitoring tools for 2024 to optimize performance, prevent downtime, and keep your systems running smoothly.
Anjali Udasi

Instrumenting AWS Lambda Functions with OpenTelemetry
Learn how to instrument AWS Lambda functions with OpenTelemetry to gain valuable insights and improve the performance of your serverless apps.
Aditya Godbole

DNS Monitoring: Everything You Need to Know
DNS monitoring ensures your domain records are accurate, secure, and performing well, helping prevent outages and attacks.
Anjali Udasi

Introduction to OpenTelemetry Express for Node.js Applications
OpenTelemetry Express simplifies trace collection for Node.js apps, helping you monitor performance and diagnose issues across distributed systems.
Prathamesh Sonpatki

Getting Started with OpenTelemetry Logging: A Practical Guide
Learn how to get started with OpenTelemetry Logging, streamline your observability, and enhance debugging with structured, context-rich logs.
Prathamesh Sonpatki

Kubernetes vs Docker Swarm: Which to Choose for Containers?
Choosing between Kubernetes and Docker Swarm depends on your project's scale, complexity, and specific container orchestration needs.
Anjali Udasi

Grafana Variables: Dynamic Dashboards Done Right
Use Grafana variables to create dynamic, interactive dashboards that fit your data, making monitoring easier and more precise!
Anjali Udasi

Docker Compose Logs: An In-Depth Guide for Developers
Master Docker Compose logs with our in-depth guide. Learn log commands, tips for effective management, and troubleshooting multi-container apps!
Anjali Udasi

Python Logging with Structlog: A Comprehensive Guide
Master Python logging with structlog! Learn how structured logs improve debugging, observability, and performance in your apps.
Preeti Dewani

systemctl logs: A Guide to Managing Logs in Linux
Learn how to manage and view systemctl logs in Linux with this guide, covering essential commands and best practices for troubleshooting.
Faiz Shaikh

Kubernetes Alternatives: Top Options to Explore in 2024
Explore the best Kubernetes alternatives for 2024, from Docker Swarm to AWS ECS, and find the perfect fit for your container orchestration needs.
Anjali Udasi

A Guide to Database Optimization for High Traffic
Learn how to optimize your database for high traffic, ensuring performance, scalability, and reliability under heavy load.
Prathamesh Sonpatki
AWS re:Invent 2024 Day 4 Recap
Day 4 at AWS re:Invent 2024 was filled with fresh insights, community discussions, and impactful announcements. Catch all the updates here!
Prathamesh Sonpatki

Datadog vs Dynatrace: A Comprehensive Comparison
Compare Datadog and Dynatrace to find the right observability solution for your team, balancing flexibility, scalability, and automation.
Anjali Udasi

Grafana and Docker: A Simple Way to Monitor Everything
Grafana and Docker make monitoring effortless with easy deployment, scalability, and isolation, helping you track data efficiently in any environment.
Anjali Udasi

AWS re:Invent 2024 Day 3 Recap
Catch up on the highlights from AWS re:Invent 2024 Day 3, packed with fresh innovations, key announcements, and takeaways you won't want to miss!
Prathamesh Sonpatki

Top 10 Docker Alternatives: Cost, Performance & Use Cases
Explore the top 10 Docker alternatives, comparing cost, performance, and use cases to find the best solution for your containerization needs.
Anjali Udasi

LLM Observability: Architecture, Key Components, and Common Challenges
LLM observability is key to ensuring model performance. Learn its importance, best practices, and actionable steps for optimal results and reliability.
Anjali Udasi
AWS re:Invent 2024 Day 2 Recap
Catch up on the highlights from AWS re:Invent 2024 Day 2, featuring key insights, exciting announcements, and key takeaways.
Prathamesh Sonpatki
MongoDB vs Elasticsearch: Key Differences Explained
Learn the key differences between MongoDB and Elasticsearch, and understand when to use each for your database and search needs.
Anjali Udasi

API Monitoring: A Comprehensive Guide for Developers
Learn how to keep your APIs running smoothly! From tracking performance to boosting reliability, this guide has everything developers need.
Anjali Udasi

AWS re:Invent 2024 Day 1 Recap
AWS re:Invent Day 1 brought insightful talks, cool connections, and updates on AI, observability, and scaling challenges.
Prathamesh Sonpatki

A Beginner's Guide to GCP Monitoring
Learn how to monitor and optimize your GCP resources effortlessly. Simplify performance tracking and keep your services running smoothly.
Prathamesh Sonpatki
Anjali Udasi

How AWS Step Functions Work for Serverless Apps
AWS Step Functions coordinate serverless workflows, integrating AWS services with visual state machines for scalable, resilient applications.
Anjali Udasi

Fluentd vs Fluent Bit – A Comprehensive Overview
Fluentd vs Fluent Bit: Discover the key differences, use cases, and how to choose the right tool for your log processing needs.
Prathamesh Sonpatki
Anjali Udasi

Top 5 Open Source SIEM Tools for Security Monitoring
Explore open-source SIEM tools to enhance your security monitoring. Learn about features, deployment, and how they compare to commercial solutions.
Anjali Udasi

Enhancing Observability with Fluent Bit and OpenTelemetry
Boost observability with Fluent Bit and OpenTelemetry! Collect, process, and export logs and metrics easily for smarter monitoring.
Prathamesh Sonpatki

Kubernetes CPU Throttling: What It Is and How to Avoid It
Kubernetes CPU throttling can slow down your apps. Learn what it is, why it happens, and how to avoid it for better performance.
Anjali Udasi

Full-Stack Observability for Better Application Performance
Achieve better application performance with full-stack observability, gaining real-time insights to troubleshoot, optimize, and enhance user experience.
Anjali Udasi

A Complete Guide to Using the Grok Debugger
Learn how to use the Grok Debugger effectively for log parsing, with practical tips, debugging techniques, and pattern optimization.
Preeti Dewani

Filebeat vs Logstash: Key Differences for Your Logging Needs
Explore the key differences between Filebeat and Logstash to choose the right tool for your logging setup and optimize performance.
Anjali Udasi

A Complete Guide to Kubernetes Observability
Learn how to implement effective Kubernetes observability with metrics, logs, and traces to monitor and optimize your clusters at scale.
Prathamesh Sonpatki
Kibana vs Grafana: Key Differences and Use Cases
Kibana and Grafana offer unique strengths: Kibana excels in log analysis, while Grafana shines in time-series data and infrastructure monitoring.
Anjali Udasi

Debug Failed Cron Jobs: Complete Guide to Crontab Logs
Crontab logs help you keep your cron jobs in check. Learn how to track, debug, and optimize your cron jobs with crontab logs.
Anjali Udasi

The Parquet Files: Why This File Format Is Your Data's Best Friend
Discover the essentials of Parquet files in this fun, easy-to-follow guide to columnar storage, data compression, and efficient analytics.
Preeti Dewani

Django Logging: Everything You Need to Know
Learn the essentials of Django logging, from setup to advanced configurations, and improve your debugging and monitoring skills.
Preeti Dewani

Morgan npm and Its Role in Node.js
Morgan npm simplifies HTTP request logging in Node.js, making it easier to monitor and debug your applications with customizable formats.
Gabriel Diaz

Extracting Account-Level CDN Metrics from Akamai Logs with Last9
Learn how to extract and analyze account-level CDN metrics from Akamai logs using Last9 for real-time insights and better customer tracking.
Prathamesh Sonpatki
Aditya Godbole
AWS re: Invent 2024: Must-Know Tips & What to Expect
Ready for AWS re:Invent 2024? Here are some tips and highlights to help you make the most of the event
Prathamesh Sonpatki
Anjali Udasi

Logging Errors in Go with ZeroLog: A Simple Guide
Learn how to log errors efficiently in Go using ZeroLog with best practices like structured logging, context-rich messages, and error-level filtering.
Prathamesh Sonpatki

Your Guide to the 7 Best Tracing Tools in Observability
Discover the top tracing tools in observability to monitor, analyze, and troubleshoot your systems for better performance and reliability.
Anjali Udasi

Proactive Monitoring: What It Is, Why It Matters, & Use Cases
Proactive monitoring helps IT teams spot issues early, ensuring smooth operations, minimal disruptions, and a better user experience.
Anjali Udasi

Docker Logs Tail: A Developer's Guide
Demystifying Docker logs: From basic tail commands to advanced log management, learn how to debug and monitor containers in production.
Anjali Udasi

Prometheus Metrics Types - A Deep Dive
A deep dive on different metric types in Prometheus and best practices
Tripad Mishra

AWS Monitoring Tools to Optimize Cloud Performance
Learn how AWS monitoring tools like CloudWatch, X-Ray, and others can help boost your cloud performance and make everything run smoothly.
Anjali Udasi
OpenSearch vs. Elasticsearch: What’s the Real Difference?
OpenSearch and Elasticsearch are both powerful search engines, but OpenSearch offers an open-source alternative with community-driven development.
Anjali Udasi

Kubernetes Observability with OpenTelemetry Operator
Learn how the OpenTelemetry Operator makes monitoring Kubernetes easier, so you can focus on what matters—keeping your apps running smoothly!
Prathamesh Sonpatki

Why Golden Signals Matter for Monitoring
Golden Signals—latency, traffic, error rate, and saturation—help SRE teams monitor system health and avoid costly performance issues.
Anjali Udasi

KubeCon NA 2024 Day 4 Recap
KubeCon NA 2024 Day 4 Recap: Insights, key talks, and lessons learned as the conference wraps up—looking forward to what’s next!
Prathamesh Sonpatki

KubeCon NA 2024 Day 3 Recap
Day 3 at KubeCon NA 2024 was full of engaging discussions on platform engineering, FinOps, and the future of cloud-native.
Prathamesh Sonpatki

The Practical Guide to Alert Sanity: From Chaos to Calm
Your pager just went off. Is it the CPU again? Memory? Disk space? Wrong question. Ask: Can users do their thing? That's your real alert.
Aditya Godbole

Getting Started with OpenTelemetry in Rust
Learn how to implement OpenTelemetry in Rust for effective observability, including tracing, metrics, and debugging in your applications.
Prathamesh Sonpatki

KubeCon NA 2024 Day 2 Recap
KubeCon NA 2024 Day 2 was packed with insights! Check out the highlights and key moments from another exciting day at the event.
Prathamesh Sonpatki
KubeCon NA 2024 Day 1 Recap: Observability Day & More
Day 1 of KubeCon NA 2024 was packed with insights, especially from Observability Day. Check out the highlights and talks that stood out!
Prathamesh Sonpatki
AWS CloudTrail Guide: Uses, Events, and Setup Explained
Learn how AWS CloudTrail tracks user activity, logs events, and helps with compliance. Get insights on setup and best practices.
Anjali Udasi

What is ELK: Core Components, Ecosystem & Setup Guide
Learn about the ELK Stack’s core components, extended ecosystem, and setup guide for efficient log management and data analysis.
Anjali Udasi

Last9’s Single Pane for High Cardinality Observability
Last9’s Telemetry Warehouse now supports Logs and Traces, offering a unified view for high cardinality observability to simplify monitoring and troubleshooting.
Sahil Khan

How Structured Logging Makes Troubleshooting Easier
Structured logging organizes log data into a consistent format, making it easier to search and analyze. This helps teams troubleshoot issues faster and improve system reliability.
Anjali Udasi

Flask Logging Made Simple for Developers
Learn how to implement proper logging in Flask, from development to production, and avoid the pitfalls of scattered print statements.
Prathamesh Sonpatki

Understanding Docker Logs: A Quick Guide for Developers
Learn how to access and use Docker logs to monitor, troubleshoot, and improve your containerized apps in this simple guide for developers.
Gabriel Diaz

Must-Attend Talks and Activities at KubeCon 2024
Check out the must-attend talks and activities at KubeCon 2024 in Salt Lake City. It’s the perfect mix of learning, networking, and fun!
Anjali Udasi

Prometheus Pushgateway: How to Track Short-Lived Jobs
Learn how to use Prometheus Pushgateway to track metrics from short-lived jobs and ensure reliable monitoring for all your processes.
Anjali Udasi

Kubernetes Microservices: Key Concepts Explained
Learn the basics of Kubernetes microservices, including architecture and deployment tips to improve your cloud-native apps!
Anjali Udasi

SRECon EMEA 2024 - Day 3
Here’s a snapshot of the key talks, important ideas, and memorable moments that set the stage for SRECon EMEA Dublin 2024!
Prathamesh Sonpatki

SRECon EMEA 2024 - Day 2
Here’s a quick recap of the standout talks, key insights, and unforgettable moments that got things rolling at SRECon EMEA Dublin 2024!
Prathamesh Sonpatki

The Only Kubectl Cheat Sheet You'll Ever Need
Here’s your go-to kubectl commands cheat sheet! Jump into Kubernetes management with these handy commands and make your life easier.
Anjali Udasi

SRECon EMEA 2024 - Day 1
Here’s a quick rundown of the standout talks, big ideas, and memorable moments that kicked things off in SRECon EMEA Dublin 2024!
Prathamesh Sonpatki

Scaling Prometheus: Tips, Tricks, and Proven Strategies
Learn how to scale Prometheus with practical tips and strategies to keep your monitoring smooth and efficient, even as your needs grow!
Prathamesh Sonpatki
Datadog vs. Grafana: Finding Your Ideal Monitoring Tool
Discover the key differences between Datadog and Grafana to find the ideal monitoring tool that fits your needs and budget.
Anjali Udasi

Getting Started with Host Metrics Using OpenTelemetry
Learn to monitor host metrics with OpenTelemetry. Discover setup tips, common pitfalls, and best practices for effective observability.
Prathamesh Sonpatki

Prometheus Alertmanager: What You Need to Know
Explore how Prometheus Alertmanager simplifies alert handling, reducing fatigue by smartly grouping and routing notifications for your team.
Anjali Udasi

Understanding Kubernetes Metrics Server: Your Go-to Guide
Learn how the Kubernetes Metrics Server helps monitor resource usage like CPU and memory, ensuring smooth cluster performance and scalability.
Anjali Udasi

How to Cut Down Amazon CloudWatch Costs
Check out these straightforward tips to manage your metrics and logs better. You can keep your monitoring effective while cutting down on costs!
Anjali Udasi

Prometheus RemoteWrite Exporter: A Comprehensive Guide
A comprehensive guide showing how to use PrometheusRemoteWriteExporter to send metrics from OpenTelemetry to Prometheus compatible backends
Prathamesh Sonpatki

Log Analytics 101: Everything You Need to Know
Get a clear understanding of log analytics—what it is, why it matters, and how it helps you keep your systems running efficiently by analyzing key data from your infrastructure.
Prathamesh Sonpatki
Anjali Udasi

The Developer’s Handbook to Centralized Logging
This guide walks you through the implementation process, from defining requirements to choosing the right tools, setting up log storage, and configuring visualization dashboards.
Prathamesh Sonpatki
Anjali Udasi

kubectl exec: Run Commands in Pods with Examples
kubectl exec into running pods to debug, run shell commands, and troubleshoot containers. Copy-paste examples for exec -it, multi-container pods, and common debugging workflows.
Anjali Udasi

Log Anything vs Log Everything
Explore the logging spectrum from "Log Anything" chaos to "Log Everything" clarity. Learn structured logging best practices in Go with zap!
Prathamesh Sonpatki

OTEL Collector Monitoring: Best Practices & Guide
Learn how to effectively monitor the OTEL Collector with best practices and implementation strategies for improved system performance.
Anjali Udasi

The Ultimate Guide to Application Performance Monitoring (APM)
Learn everything about Application Performance Monitoring (APM), from its definition to its crucial role in optimizing application performance.
Anjali Udasi

Docker Monitoring with Prometheus: A Step-by-Step Guide
This guide walks you through setting up Docker monitoring using Prometheus and Grafana, helping you track container performance and resource usage with ease.
Prathamesh Sonpatki
Anjali Udasi

9 Datadog Alternatives Worth Considering in 2026
Explore eight options for different monitoring needs and budgets. Whether for microservices or APM, these alternatives enhance observability affordably.
Anjali Udasi

High Availability in Prometheus: Best Practices and Tips
This blog defines high availability in Prometheus, discusses challenges, and offers essential tips for reliable monitoring in cloud-native environments.
Anjali Udasi

Synthetic Monitoring Explained: A Developer's Guide
Synthetic monitoring empowers developers to stay ahead of potential problems by simulating real user actions. This guide breaks down how it works, its benefits, and how you can use it to keep your web applications and APIs performing at their best.
Anjali Udasi

What are OpenTelemetry Metrics? A Comprehensive Guide
Learn about OpenTelemetry Metrics, types of instruments, and best practices for effective application performance monitoring and observability.
Anjali Udasi

How to Monitor Ephemeral Storage Metrics in Kubernetes
Explore practical methods for monitoring ephemeral storage metrics in Kubernetes to ensure efficient resource management and improve overall performance.
Anjali Udasi

Prometheus Recording Rules: Developer Guide to Optimization
This guide breaks down how recording rules can help, with simple tips to improve performance and manage complex data.
Prathamesh Sonpatki

Tail Latency: Key in Large-Scale Distributed Systems
Tail latency significantly impacts large-scale systems. This blog covers its importance, contributing factors, and effective reduction strategies.
Anjali Udasi

Prometheus Rate Function: A Practical Guide to Using It
In this guide, we’ll walk you through the Prometheus rate function. You’ll discover how to analyze changes over time and use that information to enhance your monitoring strategy.
Anjali Udasi

Adding Cluster Labels to Kubernetes Metrics
A definitive guide on adding cluster label to all Kubernetes metrics
Prathamesh Sonpatki

How to Use Jaeger with OpenTelemetry
This guide shows you how to easily use Jaeger with OpenTelemetry for improved tracing and application monitoring.
Anjali Udasi
Prometheus Alternatives: Monitoring Tools You Should Know
What are the alternatives to Prometheus? A guide to comparing different Prometheus Alternatives.
Gabriel Diaz

Optimizing Prometheus Remote Write Performance: Guide
Master Prometheus remote write optimization. Learn queue tuning, cardinality management, and relabeling strategies to scale your monitoring infrastructure efficiently.
Gabriel Diaz

Identify Root Spans in Otel Collector
How to identify root spans in OpenTelemetry Collector using filter and transform processors
Prathamesh Sonpatki

What is Prometheus Remote Write
Explore Prometheus Remote Write: scale your monitoring effortlessly. Learn how it works, its benefits, and top tips for cloud-native setups.
Prathamesh Sonpatki

Golang Logging: A Comprehensive Guide for Developers
Our blog covers practical insights into Golang logging, including how to use the log package, popular third-party libraries, and tips for structured logging
Prathamesh Sonpatki
Preeti Dewani

Developer's Guide to Installing OpenTelemetry Collector
Learn how to install and configure the OpenTelemetry Collector for enhanced observability. This guide covers Docker, Kubernetes, and Linux installations with step-by-step instructions and configuration examples.
Prathamesh Sonpatki

Top 10 Platform Engineering Tools in 2024
Check out these 10 tools that are making a real difference in how teams build, manage, and scale their platforms in 2024.
Prathamesh Sonpatki

PromCon 2024 — Day 2
Catch up on Day 2 of PromCon 2024. Read about the key talks and takeaways from the second day of this exciting event.
Prathamesh Sonpatki
Prometheus Operator Guide
What is Prometheus Operator, how it can be used to deploy Prometheus Stack in Kubernetes environment
Anjali Udasi
PromCon 2024 — Day 1
Get a quick overview of Day 1 at PromCon 2024, which featured significant announcements on Prometheus 3.0 and OpenTelemetry compatibility
Prathamesh Sonpatki

PromQL Cheat Sheet: Must-Know PromQL Queries
This cheat sheet provides practical guidance for diagnosing issues and understanding trends.
Prathamesh Sonpatki
Anjali Udasi

Streaming Aggregation: Real-Time Data Processing in 2024
We break down the essentials of streaming aggregation and its impact on modern data processing.
Anjali Udasi
OpenTelemetry Protocol (OTLP): A Deep Dive into Observability
Learn about OTLP’s key features, and how it simplifies telemetry data handling, and get practical tips for implementation.
Gabriel Diaz
Microservices Monitoring with the RED Method
This blog introduces the RED method—an approach that simplifies microservices monitoring by honing in on requests, errors, and latency.
Prathamesh Sonpatki

kube-state-metrics: Your Guide to Kubernetes Observability
This guide provides an in-depth look at its setup and usage, helping you monitor and manage your Kubernetes clusters more efficiently.
Prathamesh Sonpatki
Anjali Udasi
Instrumenting fasthttp with OpenTelemetry: A Complete Guide
We cover everything from initial setup to practical tips for monitoring and improving your fasthttp applications. Follow along to enhance your observability and get a clearer view of your app’s performance.
Tushar Choudhari

PromQL: A Developer's Guide to Prometheus Query Language
Our developer’s guide breaks down Prometheus Query Language in an easy-to-understand way, helping you monitor and analyze your metrics like a pro.
Gabriel Diaz

PromQL for Beginners: Getting Started with Prometheus
New to Prometheus? My PromQL beginner's guide teaches you how to write queries, understand data types, and use key functions.
Gabriel Diaz

Hot Reload for OpenTelemetry Collector: Step-by-Step Guide
Learn to enable hot reload for the OpenTelemetry Collector to update configurations on the fly, improving your observability system's agility.
Prathamesh Sonpatki

OpenTelemetry Filelog Receiver: Collecting Kubernetes Logs
Learn to configure, optimize, and troubleshoot log collection from various sources including syslog and application logs. Discover advanced parser operator techniques for robust observability.
Prathamesh Sonpatki

What is Prometheus
What is Prometheus, how to use it and challenges of scaling Prometheus
Gabriel Diaz

Python Logging: The Complete Guide with Best Practices
Stop printing debug statements. Learn Python logging with proper log levels, formatters, handlers, and file rotation. Includes structlog, JSON logging, and production-ready patterns.
Anjali Udasi

2024's Best Cloud Monitoring Tools: Updated Insights
Get a detailed look at the top cloud monitoring tools of 2024. Compare leading solutions to understand their features and performance, helping you choose the best fit for your cloud infrastructure.
Anjali Udasi

Top Observability Best Practices for Microservices in 2024
Practical tips for monitoring, analyzing, and improving system performance.
Anjali Udasi

7 Splunk Alternatives Worth Checking Out in 2025
Explore Splunk alternatives like ELK, Last9, Graylog, and Datadog. Compare features, pricing, and scalability for log management and observability.
Prathamesh Sonpatki

A Deep Dive into Log Aggregation Tools
The guide discusses the essential components, challenges, popular tools, and advanced techniques that define effective log aggregation.
Anjali Udasi

How to Get Application Logs from a Kubernetes Pod
Learn how to effectively use kubectl logs to view and analyze Kubernetes pod logs. Master advanced techniques, troubleshoot issues, and optimize your K8s deployments.
Anjali Udasi

OpenTelemetry vs. Traditional APM Tools
This article explores OpenTelemetry vs. traditional APM tools, comparing their strengths, weaknesses, and use cases to help you choose wisely.
Anjali Udasi

The Anatomy of a Modern Observability System
This article breaks down the fundamentals, from data collection to analysis, to help you gain deeper insights into your applications.
Anjali Udasi

Redacting Sensitive Data in OpenTelemetry Collector
This guide covers types of data that can be redacted and step-by-step instructions for configuring the Attribute Processor.
Anjali Udasi

Advanced OpenTelemetry: Sampling, Filtering, and Enrichment
OpenTelemetry offers powerful data collection, but maximizing its efficiency requires careful configuration. This article explores advanced techniques for sampling filtering, and data enrichment.
Anjali Udasi

Observability vs. Telemetry vs. Monitoring
Observability is the continuous analysis of operational data, telemetry is the operational data that feeds into that analysis, and monitoring is like a radar for your system observing everything about your system and alerting when necessary.
Anjali Udasi
Convert OpenTelemetry Traces to Metrics with SpanMetrics
Already implemented tracing but lack metrics? With SpanConnector, you can convert trace data into actionable metrics. Here’s how to configure it.
Prathamesh Sonpatki

Think Data Warehouse, NOT Database.
The software monitoring world is broken because of a TSDB. We deserve a TSDW
Aniket Rao

What is the OpenTelemetry Collector and How Does It Work?
The OpenTelemetry Collector simplifies data collection, processing, and export for metrics, logs, and traces. Learn about its architecture, deployment, and examples.
Prathamesh Sonpatki

Whitespace in OTLP headers and OpenTelemetry Python SDK
How to handle whitespaces in the OTLP Headers with Python Otel SDK
Prathamesh Sonpatki

The most important aspect of software monitoring
Ths single most important thing to get better at your software monitoring journey
Aniket Rao

Prometheus Toolkit: Your Essential Companion for Monitoring
Building a standardized open-source resource across instrumentation, query, and alerting pipelines to start your monitoring journey with Prometheus.
Sahil Khan

Building Monitoring with Auto-Discovery for 70+ Microservices
The promise of a managed SaaS partner — Reducing monitoring costs at all costs
Preeti Dewani

What needs to change in software monitoring?
A wishlist of things that need to change in the world of software monitoring
Aniket Rao
How We Cut Monitoring Costs and Deprecated Thanos at Replit
Winning Replit over by taming High Cardinality data and deprecating Thanos
Prathamesh Sonpatki

Back to the Future: The R-C-A of alerting
Dissecting the RCA of Alerting - Reliability, Correlations, Actionability
Aditya Godbole
Launching Alert Studio
Modern monitoring systems depend heavily on ‘Alerting’ to reduce the Mean Time to Detect (MTTD) faulty systems. But, alerting hasn’t evolved to meet the demands of modern architectures. We’re changing that with Alert Studio.
Aditya Godbole

Everything in software monitoring is dead, apparently
Chasing shiny new toys, as always ;)
Aniket Rao

Software Monitoring — Stuck in the 00s
A short history of software monitoring, from the 00s. What has changed? Why are things so arcane?
Piyush Verma
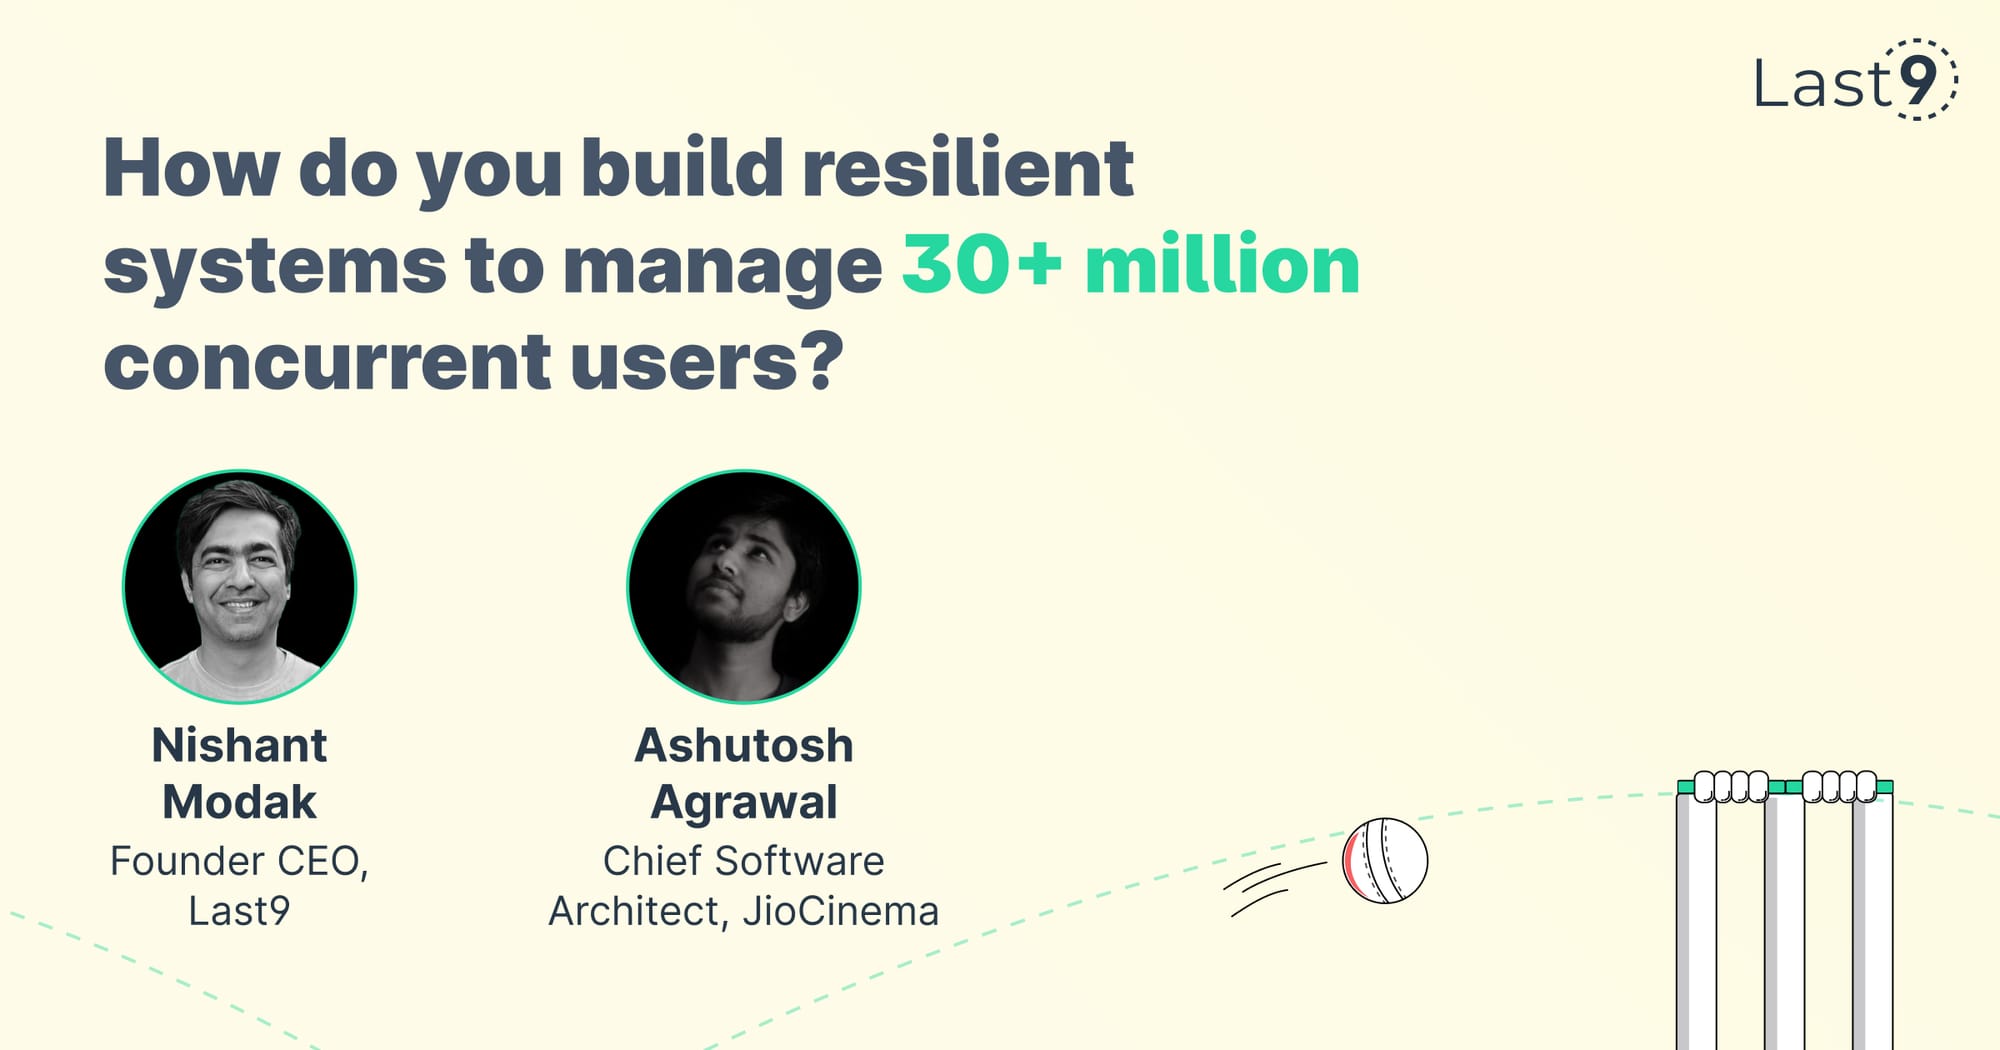
Cricket Scale e01 — Ashutosh Agrawal
Unpacking "Cricket Scale" with the person behind the scenes at JioCinema
Prathamesh Sonpatki

A checklist to choose a monitoring system
A detailed checklist of points you should consider before choosing a monitoring system
Prathamesh Sonpatki

Controlling Kubernetes Costs with OpenCost and Last9
Setting up OpenCost with Last9 to monitor the cost of Kubernetes clusters
Aniket Rao
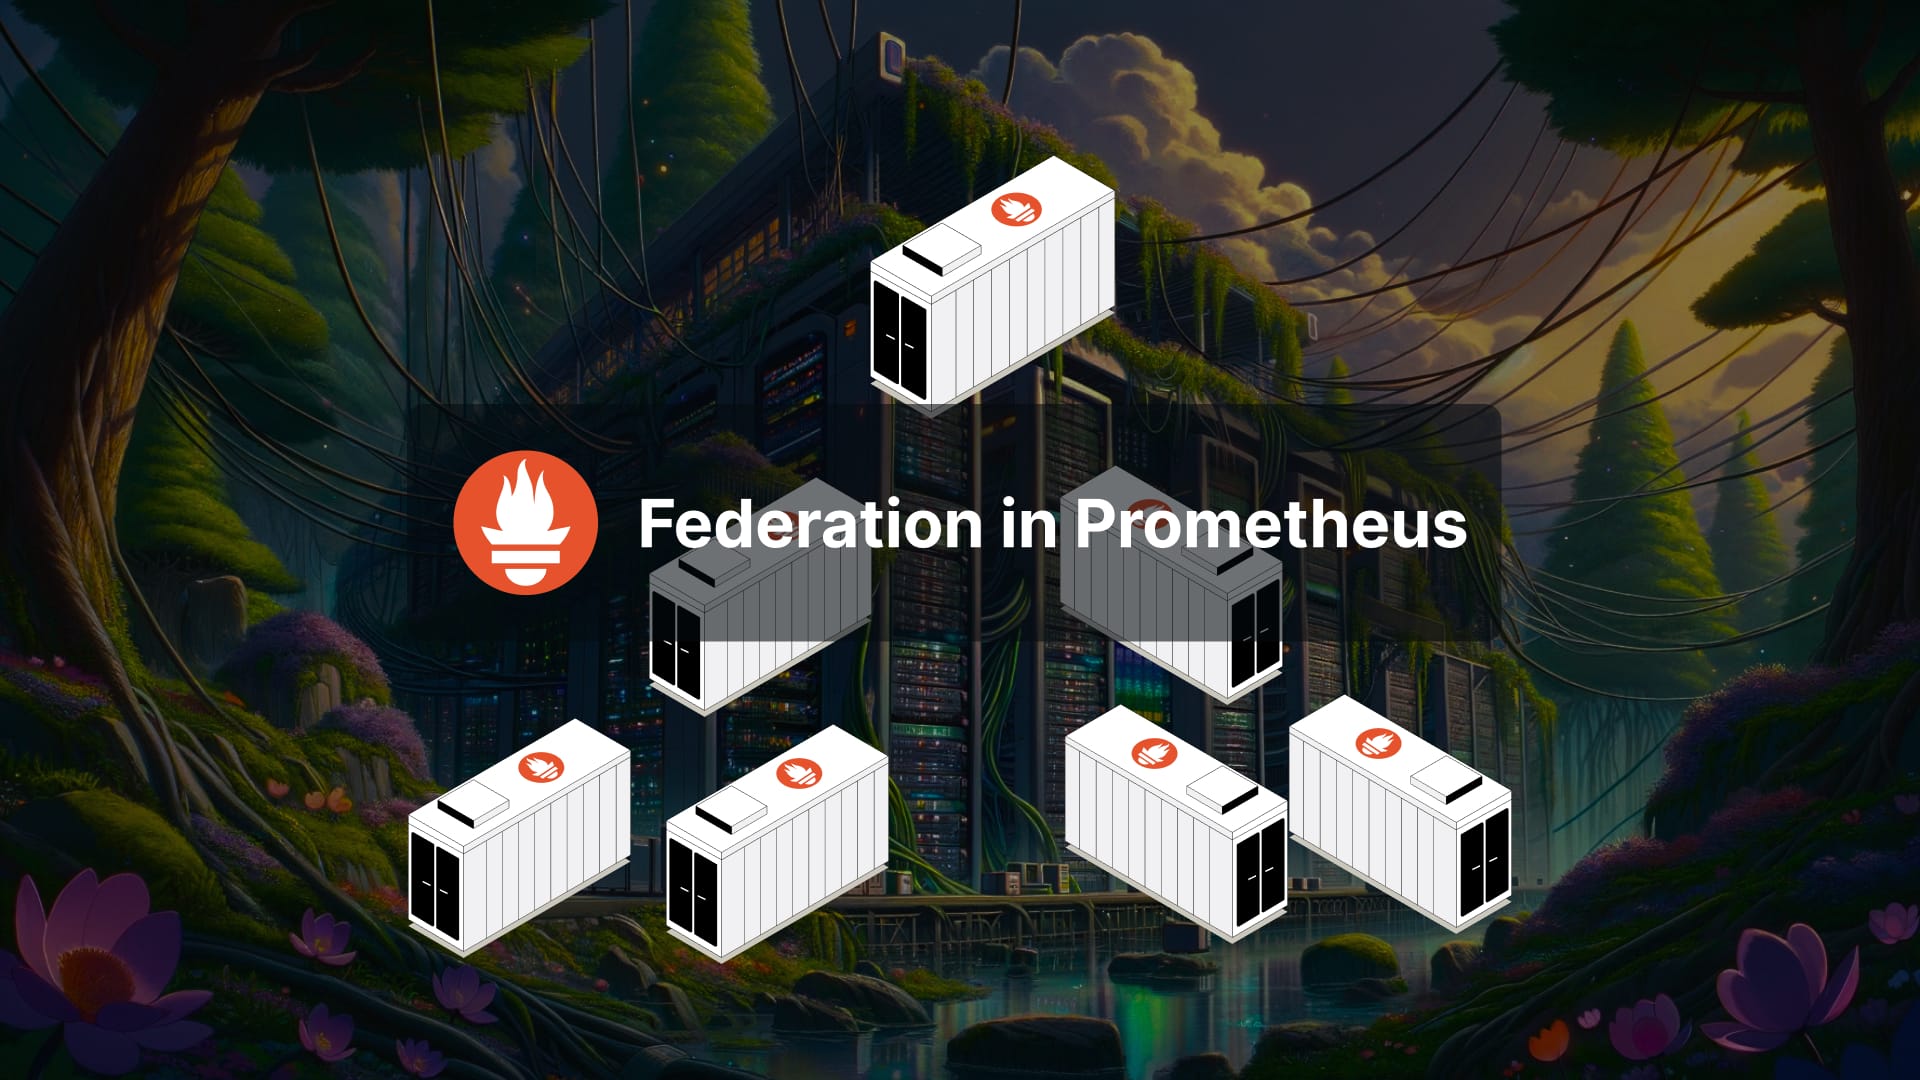
Prometheus Federation ⏤ Scaling Prometheus Guide
We discuss the nuances of Federation in Prometheus, address Prometheus Scaling Challenges along with alternatives to Prometheus federation
Tripad Mishra

Why your monitoring costs are high
If you want to bring down your monitoring costs, you need to shake up a decision paralysis in engineering
Aniket Rao

The unresolved cost of High Cardinality
Fulfill all your food delivery orders this December 31st by taming High Cardinality data with Last9 😉
Prathamesh Sonpatki

Monitor Cloudflare Workers using Prometheus Exporter
Complete guide to monitor Cloudflare workers using Prometheus Exporter
Aniket Rao

Why you need a Time Series Data Warehouse
What is a Time Series Data Warehouse? How does it help in your monitoring journey? How does it differ from a Time Series Database? That and more
Rishi Agrawal

Instrumenting Java Apps with OpenTelemetry: Guide & Tips
A comprehensive guide to instrument Java applications using OpenTelemetry libraries
Last9

Instrumenting Golang Apps with OpenTelemetry
A comprehensive guide to instrument Golang applications using OpenTelemetry libraries for metrics and traces.
Last9

Building Logs to Metrics pipelines with Vector
How to build a pipeline to convert logs to metrics and ship them to long term Prometheus storage like Last9.
Aniket Rao

SaaS Monitoring with Levitate
How Levitate solves today's challenges of B2B SaaS monitoring, including noisy neighbors by unlocking per-tenant observability
Prathamesh Sonpatki

Troubleshooting Common Prometheus Issues: Cardinality & More
Common Prometheus pitfalls and ways to handle them
Last9

OpenTelemetry vs. OpenCensus
What are OpenTelemetry, and OpenCensus and how to migrate from OpenCensus to OpenTelemetry
Last9

Downsampling & Aggregating Metrics in Prometheus
A comprehensive guide to downsampling metrics data in Prometheus with alternate robust solutions
Last9

Software Observability from the Lens of Radar and a Black Box
Observability is often a misunderstood and misused term. It has come to mean nothing and everything at this point. Read more on how Observability can be viewed from the lens of a Radar and a Black Box.
Nishant Modak

Mastering Prometheus Relabeling: A Comprehensive Guide
A comprehensive guide to relabeling strategies in Prometheus
Last9
Real-Time Canary Deployment Tracking with Argo CD & Last9
Use Last9's powerful change events to track success of canary rollouts via ArgoCD
Preeti Dewani
Monitor Google Cloud Functions using Pushgateway and Levitate
How to monitor serverless async jobs from Google Cloud Functions with Prometheus Pushgateway and Levitate using the push model
Aniket Rao

Challenges with Running Prometheus at Scale
Understanding limitations and challenges scaling Prometheus in modern cloud-native environments. Here we delve into long-term retention, downsampling, high availability, and other challenges.
Last9

Prometheus vs. ELK
Comparison and differences between Prometheus and ELK
Last9

What is Thanos and How Does it Scale Prometheus?
A guide on what is Thanos and how it can be used with Prometheus
Last9

Golang Concurrency Masterclass by Swati Modi at Gophercon 2023
Talk on Golang Concurrency Masterclass by Swati Modi at Gophercon 2023
Last9

OpenTelemetry vs OpenTracing: What's the Difference?
Discover the key differences between OpenTelemetry and OpenTracing, and how they impact observability and tracing in modern applications.
Prathamesh Sonpatki

Do more with your metrics by Piyush Verma
Piyush Verma's talk at GopherCon India 2022 on Do More with Your Metrics with Last9 and Levitate
Last9

Unwiring High Cardinality - SRE Day 2023
Report from SRE Day 2023, where Piyush Verma - CTO Last9, gave a talk on Unwiring High Cardinality
Last9
How to restart Kubernetes Pods with kubectl
A simple reckoner on how to restart a Kubernetes pod with kubectl
Anjali Udasi

This arctic winter — time to repay your tech debt
We're in a peak tech winter. What should engineering teams focus on when product velocity dwindles?
Ajey Gore
Levitate: Last9’s Managed TSDB Now on AWS Marketplace
Levitate - Last9's managed Prometheus Compatible TSDB is available on AWS Marketplace
Prathamesh Sonpatki

PromQL Macros in Levitate
Define PromQL Macros to standardize complex PromQL queries in Levitate
Prathamesh Sonpatki
GCP Managed Service For Prometheus vs. Levitate
A detailed comparison of Levitate and Google Managed Prometheus - Cost, Scale and Ease of Use
Prathamesh Sonpatki

A case for Observability outside engineering teams
Observability is being built by engineers for engineers. In reality, o11y is for all.
Aniket Rao

Understanding the Rasmussen model for failures
What does the Rasmussen model teach us about Site Reliability Engineering?
Nishant Modak

How we tame High Cardinality by Sharding a stream
Using 'Sharding' to tame High Cardinality data for Last9 - Our Time Series Data Warehouse
Piyush Verma

Thanos vs. VictoriaMetrics
A deep dive comparison between Thanos and VictoriaMetrics: Performance and Differences
Last9

1979, a nuclear accident and SRE
Deep diving into the 'Normal accident' theory by Charles Perrow, and what it means for SREs
Aniket Rao

Ingest OpenTelemetry metrics with Prometheus natively
Native support for OpenTelemetry metrics in Prometheus
Prathamesh Sonpatki

How we tame high cardinality in time series databases
Engineering innovation to solve high cardinality with Last9 - a multi-part series
Piyush Verma
Swati Modi
InfluxDB vs. Thanos
InfluxDB vs Thanos: Overview, Pros and Cons, and Differences
Prathamesh Sonpatki

What Site Reliability Engineering Needs: A Swarm of Bees
If all companies are software companies, all companies need better Observability to understand how performative their software is
Aniket Rao
Prometheus vs. VictoriaMetrics (VM)
Comparing Prometheus vs. VictoriaMetrics (VM) - Scalability, Performance, Integrations
Last9
Prometheus vs. Cortex
Comparing Prometheus vs. Cortex - Scalability, Cost, Performance, Known Weaknesses
Last9

Take back control of your Monitoring
Take back control of your Monitoring with Last9 - a managed time series data warehouse
Nishant Modak

Graphite vs Prometheus
Compare Graphite and Prometheus, two leading open-source monitoring solutions.
Prathamesh Sonpatki

SRECon APAC 2023 Recap
Recap of SRECon APAC 2023 in Singapore
Aniket Rao

QCon New York 2023 Recap
Recap of QCon New York 2023 Conference
Prathamesh Sonpatki
Prometheus vs Thanos: Key Differences & Best Practices
Everything you want to know about Prometheus and Thanos, their differences, and how they can work together.
Last9

How to Manage High Cardinality Metrics in Prometheus
A comprehensive guide on understanding high cardinality Prometheus metrics, proven ways to find high cardinality metrics and manage them.
Last9

Prometheus vs Grafana: Key Differences and When to Use Each
Explore the differences between Prometheus and Grafana and how these two powerful tools work together to enhance monitoring and data visualization.
Prathamesh Sonpatki

Observability is a practice, not a job
Engineering organizations that ship fast have Observability as part of their core DNA.
Aniket Rao

Metrics, Events, Logs, and Traces: Observability Essentials
Understanding Metrics, Logs, Events and Traces - the key pillars of observability and their pros and cons for SRE and DevOps teams.
Prathamesh Sonpatki

SRE vs Platform Engineering
What's the difference between SREs and Platform Engineers? How do they differ in their daily tasks?
Last9
Prometheus vs Datadog
Comparison between Prometheus and Datadog - two of the most popular monitoring tools in the market today
Last9

Using a Golang package in Python using Gopy
Using Golang package in Python using Gopy: A simple way to leverage the power of Golang packages in Python applications.
Arjun Mahishi

SRE vs DevOps: Definition, Key Differences, and Similarities
What's the difference between SREs and DevOps professionals? How do they differ in their daily tasks?
Last9

Filtering Metrics by Labels in OpenTelemetry Collector
How to filter metrics by labels using OpenTelemetry Collector
Prathamesh Sonpatki

Who should define Reliability — Engineering, or Product?
Whoever owns Reliability should define its parameters. But who owns the Reliability of a Product? Engineering? Product Management? Or the Customer success team?
Piyush Verma

What do self-driving cars tell us about Site Reliability Engineering?
From Robocars to Reliability — SRE with self-driving cars; mapping out where the Observability space is in conjunction with self-driving cars
Mohan Dutt Parashar

Observability—OSS vs Paid vs Managed OSS
The Reliability industry needs a managed, non-vendor lock-in answer to spiraling costs, high cardinality and the toil of managing a tsdb
Satyajeet Jadhav
Learnings integrating jmxtrans
JMX metrics give solid insights into the workings of your application. Integrating them with Last9 (our time series data warehosue) required us to jump some hoops with vmagent.
Saurabh Hirani

MTTF vs MTBF vs MTTD vs MTTR
This article covers questions such as what are MTTF, MTBF, MTTD, and MTTR, their differences, how to adopt them, and their use cases.
Last9

The neglected tech arctic winter — Internal SaaS expenses
The current tech winter reveals a hard truth: spending on internal tools for tech infrastructure is bloated—and this isn't just a passing cycle.
Nishant Modak

Recap of SRECon Americas 2023
SRECon is a conference hosted by USENIX and is focused on site reliability, distributed systems, and systems engineering at scale. A Recap of SRECon Americas 2023.
Last9

Understanding “Cricket Scale”
How does a DevOps/Site Reliability Engineer plan for "Cricket scale"? How do you warm systems' about to witness 30+ million concurrent users?
Aniket Rao

What is MTBI?
Everything you need to know about Mean Time Between Incidents (MTBI) and how it can help Site Reliability Engineers
Last9

Reliability Engineering for Dummies: ELI5
Explaining Reliability Engineering to a 5-year-old.
Mohan Dutt Parashar

SLA vs SLO vs SLI - What's the difference
SLAs, SLOs, and SLIs—what’s the difference? For DevOps folks, understanding these nuances is key. Here's a quick guide to each term.
Last9
Rethinking Anomaly Detection: Focus on business outcomes
From the trenches at Games24x7 — Sanjay, on how Reliability engineering should drive core business metrics
Sanjay Singh

Interesting talks on Observability from Fosdem 2023
A recap of the talks from the Observability and Monitoring dev room at Fosdem 2023.
Prathamesh Sonpatki
Comparing Popular Service Mesh Offerings
An in-depth look at several service mesh offerings and comparison based on their features, licensing and pricing, architecture, and user experience.
Last9

Prometheus Monitoring
Prometheus is a popular open-source monitoring system. In this blog, we'll cover the basics of Prometheus monitoring, including its architecture, key features, and alternatives.
Last9

Observability is dead, long live observability
No tool can magically offer you 99.999s. Observability is largely about the basics. And basics are boring. But, boring is hard. Boring is battle tested.
Aniket Rao
When should I start thinking of observability?
How does one scale metrics maturity in a cloud-native world — A guide on observability tooling as your engineering org scales.
Piyush Verma
A practical guide for implementing SLO
How to set Service Level Objectives with 3 steps guide
Prathamesh Sonpatki
Saurabh Hirani
Introducing Levitate: Uplift Your Metrics Management
Managing time series databases is hard. We've evolved to services, yet monitoring lags. Our solution powers critical workloads at a lower cost.
Nishant Modak

Self-managed Prometheus vs Managed Prometheus
What are the differences between Self-managed Prometheus vs Managed prometheus? How do you choose what works for you?
Last9
The importance of structured communication in the world of SRE
How you communicate helps build your 9s. In the world of Site Reliability Engineering, this is crucial. How do you do it?
Saurabh Hirani

Best Practices Using and Writing Prometheus Exporters
This article will go over what Prometheus exporters are, how to properly find and utilize prebuilt exporters, and tips, examples, and considerations when building your own exporters.
Last9
The difference between DevOps, SRE, and Platform Engineering
In reliability engineering, three concepts keep getting talked about - DevOps, SRE and Platform Engineering. How do they differ?
Prathamesh Sonpatki
Thanos vs Cortex
In-depth comparison of Cortex and Thanos, what specifically they help teams do, challenges in implementing both, and how to think about what’s right for your team.
Sahil Khan

Introduction to DORA Metrics
DORA metrics, what they are, why they are important, and best practices for measuring them.
Prathamesh Sonpatki

Golang's Stringer tool
Learn about how to use, extend and auto-generate Stringer tool of Golang
Arjun Mahishi

How to improve Prometheus remote write performance at scale
Deep dive into how to improve the performance of Prometheus Remote Write at Scale based on real-life experiences
Saurabh Hirani
Prometheus vs InfluxDB: Side-by-Side Comparison
What are the differences between Prometheus and InfluxDB - use cases, challenges, advantages and how you should go about choosing the right tsdb
Anjali Udasi
India vs Pakistan: SRE and the Shannon Limit
How does one ‘detect change’ in a complex infrastructure, so you don’t lose out on critical revenues — A short SRE story
Satyajeet Jadhav
Battling Alert Fatigue
What is Alert Fatigue and techniques to reduce it
Last9
SLOs, SLIs, and SLAs: Understanding Key Service Metrics
A guide to set practical Service Level Objectives (SLOs) & Service Level Indicators (SLIs) for your Site Reliability Engineering practices.
Last9

Kubernetes Monitoring with Prometheus and Grafana
A guide to help you implement Prometheus and Grafana in your Kubernetes cluster
Last9
Why We Auto-Delete Slack Messages at Last9
At Last9, we auto-delete Slack DMs after 2 days. This pushes teams to improve documentation, reduce tribal knowledge, and own accountability.
Nishant Modak

Static Threshold vs. Dynamic Threshold Alerting
What's the difference between Static Threshold vs Dynamic Threshold Alerting? Do you really know when and how to use each threshold type?
Last9
Why MTTR should be a ‘business’ metric
A key challenge is aligning engineering health metrics with business goals. How can business measure engineering, and engineering show its value?
Sidu Ponnappa

Observability - That Last 9
TL;DR: A stitch in time, saves 9. A discussion on the key blocks of observability.
Akash Saxena
How we won Dukaan over
5 meetings. 1 month. Subhash and his team’s velocity on decision-making, moving fast, and radical candor, are a breath of fresh air in the Indian startup ecosystem.
Aniket Rao

Sample vs Metrics vs Cardinality
When dealing with Time Series databases, I always got confused with Sample vs Metrics vs Cardinality. Here’s an explanation as I have understood it.
Piyush Verma
How to calculate HTTP content-length metrics on cli
A simple guide to crunch numbers for understanding overall HTTP content length metrics.
Saurabh Hirani
Last9 completes SOC II Type 2 Certification
The comprehensive audit validates Last9 as a trusted SRE partner; a crucial process to work with highly regulated industries.
Abhi Puranam

Comparing Popular Time Series Databases
A comparison of all the popular time series databases. Prometheus, Influx, M3Db, Last9.
Abhi Puranam

Reliability Tools
A guide through the most popular DevOps and SRE tools for building your reliability stack.
Abhi Puranam

Latency is the new downtime
In the early days of Google, a lot of users were asking for 30 results on the first page of search results. So after long deliberation, Marissa Mayer, then the Product Manager for google.com, decided to run the A/B test for ten vs 30 results. When the results came in, they were in for a surprise.
Sahil Khan
We’ve raised a $11M Series A led by Sequoia Capital India!
Exciting news! We've secured an $11M Series A funding round led by Sequoia Capital India to fuel our growth and innovation at Last9!
Nishant Modak

Why Service Level Objectives?
Understanding how to measure the health of your servcie, benefits of using SLOs, how to set compliances and much more...
Piyush Verma

How to Improve On-Call Experience!
Better practices and tools for management of on-call practices
Prathamesh Sonpatki

Best Practices for Postmortems: A guide
The ins and outs of conducting an effective postmortem. Ready templates and examples from leading organizations around the world!
Prathamesh Sonpatki

Choosing Effective SLIs
Practical advice to choose an effective SLI.
Akshay Chugh

The origin of Service Level Objectives
Service Level Objectives (SLOs) dominate the software industry, but where did they come from?
Akshay Chugh
Piyush Verma

Running a Database on EC2 is Slowing It Down
Learn everything about the advantages of EC2, it's use cases and how to optimize EC2 further.
Jayesh Bapu Ahire
Akshay Chugh

Deployment Readiness Checklists
A ready checklist of a comprehensive list of steps and activities involved in the deployment of your application.
Prathamesh Sonpatki

The most interesting talks from SRECon 2021!
SRECon, hosted by USENIX, focuses on site reliability and systems engineering at scale. Discover highlights from the most interesting talks at SRECon 2021.
Akshay Chugh

Doing SRE the Right Way!
A well-thought-out approach to SRE, which will help site reliability engineers and software engineers develop and maintain a useful, consistent, and effective SRE strategy for their products!
Piyush Verma

Getting the big picture with Log Analysis
How to get the most out of your logs!
Jayesh Bapu Ahire

Microservices - Tracking Dependencies
Quick primer into microservices architecture and the importance of tracking dependencies
Akshay Chugh
Jayesh Bapu Ahire

SLOs eased
You can either love running or hate running, but you will definitely love this analogy - take a fresh look at SLOs!
Piyush Verma
Saurabh Hirani

Latency SLO
How do you set latency-based alerts? A common approach is 95% of requests completed in 350ms, but is it really that simple?
Piyush Verma
SLOs: Impact on Development, Culture, and Performance
Thanks to Service Level Objectives (SLOs), your teams have a numerical threshold for system availability, so everyone has a clear vision of what keeps the users and the business happy.
Akshat Goyal
Monorepos - The Good, Bad, and Ugly
Explore the pros and cons of monorepos, including their benefits, challenges, and potential pitfalls for managing large codebases.
Prathamesh Sonpatki

Components in Designing Effective SLOs
A primer on how to design and implement effective Serice Level Objectives(SLOs)
Akshat Goyal
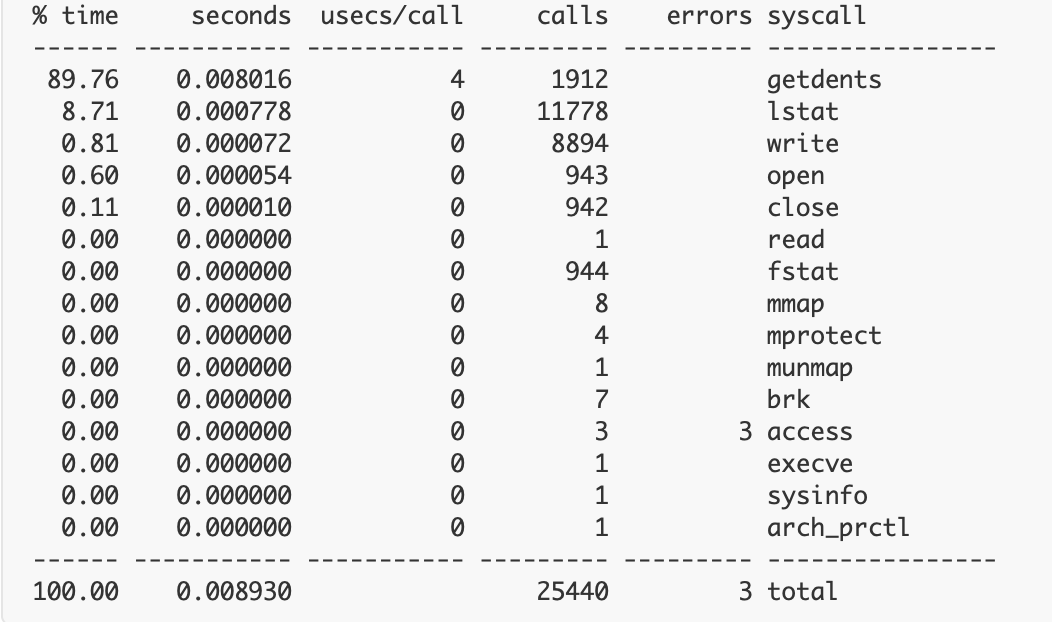
Strace – A Hidden Superpower
Like any OS, Linux isn’t immune to hiccups, especially when running closed-source apps where you can’t inspect the code for deeper insights.
Akshat Goyal
Prathamesh Sonpatki

Saturation SLO: What It Is and Why You Should Consider It
What is Saturation and why should you think about it as an SLO? Saturation can be understood as the load on your network and server resources.
Akshat Goyal

Sleep Friendly Alerting
We've all been woken up with that dreaded Slack notification at ungodly hours only to realise that the alert was all smoke and no fire. The perfect recipe for dread and alert fatigue.
Akshat Goyal
Services; not Server
Gone are the days of yore when we named are our servers Etsy, Betsy, and Momo, fed them fish, and cleaned their poop.
Nishant Modak
Piyush Verma

Systems Observability
Observability is not just about being able to ask questions to your systems. It's also about getting those answers in minutes and not hours.
Nishant Modak
Piyush Verma

AWS security groups: canned answers and exploratory questions
While using a Terraform lifecycle rule, what do you do when you get a canned response from a security group?
Saurabh Hirani

If it ain't broke...
A Terraform lifecycle rule in the right place can help prevent a deadlock. But the same lifecycle rule in the wrong place?
Saurabh Hirani

mv aws-security-group shoot-foot
How you can run into an unplanned downtime while making a seemingly harmless change of renaming an AWS security group through Terraform?
Saurabh Hirani

Rescuing a SPAghetti React project
Practical tips for rescuing a SPAghetti React JS project. With confidence and a shared mental model, we made the codebase reliable and easier to manage.
Prathamesh Sonpatki

One year at Last9
Celebrating one year at Last9! From uncertainty to growth, it's been an amazing journey with an inspiring team and exciting challenges.
Prathamesh Sonpatki

Much That We Have Gotten Wrong About SRE
An illustrated summary of Developers ➡ DevOps ➡ SRE
Piyush Verma

Infrastructure-As-Code-As-Software
Explore how Infrastructure-as-Code-as-Software combines coding practices with automation to streamline infrastructure management and enhance scalability.
Piyush Verma
SLOs That Lie
Understanding how SLOs can help improve your performance and How to set the right Service Level Objectives for your application
Piyush Verma

Latency Percentiles are Incorrect P99 of the Times
What are P90, P95, and P99 latency? Why are they incorrect P99 of the times? Latency is for a unit of time and the preferred aggregate is percentile.
Piyush Verma
SRE Tooling – the Clever Hans fallacy
Chef or Ansible? Terraform or Pulumi? Python or Ruby? Last9 or Last9? Discover how building new tools links to the tale of a horse that could do math!
Piyush Verma

Root Cause Analysis For Reliability: A Case Study
Let's explore the importance of RCAs in Site Reliability Engineering, why use RCAs, and our take on what constitutes a “good” RCA.
Piyush Verma