

The OpenTelemetry Collector is a vendor-neutral service that sits between your applications and your observability backend: it receives telemetry data, processes it, and exports it wherever you point it. Instrument once, send everything to the Collector, and it routes your metrics, logs, and traces. Switching backends becomes a config change, not a code change.
If OpenTelemetry as a whole is new to you, start with what is OpenTelemetry. Everything below assumes the basics and sticks to the Collector itself.
What is the OpenTelemetry Collector?
The OpenTelemetry Collector is an open source service that ingests telemetry data from your applications, processes it, and exports it to the backend of your choice. It handles traces, metrics, and logs. Because it speaks many protocols on both ends, it acts as a universal translator between whatever produces telemetry and whatever stores it. For the metrics signal in depth, see OpenTelemetry metrics.
The primary function of the OpenTelemetry Collector is to receive telemetry data from applications or services, process it, and send it to the backend specified by the user. It’s vendor-agnostic, meaning it can receive data from various sources and export it to multiple destinations, including open-source and commercial backends.
The OpenTelemetry Collector is configuration-driven and can be used to build production-grade telemetry pipelines. Depending on the use case, it can be deployed as an agent on a host or as a standalone service. It is built with a modular architecture, allowing users to pick and choose between different receivers, processors, exporters, and extensions to meet their specific needs.
Otel Collector has extensive docs available; see the official OpenTelemetry Collector documentation.
How Does the OpenTelemetry Collector Work?
The Collector works in three main stages: it receives data, processes it, and then exports it. By default, its OTLP receiver listens on port 4317 for gRPC and port 4318 for HTTP; everything else about the pipeline is YAML configuration.
- Receivers: The Collector’s receivers accept telemetry data from various sources. These sources can be instrumentation libraries (like OpenTelemetry SDKs), other collectors, or other systems such as FluentBit. The data can be in multiple formats, including but not limited to, OpenTelemetry protocol (OTLP), Jaeger, Zipkin, and Prometheus.
- Processors: Once the data is received, it is processed. The processing stage can involve several operations, such as batching, filtering, or enhancing the data. You can control the processing operation by setting up pipeline configs.
- Exporters: After the data has been processed, it can be exported. The OpenTelemetry Collector can export data to multiple backends such as Jaeger, Zipkin, and Last9. The list of supported backends is continuously growing as the community develops more exporters.
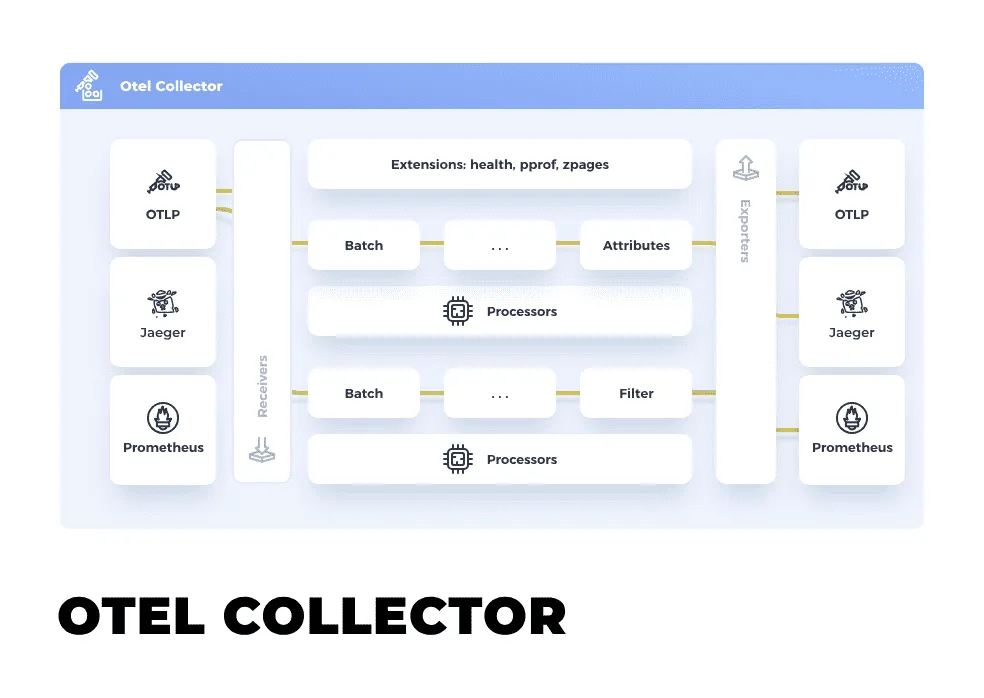
OpenTelemetry Collector Architecture
The Collector’s architecture is a set of pipelines you define in YAML: telemetry enters through receivers, moves through a chain of processors, and leaves through exporters. Components are independent and composable; the same blocks describe a laptop setup or a deployment pushing millions of spans a minute.
Unified Format: The OTel Collector uses the OpenTelemetry Protocol (OTLP) as its internal format for telemetry data, including metrics, traces, and logs.
Modular and Configurable Architecture: The OTel Collector consists of multiple configurable components, which lets you assemble exactly the pipeline you need.
Every Collector build is assembled from four component types:
| Component | Role in the pipeline | Common examples |
|---|---|---|
| Receiver | Entry point; ingests telemetry from apps and infrastructure | otlp, jaeger, prometheus, filelog |
| Processor | Transforms data in flight between receipt and export | batch, memory_limiter, attributes, filter |
| Exporter | Sends processed data onward to one or more backends | otlp, prometheusremotewrite, debug |
| Extension | Capabilities outside the data pipeline | health_check, pprof, zpages |
Receivers
Receivers are the entry point of the telemetry data into the OTel Collector. They ingest data in various formats from different sources. Each receiver is designed to understand and interpret a specific data format. They convert this data into a format the OTel Collector can understand and further process.
In practice, otlp covers anything instrumented with OpenTelemetry SDKs, prometheus scrapes existing metrics endpoints, and the filelog receiver tails container logs on Kubernetes. Receivers also exist for older formats like Jaeger, Zipkin, and OpenCensus, which makes gradual migrations practical.
Processors
Once the data is received, it is sent through a pipeline of Processors. These Processors can manipulate the data before it is sent to an Exporter. For instance, they can aggregate data, enrich it, filter it, or perform other transformations. Processors are an optional part of the pipeline and can be configured as needed.
Treat batch and memory_limiter as defaults: batching cuts outbound connections, and the memory limiter keeps the Collector from exhausting its host. attributes rewrites metadata in flight; filter drops data you never wanted to store. Older guides mention queued_retry; it was removed, its job now handled by exporter retry queues.
Exporters
Exporters are the final stop in the OTel Collector pipeline. They take the processed data and send it to the backend(s) defined in the Collector’s configs. Like Receivers, different Exporters are designed to send data to different backends.
otlp is the default and works with any OTLP-native backend, Last9 included. prometheusremotewrite pushes metrics to Prometheus-compatible storage, and debug prints telemetry to stdout for pipeline troubleshooting. The dedicated jaeger exporter was removed once Jaeger started accepting OTLP natively.
Extensions
Extensions are components that aren’t directly involved in the data pipeline but provide additional capabilities or interfaces. For example, they can provide health checks, do performance profiling, or allow for dynamic configuration updates.
health_check exposes an endpoint your orchestrator can probe, pprof turns on Go profiling when the Collector itself misbehaves, and zpages serves live debug pages showing pipeline state.
Last9 is an OTLP-native backend for the Collector: point your otlp exporter at it and metrics, logs, and traces land in one place. Setup details are in the OpenTelemetry integration docs.
Advantages of Using the OpenTelemetry Collector
The Collector’s main advantages are vendor neutrality, simpler service configuration, lower network and resource overhead, and one place to apply processing across all your telemetry.
- Vendor Neutrality: The Collector is vendor-agnostic, meaning it can receive data in multiple formats and export to multiple backends. That is what keeps you out of vendor lock-in.
- Reduced Complexity: By removing the need to send data directly from each service to your backend, the Collector reduces the complexity of your observability pipeline.
- Resource Efficiency: The Collector provides features like batching and compression out of the box, which can reduce the resource usage of your services and the network bandwidth required to send data to the backend.
- Unified Data Processing: Since all telemetry data passes through the Collector, you can uniformly apply processing such as filtering or augmentation across all data, ensuring consistency in your observability data.
Integration with Kubernetes
In Kubernetes, the Collector usually runs as a DaemonSet, one instance per node, collecting telemetry from every pod scheduled there. The pieces break down like this:
Deployment
- Deploying as a DaemonSet: You typically deploy the OTel Collector instance as a DaemonSet within a Kubernetes cluster. This deployment ensures that a single instance of the Collector runs on each node in the cluster, allowing it to gather metrics, traces, and logs from all applications running on that node.
- Deploying as a Sidecar: In some cases, you might also deploy the OTel Collector as a sidecar within specific Kubernetes pods. This deployment allows the Collector to only gather telemetry data from that specific pod or service.
From experience: a Collector DaemonSet once OOM-looped on us for an afternoon because its config had no memory_limiter and no batch size cap. A traffic spike filled the pipeline, the kernel killed the pod, Kubernetes restarted it, and the loop repeated. The telemetry gap lined up exactly with the incident we needed data for.
Data Collection
- Receiving Data: When deployed on Kubernetes, the OTel Collector can receive telemetry data from your applications via receivers. You can instrument your applications with OpenTelemetry SDKs to send this data to the Collector.
- Scraping Metrics: The Collector can scrape metrics directly from Kubernetes via the Kubelet’s and Prometheus metrics endpoints. With the Prometheus receiver, the Collector can scrape metrics from any target that uses the Prometheus exposition format.
- Collecting Logs: With the appropriate receiver, such as the FluentBit or Fluentd receiver, the Collector can collect logs generated by your applications.
Data Processing and Exporting
Once data reaches the Collector, the configured pipeline takes over. Processors filter, enrich, or strip sensitive fields; exporters fan results out to Last9, Grafana, Jaeger for traces, Elasticsearch for logs, or Google Cloud Monitoring.
Integration with Kubernetes Services
The Collector also talks to the Kubernetes API directly. With the Prometheus receiver it can use Kubernetes service discovery to find scrape targets as pods come and go, and it can enrich telemetry with pod, namespace, and deployment metadata so you can tell which workload produced what.
By implementing the OpenTelemetry Collector in your Kubernetes environment, you can standardize your telemetry data collection, processing, and export across your entire infrastructure. This helps you maintain a clear view of your application’s performance and reduces the complexity of your observability setup.
Additional capabilities
The core OpenTelemetry Collector ships deliberately small: stable components, no vendor code. Plenty of real-world needs sit outside that set, including tail-based sampling, vendor-specific exporters, and niche receivers. That’s where opentelemetry-collector-contrib comes in.
opentelemetry-collector-contrib is an open-source project available on GitHub that extends the functionality of the OpenTelemetry Collector with additional components. It includes receivers, processors, exporters, and extensions not part of the core distribution due to their experimental nature, limited usage, or maintenance status. These components can be contributed by the community and are provided to support more specialized or less common use cases.
Getting Started locally
Using the following collector configuration file, you can use Docker to set up the Otel collector locally.
docker pull otel/opentelemetry-collector-contrib:0.81.0docker run otel/opentelemetry-collector-contrib:0.81.0otel-collector: image: otel/opentelemetry-collector-contrib volumes: - ./otel-collector-config.yaml:/etc/otelcol-contrib/config.yaml ports: - 1888:1888 # pprof extension - 8888:8888 # Prometheus metrics exposed by the collector - 8889:8889 # Prometheus exporter metrics - 13133:13133 # health_check extension - 4317:4317 # OTLP gRPC receiver - 4318:4318 # OTLP http receiver - 55679:55679 # zpages extensionOne gotcha: otel/opentelemetry-collector (core) and the contrib image are different distributions. A config referencing a contrib-only component, like the filelog receiver or tail_sampling processor, fails at startup on the core image with an ‘unknown type’ error. When in doubt, use contrib; it includes everything in core.
You can find examples of sending metrics via OpenTelemetry Collector using Prometheus Remote Write protocol in the last9-integrations repo on GitHub.
FAQs
What is the OpenTelemetry Collector used for?
The OpenTelemetry Collector receives telemetry from instrumented applications, processes it, and exports it to one or more observability backends. Teams use it to decouple instrumentation from storage: services send everything to the Collector over OTLP, and it handles batching, filtering, enrichment, and routing.
Do I need the OpenTelemetry Collector?
Not always. If you run a few services and your backend accepts OTLP directly, exporting straight from the SDK is fine. The Collector earns its place when you need vendor neutrality, central processing such as scrubbing sensitive attributes, fan-out to several backends, or buffering during backend outages.
What is the difference between the OpenTelemetry Collector and an agent?
An agent is not a separate tool; it is a Collector deployment pattern. In agent mode, a Collector runs on every host or node, typically as a DaemonSet or sidecar. In gateway mode, a central pool of Collectors receives data from those agents. Most production setups combine both.
What ports does the OpenTelemetry Collector use?
By default, the OTLP receiver listens on port 4317 for gRPC and port 4318 for HTTP. Deployments commonly expose 13133 for the health_check extension, 8888 for the Collector’s own metrics, and 55679 for zpages. Every one of these is configurable.
What is the difference between opentelemetry-collector and opentelemetry-collector-contrib?
opentelemetry-collector is the core project: a small set of stable components such as the OTLP receiver and exporter, batch, and memory_limiter. opentelemetry-collector-contrib adds everything else: vendor exporters, the filelog receiver, the tail_sampling processor, and hundreds of community components. Run contrib unless image size or audit surface matters; core configs work on it unchanged.
Wrapping up
If you’re starting today: run the contrib distribution, deploy it as an agent on every node, and add a central gateway only when you need fan-out or tail-based sampling. Define pipelines in YAML and keep that file in version control next to the services it observes. One mistake to avoid: shipping without the memory_limiter processor. An unbounded Collector will OOM during the exact traffic spike you wanted to see.

