


We wrote this post when our metrics product was called Levitate, a name we used until the end of 2024. Last9 now supports metrics, logs, traces, and profiles, so we use one name: Last9.
Effective control of operational expenses is central to the deployment and administration of Kubernetes. While Kubernetes empowers users with enhanced control over deployments, it requires a deep understanding and effective management of associated costs. OpenCost, tailor-made for Kubernetes cost monitoring, paired with Last9, presents a holistic solution to address this challenge.
In this blog we will learn how to integrate existing OpenCost setup with Last9 for monitoring Kubernetes costs.
What is Last9?
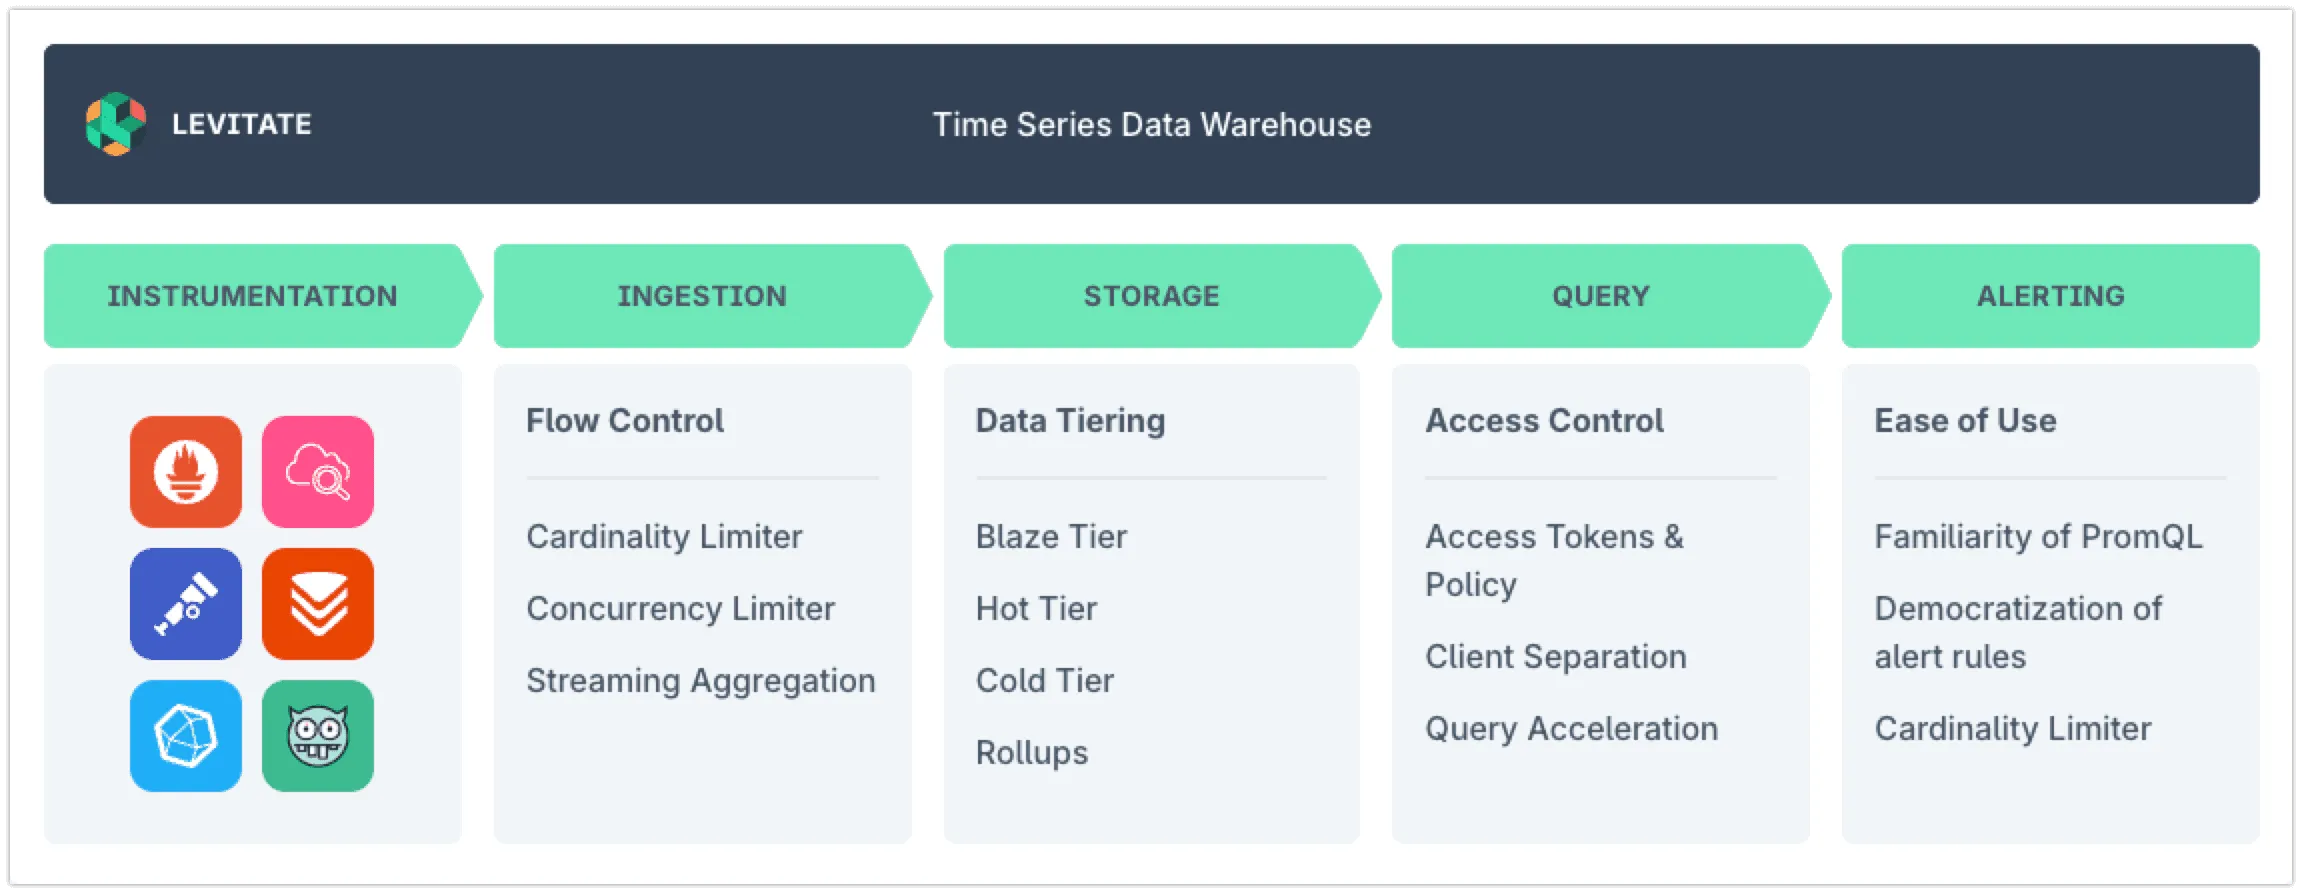
Last9 is a unified observability platform. It is compatible with Prometheus and OpenTelemetry and provides better performance and workflows to tame high cardinality.
Get started by creating an account.
What is OpenCost?
OpenCost is a CNCF-backed open-source cost monitoring tool for cloud-native environments, built to offer a complete view of Kubernetes cluster costs across various cloud providers, regions, and on-premises installations. It enables real-time monitoring of Kubernetes cluster costs, providing a detailed breakdown for each resource.
OpenCost relies on the metrics emitted by node-exporter and kube-state-metrics (KSM). It queries the underlying TSDB storage for these metrics. It also ships with a web UI for visualization and a Grafana dashboard.
OpenCost also has built-in integrations with cloud providers using their APIs to retrieve billing information.
OpenCost Installation
OpenCost can be installed using Helm. It assumes an existing Prometheus Operator installation. You can follow along with the documentation and carry out the installation.
Connecting OpenCost to Last9
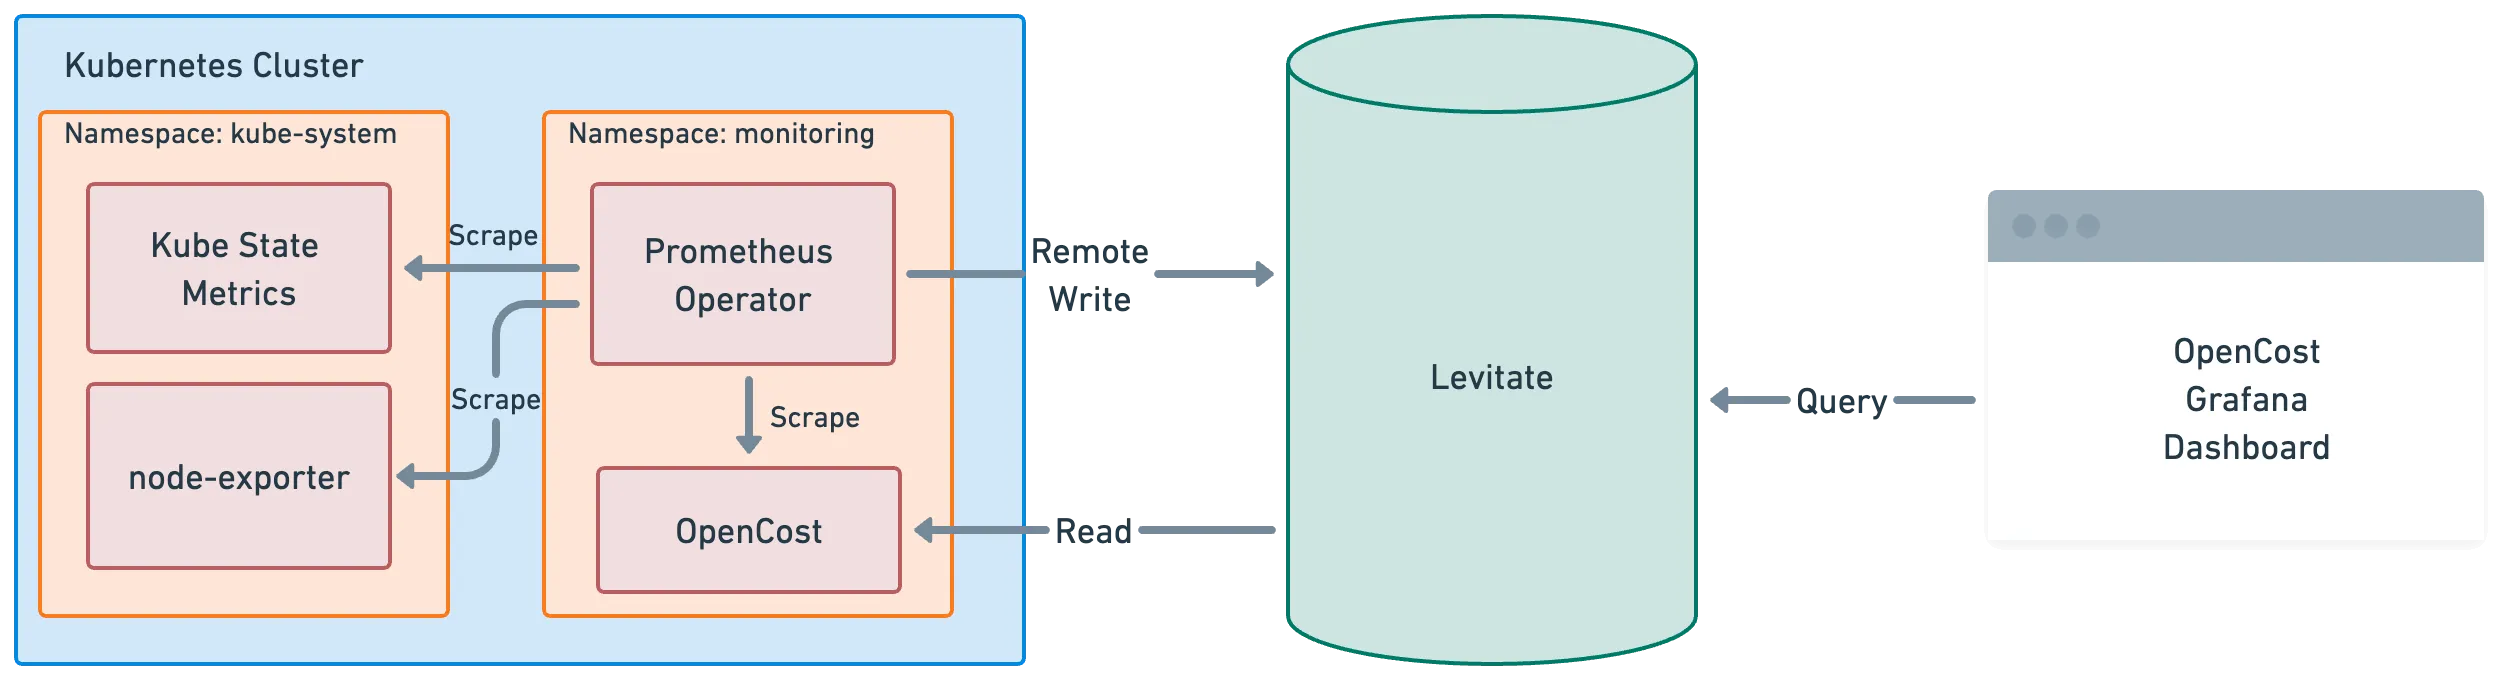
Integrating OpenCost with Last9 is super easy as it requires a minimal configuration change to be deployed. OpenCost assumes that the required metrics to be queried are stored in a TSDB like Last9. It involves following steps.
- Configure Prometheus Operator to remote write Kubernetes metrics such as
kube-state-metricsandnode-exporterto Last9. - Additionally, Prometheus Operator can be configured to scrape metrics that OpenCost emits and send them to Last9.
- Read metrics from Last9 needed for OpenCost. Obtain the OpenCost Helm Chart
values.yaml. If you have customized your Helm Chart values, use that instead of the default file. - Update OpenCost Helm Chart
values.yamlwith Last9 Read Credentials. Obtain Read Credentials following this guide. - Replace the default config with the below-modified config. Update placeholders with proper authentication credentials as obtained earlier.
prometheus: # -- Secret name that contains credentials for Prometheus secret_name: ~ # -- Prometheus Basic auth username username: "<last9_username>" # -- Key in the secret that references the username username_key: DB_BASIC_AUTH_USERNAME # -- Prometheus Basic auth password password: "<last9_password>" # -- Key in the secret that references the password password_key: DB_BASIC_AUTH_PW # -- Prometheus Bearer token bearer_token: "" bearer_token_key: DB_BEARER_TOKEN external: # -- Use external Prometheus (eg. Last9) enabled: true # -- External Prometheus url url: "<last9_read_url>" internal: # -- Use in-cluster Prometheus enabled: false # -- Service name of in-cluster Prometheus serviceName: prometheus-server # -- Namespace of in-cluster Prometheus namespaceName: prometheus-system # -- Service port of in-cluster Prometheus port: 80Ensure that Prometheus is an external data source
enabledis set totrueand internalenabledis set tofalse.
- Thats it! Clean and simple 👌 Deploy Helm Chart with these updated configs
helm upgrade opencost opencost/opencost -f ./values.yaml --kubeconfig=/path/to/kubeconfigOpenCost Grafana Dashboard
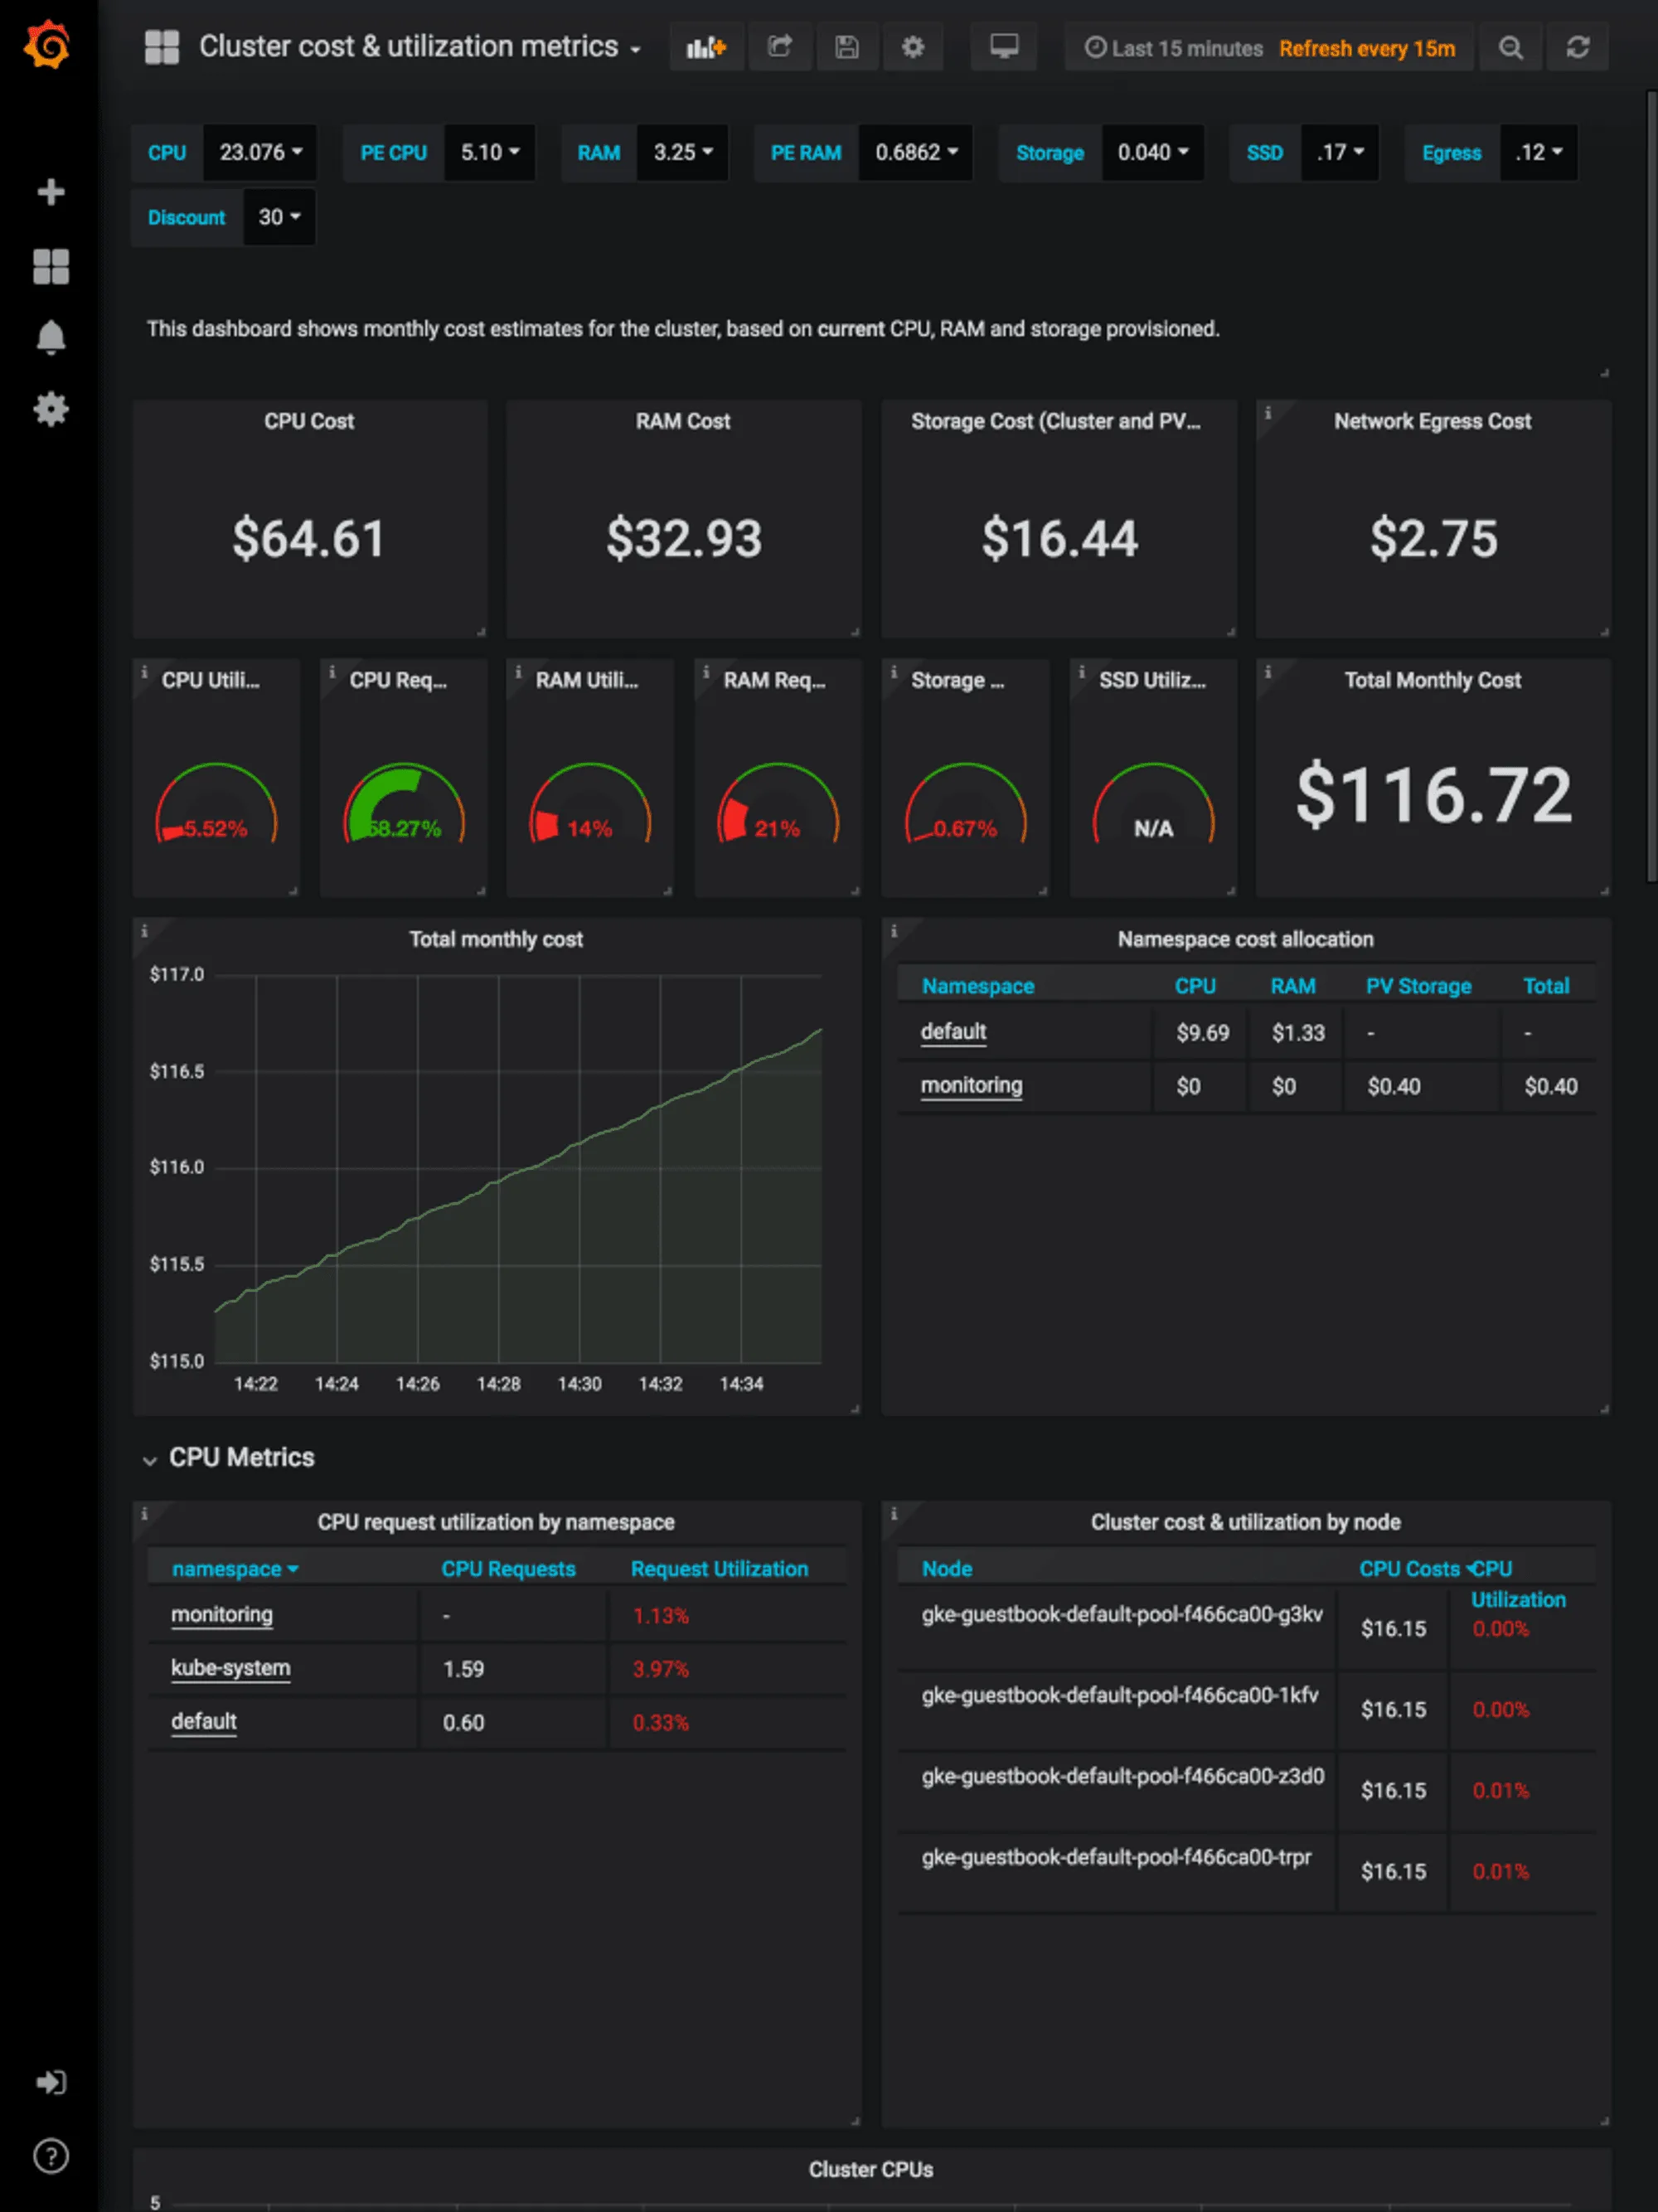
Import this dashboard is provided by OpenCost here.
Conclusion
In summary, effective Kubernetes management requires careful monitoring of operational costs. OpenCost, offering a comprehensive view of Kubernetes costs across diverse platforms, coupled with Last9’s efficient time-series data storage and powerful alerting workflows, creates a powerful cost monitoring system. Together, they enable real-time tracking, detailed cost breakdowns, and insightful visualizations, ensuring optimal financial efficiency in Kubernetes deployments.
Get up and running with Last9 and forget the pain and toil of managing high cardinality metrics yourself. Get started today.


