

Imagine experiencing an issue with a critical dependency like a cloud provider or a payment gateway. You are in the midst of an incident due to this provider's unavailability.
After going through the usual checklist, the first thing you do is look up that provider's status page — only to realize it shows all green and healthy. It's pretty frustrating to operate in this dependency hell when you know for sure the service is unavailable, only to be told all is good. Hours wasted in frustration, fail-over scenarios, and trust lost with your own customers.
What's an ideal way to solve this? Why can’t I get a status page just for my application? The provider has promised me an SLA that I want to track or get notified about!
If there is going to be an internet or power outage in my area — I am informed almost in real time about my degraded experience to handle it. Why can't software deliver on this promise?
This is a common complaint of many SaaS companies' customers. How do we solve this problem? We need to provide our customers enough visibility, in real-time, into the health of the system.
But in our quest for building highly reliable software, we monitor everything under the sun – instances, networks, storage, applications - except the thing that matters the most in Software as a Service (SaaS) - tenants or customers.
What's common to most SaaS companies? Multi-tenant systems, or shared infrastructure, which implies a Noisy Neighbor problem.
Noisy Neighbor problem
Keep the music down. Regular people sleep at this time!
The "noisy neighbor" problem refers to a situation where one tenant's heavy or inefficient use of shared resources negatively impacts the performance experienced by other tenants.
For instance, in a multi-tenant cloud environment, if Tenant A begins to consume a disproportionately large amount of music CPU, memory, storage bandwidth, or network bandwidth, Tenant B and Tenant C might experience irritation, slowed performance, increased latency, or other disruptions. One needs real-time access to the system's health to constantly monitor any degradation and make decisions to limit the damage.
For B2B SaaS companies, tracking the performance of their systems per customer across different dimensions, such as availability, costs, utilization, and adoption. Without access to real-time, granular metrics per customer, you are flying blind, unable to discern concrete evidence of performance degradation or its reasons.
Introducing multi-tenant architecture amplifies the monitoring challenge. Ensuring that the current customer setup aligns with SLA guarantees while simultaneously monitoring the transition means more data to monitor. Ignoring this results in — either the engineering team identifying a problem or, worse, a disgruntled customer. Both are bad because the damage is already done. The bottom line is that this directly impacts business revenue and lack of trust with customers.
KPIs for SaaS Monitoring
- Cost per tenant, especially the trend of shifting costs with changes in underlying systems over time.
- Resource utilization per tenant is adequate or not.
- Adoption of product per tenant.
- Access to seasonal metrics, which help make better decisions for capacity planning, month-on-month, and year-on-year trend analysis with granular data.
- Visibility on which customer is affected for proactive communication and incident mitigation.
- Building trust with internal non-engineering teams and the customer!
Only having access to the granular information, in real-time, for a sufficiently long-term horizon can help meet these goals and customers' expectations.
Successful SaaS Monitoring Outcomes
- Access to critical key performance metrics per tenant.
- A live real-time dashboard to track the performance of all customer-facing applications per tenant.
- Ability to drill down and escalate to application owners as needed.
- Access to historical granular information to track seasonality changes over time.
The following are must-haves to achieve the above outcomes.
- Start tracking per tenant telemetry data by adding a tenant label in all metrics.
- Capturing per Tenant P99, Error rate, and Throughput.
- Per Tenant SLA Tracking.
- Live Reporting Dashboards.
- Historical SLA reports.
- Deployment correlation.
- Access to historical granular data.
Pitfalls of Current Monitoring Tools
However, accessing this information with today's monitoring tools is a real pain.
Data Growth
Let's start with the elephant in the room: tracking per tenant metrics means data under observations explodes, and more customers tell observations. In metrics monitoring, it results in high cardinality - a phenomenon of data points for a particular metric blowing up beyond control, causing it to slow down entire monitoring.
High cardinality is synonymous with cost for most of the engineers. The more the cardinality, the more the price you have to pay. This results in observing “less”, sacrificing crucial information.
Latent Dashboards
Every time the cardinality increases, dashboards become slower and slower. The information is never accessible in real-time when needed.
Alert Fatigue
Precise alerting in real-time is necessary for proactive communication with customers. Still, the lack of contextual information per customer causes a lot of irrelevant alerts, which only increases the alert fatigueis instead of providing meaningful insights.
Skyrocketing costs
The only way to keep up is to throw in more resources, making monitoring costs astronomical to achieve the outcome. For many organizations, tracking per-tenant metrics is impossible because their monitoring tools can’t handle per-tenant metrics reliably without blowing up costs.
Constant Engineering Support
Lack of standardization results in reliance on engineering to provide answers and change the metrics as needed, which burdens engineering. Without standards, much unnecessary information gets tracked in the hope of being useful later, but it is always wasted. Remember those bytes allocated metrics; no one uses them ever!
Lack of Automation
Lack of automation in onboarding new customers and new services means the teams are slow to respond to changes and are always lagging in tracking the success of their customers. Any recent change requires manual intervention, resulting in toil. Alerts get missed, dashboards are outdated, and service ownership is unclear, resulting in loss of information and increased MTTR as teams chase information at runtime without access to it.
Levitate - Real-Time Monitoring for SaaS Businesses
Levitate is our managed time series data warehouse built to mitigate the problems faced by time series databases — of high cardinality and concurrent access while providing highly available storage, faster queries, and proactive alerting.
High Cardinality Support
Tracking per-customer metrics is no longer an issue with Levitate. Use Levitate's streaming aggregation pipeline to track only the information that matters per tenant or otherwise without compromising costs and performance.
Read more on Streaming Aggregation.
Change Intelligence
Real-Time Change Intelligence Alerting is purpose-built with contextual information about external change events, such as deployments and configuration changes, to ensure teams can proactively manage communication and be on top of incidents.
Read more on Change Intelligence and Change Events.
Long-Term Retention
Levitate's automatic data tiering allows long-term metrics access without losing granularity. Depending on the need and use case, use fast and slow tiers for metrics that unlock seasonality analysis, trend analysis, and capacity planning.
Read more on Data Tiering.
First-class Automation Support
Levitate supports onboarding new customers with standardized dashboards and alert rules, ensuring that each customer’s monitoring setup is maintained and tracked, removing toil, and setting up standard expectations across teams.
Read more on automation.
Business Metrics
Levitate supports monitoring business metrics with its real-time events to metrics pipeline, which allows ingesting high-velocity data and converting it into business knowledge available for analysis and other metrics.
Read more on getting started with tracking Business Events with Levitate.
Historical Overview
Understand the performance of services and components in the past and find daily, weekly, and hourly system degradation patterns. Understand the historical trend of the change in behavior with Levitate to make better decisions.
Read more on the historical overview of system behavior.
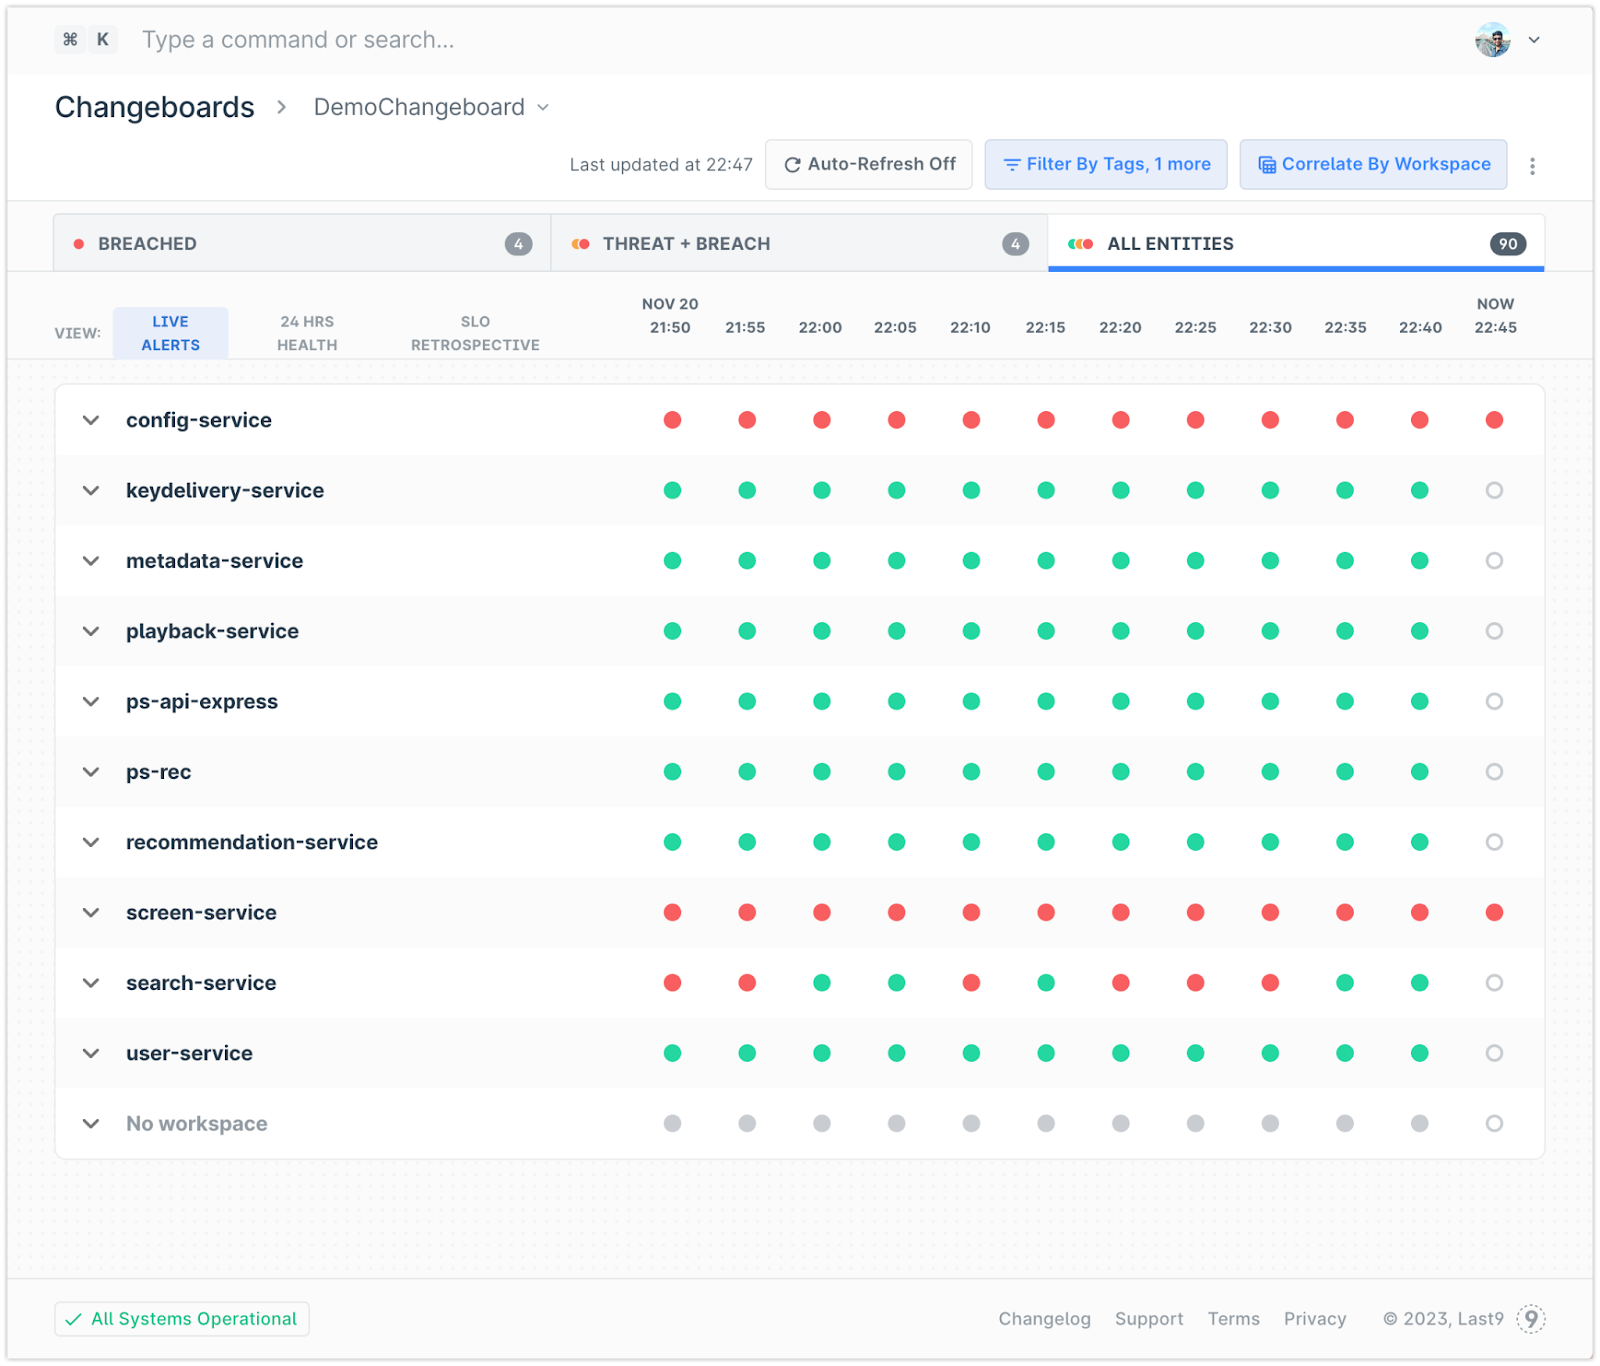
Changeboards
System changes are inevitable. This rapid change means we’re always scrambling to understand where these changes occur and how they impact our workflows. Changeboards provide a way to correlate entities in multiple ways — workflows, priorities, teams, or any other logical group. We can also understand their impact on each other and customers.
Changeboards allow tracking performance SLAs per customer via real-time changeboards across all customer-facing applications and components per day, per hour, per week.

Levitate - Real-Time Monitoring for SaaS Businesses
Levitate is helping large B2B SaaS companies such as Clevertap monitor their customers in real time. If you are a B2B SaaS, schedule a demo with us and see the magic unfold!

