

Datadog is a strong observability platform, but teams start looking for alternatives when custom metrics, log indexing, APM hosts, and high-cardinality tags make the monthly bill hard to predict. The best Datadog alternative depends on what you are replacing: Last9 fits high-cardinality metrics, logs, and traces with usage-based pricing; Grafana Cloud suits managed Prometheus and Loki; SigNoz is OpenTelemetry-native open source; New Relic and Dynatrace cover broad enterprise APM.
This guide compares nine Datadog competitors by best fit, pricing model, and migration path, so you can match a tool to your stack instead of switching blind.
The best Datadog alternatives in 2026 are Last9 for high-cardinality observability and cost control, Grafana Cloud for managed Prometheus and Grafana, SigNoz for OpenTelemetry-native open source, New Relic and Dynatrace for enterprise APM, and Splunk or Elastic for log-heavy environments.
Why Teams Look for Datadog Alternatives
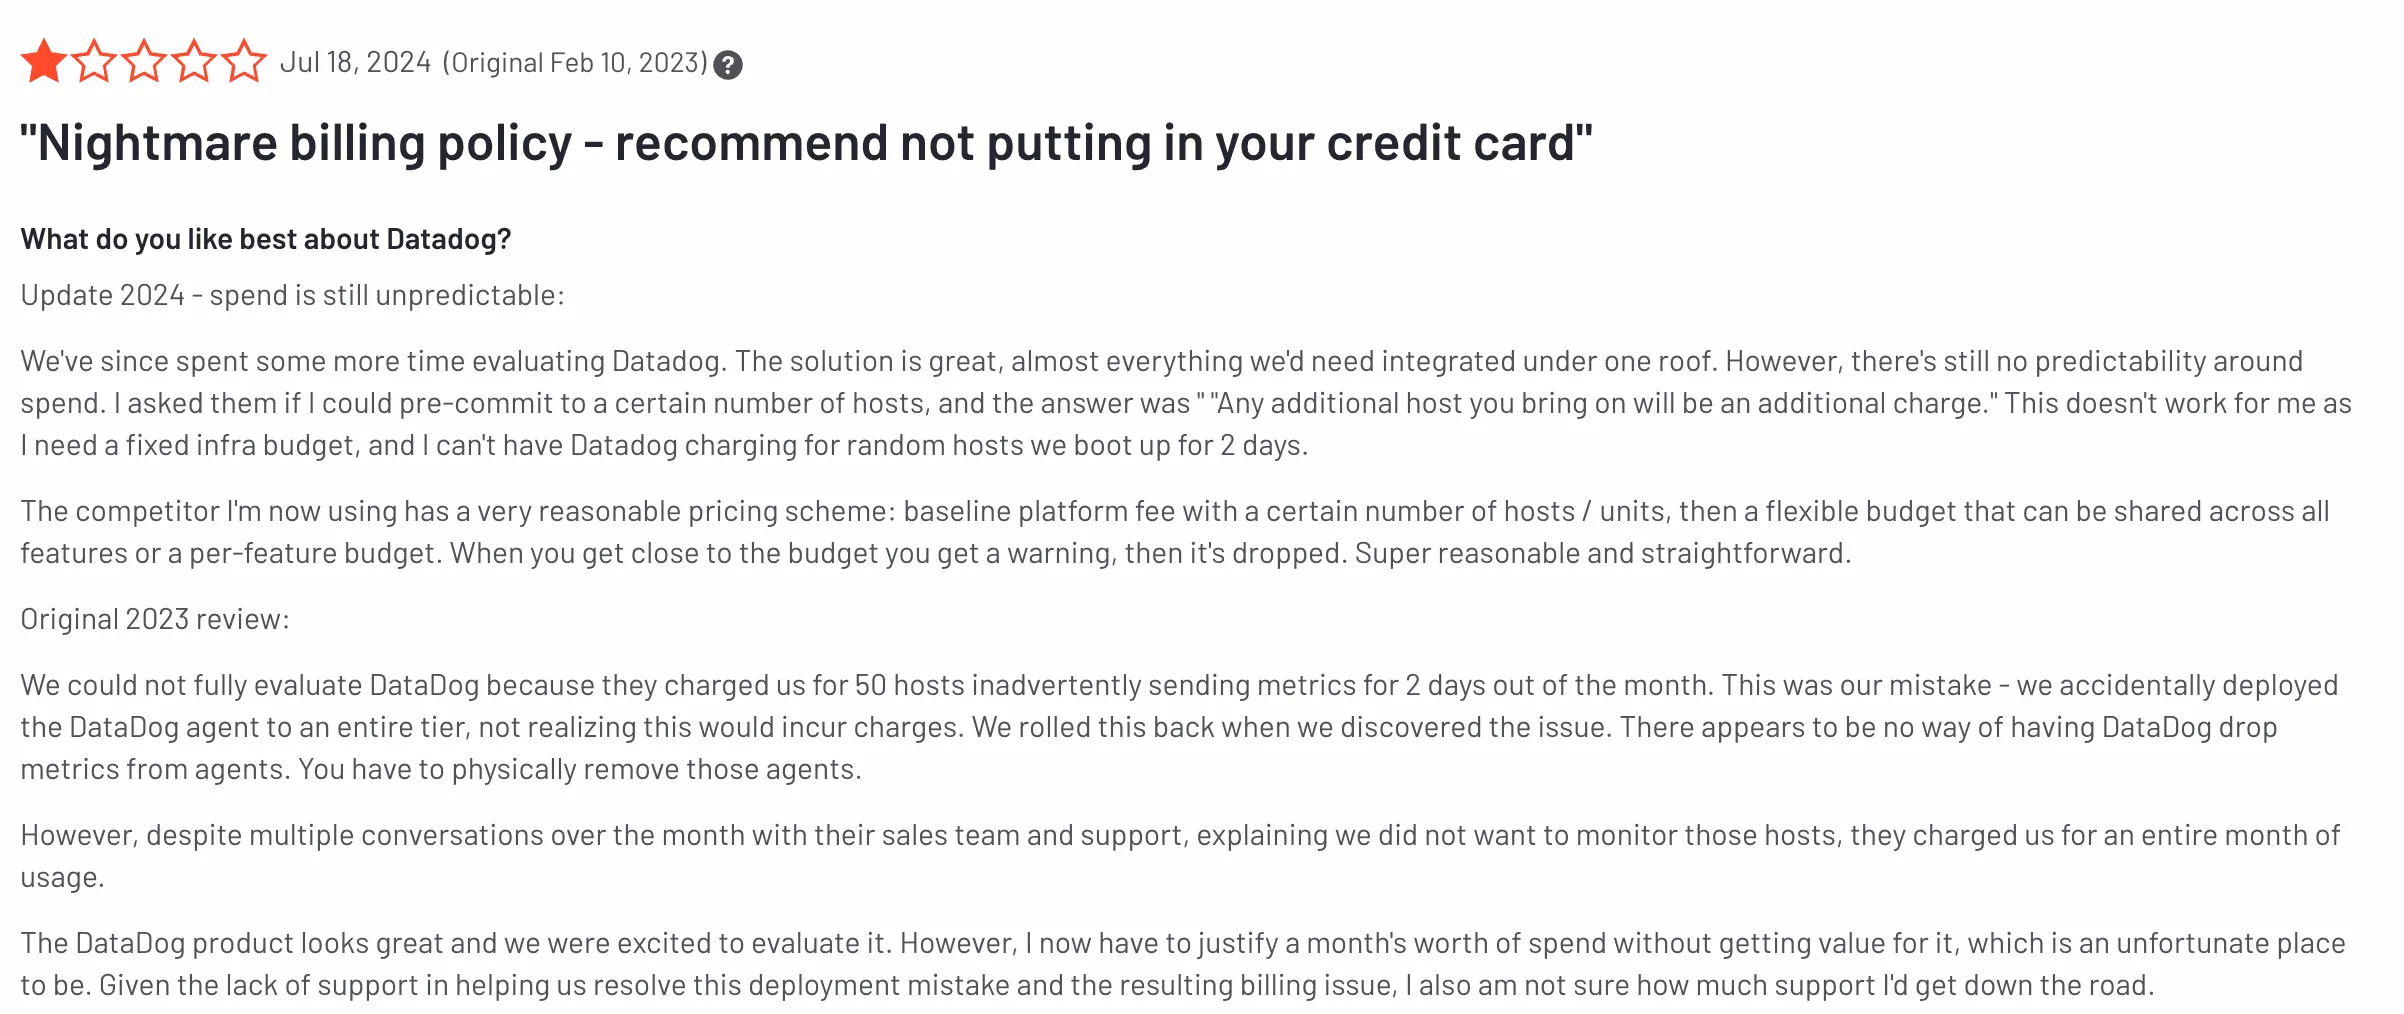
Teams replace or supplement Datadog when the cost grows faster than the usage behind it. The bill is the usual trigger: every custom metric, indexed log, and monitored host is its own line item, so the total climbs faster than headcount or traffic does. A good alternative cuts that risk without making you re-instrument everything.
Datadog itself is capable, with broad integrations, real-time monitoring, and end-to-end visibility across your stack. The friction shows up in three places:
- Pricing: per-host, per-metric, and ingestion charges stack up fast at scale.
- Complexity: smaller teams find the surface area hard to navigate.
- Forecasting: custom metrics and log volume make the monthly bill hard to predict. For a full breakdown, see our guide to Datadog pricing.
If any of those sound familiar, here is how the leading alternatives compare.
| Tool | Type | Best for | Pricing | Watch out for |
|---|---|---|---|---|
| Last9 | SaaS | High-cardinality metrics, logs, traces; Prometheus/OTel | Usage-based | Built for engineering-led teams with modern telemetry volume |
| Grafana Cloud | SaaS | Managed Prometheus, Loki, Tempo | Usage tiers | Cost and complexity grow with multi-signal usage |
| SigNoz | OSS / SaaS | OpenTelemetry-native APM and tracing | Free self-host or cloud | Operational burden if self-hosted |
| New Relic | SaaS | Full-stack APM with a free tier | Per user + ingest | Pricing still tracks ingest and seat count |
| Dynatrace | SaaS / Managed | Enterprise automation, root-cause AI | Per GiB ingested | Enterprise cost and complexity |
| Splunk | SaaS / On-prem | Log analytics at scale | Per GB ingested | Costly at high telemetry volume |
| Elastic Observability | SaaS / Self-managed | Elasticsearch-based logs and search | Resource / tiers | Requires Elastic operational knowledge |
| Prometheus + Grafana | OSS | Self-hosted Kubernetes metrics | Free (self-hosted) | You own scale, retention, and reliability |
9 Best Datadog Alternatives and Competitors
1. Last9
Last9 is an OTLP-native observability platform for metrics, logs, and traces, built for teams whose telemetry has outgrown host-based pricing. It speaks Prometheus and OpenTelemetry directly: point your existing exporters or the Datadog Agent at it, keep PromQL and your dashboards, and control cost at ingestion instead of after the bill arrives.
Choose Last9 over Datadog when:
- You need high-cardinality metrics without treating every useful label as a cost risk.
- You already use Prometheus, PromQL, OpenTelemetry, or Grafana.
- You want metrics, logs, and traces correlated under usage-based pricing, not per-host tiers.
- You want a telemetry control plane to drop, route, remap, aggregate, and retain data on purpose.
- You want to trial migration with Datadog Agent dual shipping before you commit.
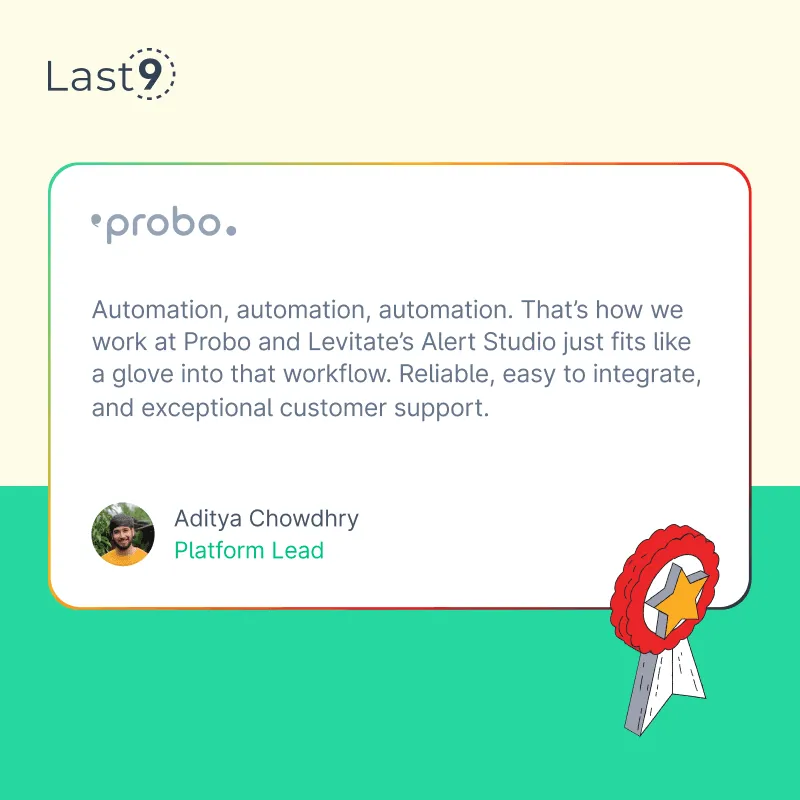
Last9 is strongest for engineering-led teams running high-scale, cloud-native systems where cardinality and ingestion volume drive the bill. Weighing the open-standard path? See OpenTelemetry vs Datadog. On the cost side, Probo cut its monitoring spend by about 90 percent after moving high-cardinality workloads to Last9.
2. Grafana Cloud and Prometheus
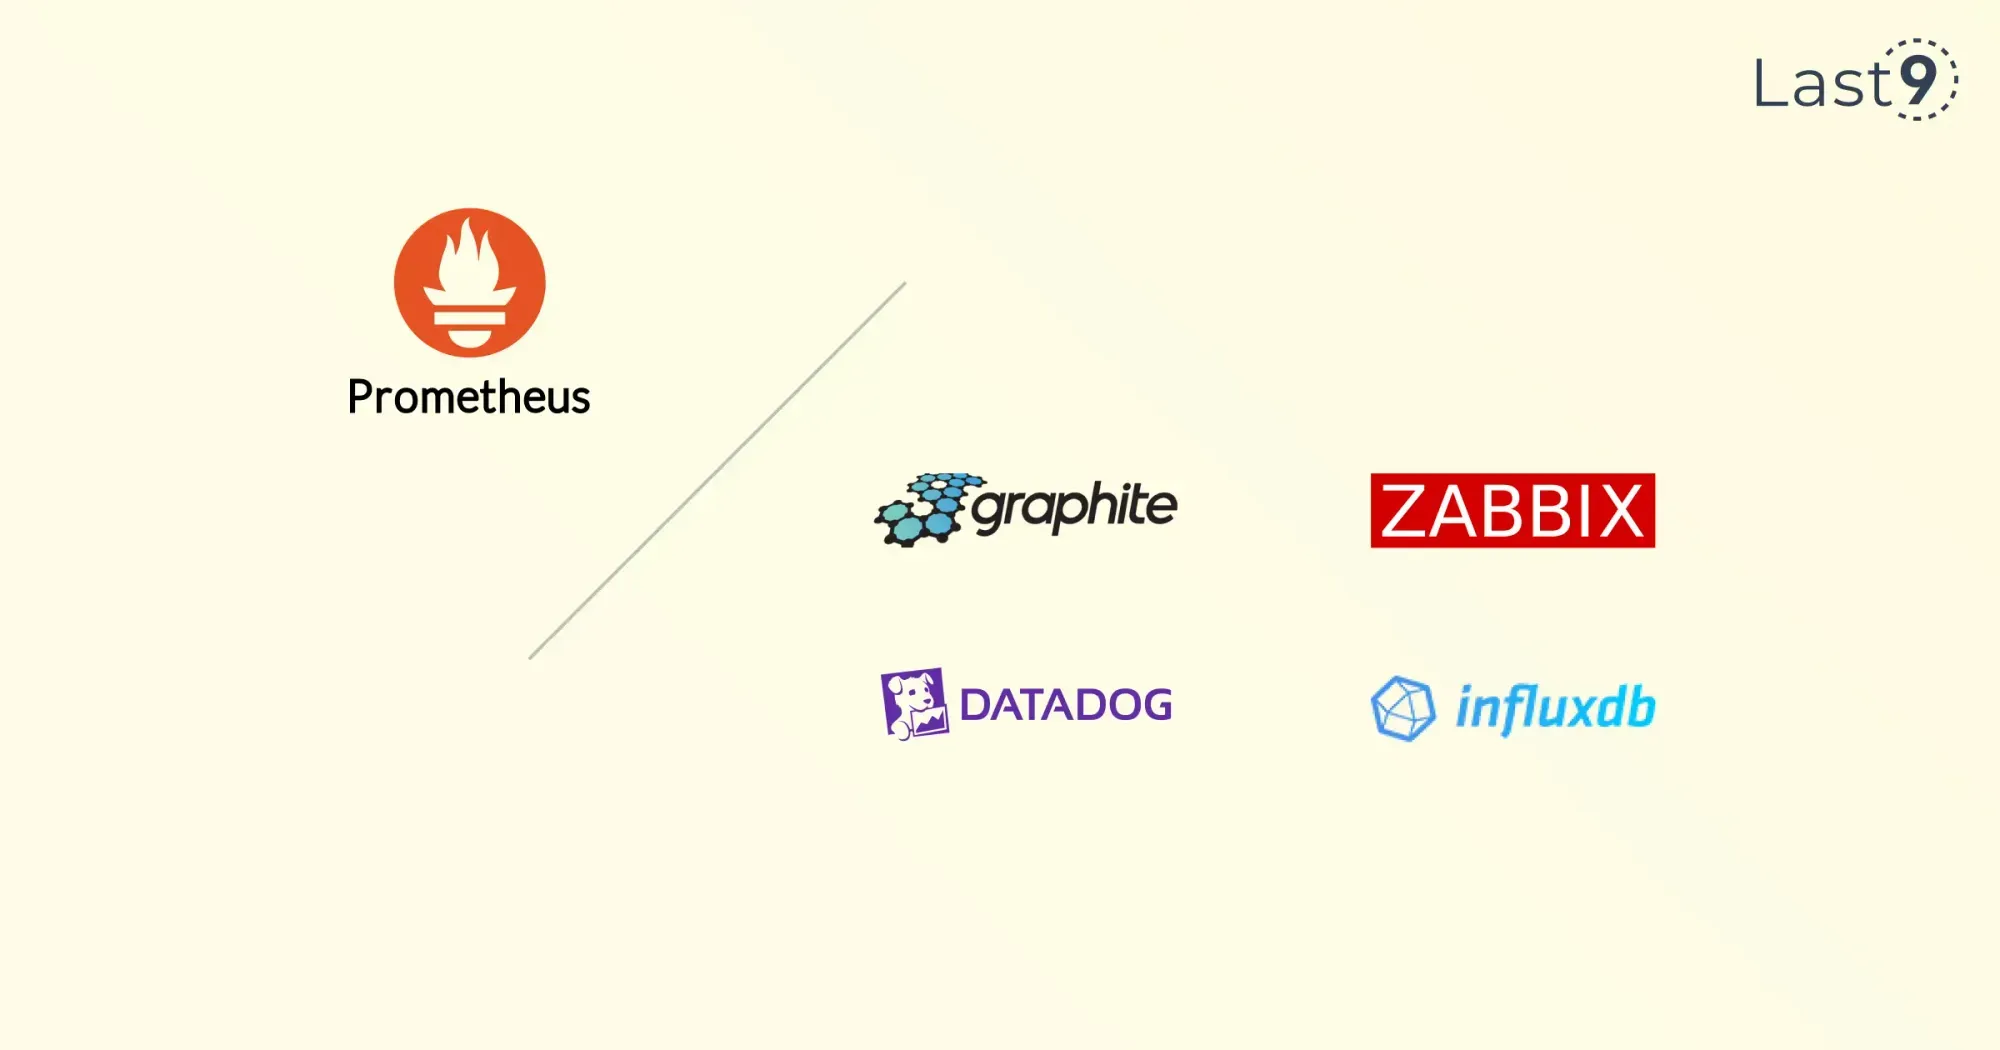
Grafana Cloud is the managed version of the open-source Grafana stack: Prometheus-compatible metrics, Loki for logs, and Tempo for traces, all behind Grafana dashboards. Self-hosting Prometheus and Grafana keeps the same workflow at zero license cost, in exchange for running scale, retention, and reliability yourself. For the head-to-head detail, see Datadog vs Grafana and Prometheus vs Datadog.
- Best for: teams that want PromQL and Grafana dashboards without building the backend from scratch.
- Strengths: open standards, a large exporter ecosystem, and best-in-class visualization.
- Watch out for: multi-signal usage (metrics plus logs plus traces) can grow cost and operational complexity quickly.

3. SigNoz
If you want an OpenTelemetry-first stack you can run yourself, SigNoz is the obvious open-source pick. It puts metrics, logs, and traces in one app, ingests OTLP out of the box, and ships APM and trace views without a separate dashboard layer bolted on. The trade-off is the usual one for self-hosted software: you take on storage and scaling, or move to the managed cloud and pay for that work in usage cost instead. Best fit for teams that have already standardized on OpenTelemetry and do not mind operating their own backend.
4. New Relic
New Relic earns its spot on APM depth. Full-stack coverage spans applications, infrastructure, logs, and browser monitoring, and there is a usage-based free tier to start on. Pricing then runs on data ingested and the number of billable users.
- Best for: medium to large teams that want broad APM coverage across many languages.
- Strengths: mature APM, distributed tracing, and a free tier to start.
- Watch out for: cost still tracks ingest volume and user count. See the head-to-head in New Relic vs Datadog.
5. Dynatrace
Dynatrace leans hard on automation. Its OneAgent auto-instruments hosts and services, and the Davis AI engine handles the dependency mapping and root-cause work that a large, distributed estate would otherwise chase by hand. That suits big enterprises that want full-stack coverage without wiring up every signal themselves, and the cost shows up as enterprise pricing and platform complexity. The full breakdown is in Datadog vs Dynatrace.
6. Splunk Observability
Splunk is best known for log management and has grown into a broader observability suite. It handles high-volume log search, real-time streaming, and analytics, and is a common fit where logs and security workflows sit at the center of operations.
- Best for: large enterprises with heavy log volume and analytics needs.
- Strengths: log search at scale, real-time streaming, and a mature ecosystem.
- Watch out for: ingest-based cost climbs with telemetry volume. See Splunk vs Datadog.
7. Elastic Observability
Elastic Observability builds metrics, logs, and APM on top of the Elasticsearch engine. Teams already running the Elastic Stack get observability that reuses the same storage and query layer, with strong full-text search across logs and traces.
- Best for: teams already invested in Elasticsearch who want logs, search, and APM in one place.
- Strengths: powerful log search, flexible deployment, and reuse of existing Elastic skills.
- Watch out for: running Elasticsearch well takes operational expertise; managed tiers shift that to cost.

8. AppDynamics
AppDynamics, part of Cisco, focuses on application performance management with a business-transaction lens. It maps application topology and ties performance to business outcomes, which suits teams that report on revenue-affecting transactions.
- Best for: medium to large enterprises that prioritize business-transaction monitoring.
- Strengths: transaction tracing, topology mapping, and business-impact reporting.
- Watch out for: weighted toward APM rather than open-standard metrics pipelines.
9. LogicMonitor
LogicMonitor is a SaaS infrastructure-monitoring platform with broad out-of-the-box coverage for hybrid and multi-cloud estates. Automated discovery and prebuilt templates make it quick to stand up across mixed infrastructure.
- Best for: mid-size to large teams running hybrid or multi-cloud infrastructure.
- Strengths: automated discovery, AIOps features, and a deep template library.
- Watch out for: infrastructure-first focus means less depth on application-level tracing.
Other Notable Mentions
A few more tools compete with Datadog in narrower lanes:
- OpenObserve: open-source logs, metrics, and traces with a focus on low storage cost.
- Middleware: full-stack cloud-native APM aimed at cost-conscious teams.
- Coralogix: log analytics with index-free querying to control ingest cost.
- Instana: automated APM with strong microservices and container support.
- AWS CloudWatch: native monitoring for workloads running on AWS.
How to Choose the Right Datadog Alternative
Start from the problem, not the brand. If high-cardinality telemetry and cost control are the pain, start with Last9. If you want open-source self-hosting, look at SigNoz or Prometheus with Grafana. If you want managed open source, Grafana Cloud fits. For broad enterprise APM, weigh Dynatrace or New Relic, and for log-heavy estates, Splunk or Elastic.
Most of these tools offer free trials or free tiers, so you can test fit against your own telemetry before switching. The lowest-risk path is to dual ship: send data to a new backend alongside Datadog, compare cost and workflows, then cut over once the numbers hold up.
If unpredictable cost on high-cardinality data is what pushed you to look, that is the exact problem Last9 is built for. You can keep your Prometheus and OpenTelemetry setup, dual ship from the Datadog Agent, and see usage-based pricing before you commit.
FAQs
What is the best Datadog alternative?
The best Datadog alternative depends on the workload. Last9 fits high-cardinality observability with Prometheus and OpenTelemetry compatibility and cost control. Grafana Cloud suits managed open source, SigNoz fits OpenTelemetry-native open-source teams, and New Relic or Dynatrace cover broad enterprise APM.
What is a cheaper alternative to Datadog?
Last9, SigNoz, Grafana Cloud, OpenObserve, and self-hosted Prometheus with Grafana can all cost less than Datadog, depending on telemetry volume and deployment. The biggest savings usually come from controlling high-cardinality metrics, log indexing, and retention before data is ingested.
Is Last9 a Datadog alternative?
Yes. Last9 is a Datadog alternative for teams that need high-cardinality observability across metrics, logs, and traces, especially when they already use Prometheus, PromQL, OpenTelemetry, or Grafana. It also supports Datadog Agent dual shipping for migration and side-by-side evaluation.
Can I migrate from Datadog to Last9?
Yes. Teams typically start by dual shipping telemetry from the Datadog Agent to Last9, or by routing data through the OpenTelemetry Collector or Prometheus remote write. That lets you compare cost and workflows before replacing Datadog broadly.
Is SigNoz a good Datadog alternative?
SigNoz is a good Datadog alternative for teams that want OpenTelemetry-native observability and are comfortable with open-source operations. Last9 is the better fit when high-cardinality scale, Prometheus compatibility, and managed telemetry control matter more than self-hosting.
Which is better, Splunk or Datadog?
Splunk leads on log management and analytics at scale; Datadog offers a more integrated metrics, traces, and APM experience. The choice comes down to whether logs or full-stack observability sit at the center of your work.
Is New Relic better than Datadog?
Both are strong. New Relic started in APM and keeps an edge there with a usage-based free tier; Datadog began in infrastructure monitoring and has broader integrations. Match the tool to whether application performance or infrastructure breadth matters more to your team.
Why do teams switch away from Datadog?
Teams usually switch when pricing becomes hard to forecast as custom metrics, hosts, indexed logs, and APM usage grow. Other drivers include OpenTelemetry standardization, Prometheus workflows, vendor lock-in concerns, and the need for more control over telemetry pipelines.

