
Datadog and Grafana solve different problems. Datadog is a full, managed observability platform: metrics, logs, traces, and APM in one place, priced per host and per usage. Grafana is an open-source visualization layer that sits on top of data sources like Prometheus or Loki, free to self-host or available as managed Grafana Cloud. Choose Datadog when you want an all-in-one tool with little setup; choose Grafana when you want flexible, low-cost dashboards on data you already collect.
This guide compares Datadog and Grafana on functionality, pricing, integrations, scale, and support, and shows where a platform like Last9 fits if you want Datadog-style coverage without per-host pricing.
What is Datadog?
Datadog is a cloud-based monitoring and analytics platform designed to provide full insights into application performance, infrastructure health, and log management.
With a strong set of features, Datadog is favored by enterprises for its ability to monitor various aspects of modern IT environments. Its application performance monitoring (APM) capabilities allow teams to track application metrics, analyze performance, and troubleshoot issues in real time.

Datadog Alternatives
Key Features of Datadog
- Real-Time Monitoring: Datadog provides real-time insights into your applications and infrastructure, helping teams respond swiftly to potential issues.
- Unified Dashboards: Users can create customizable dashboards that aggregate data from various sources, providing a full view of system health.
- Log Management: With powerful log management features, Datadog enables teams to collect, analyze, and visualize log data efficiently.
- Integrations: Datadog supports integrations with over 450 technologies, including cloud providers like AWS, and Azure, and platforms such as Docker and Kubernetes.
What is Grafana?
Grafana is an open-source data visualization and monitoring platform that specializes in creating visually appealing and informative dashboards.
It supports a wide range of data sources, including time-series databases like Prometheus and InfluxDB, making it a popular choice among DevOps teams looking for flexibility in their monitoring solutions.
Key Features of Grafana
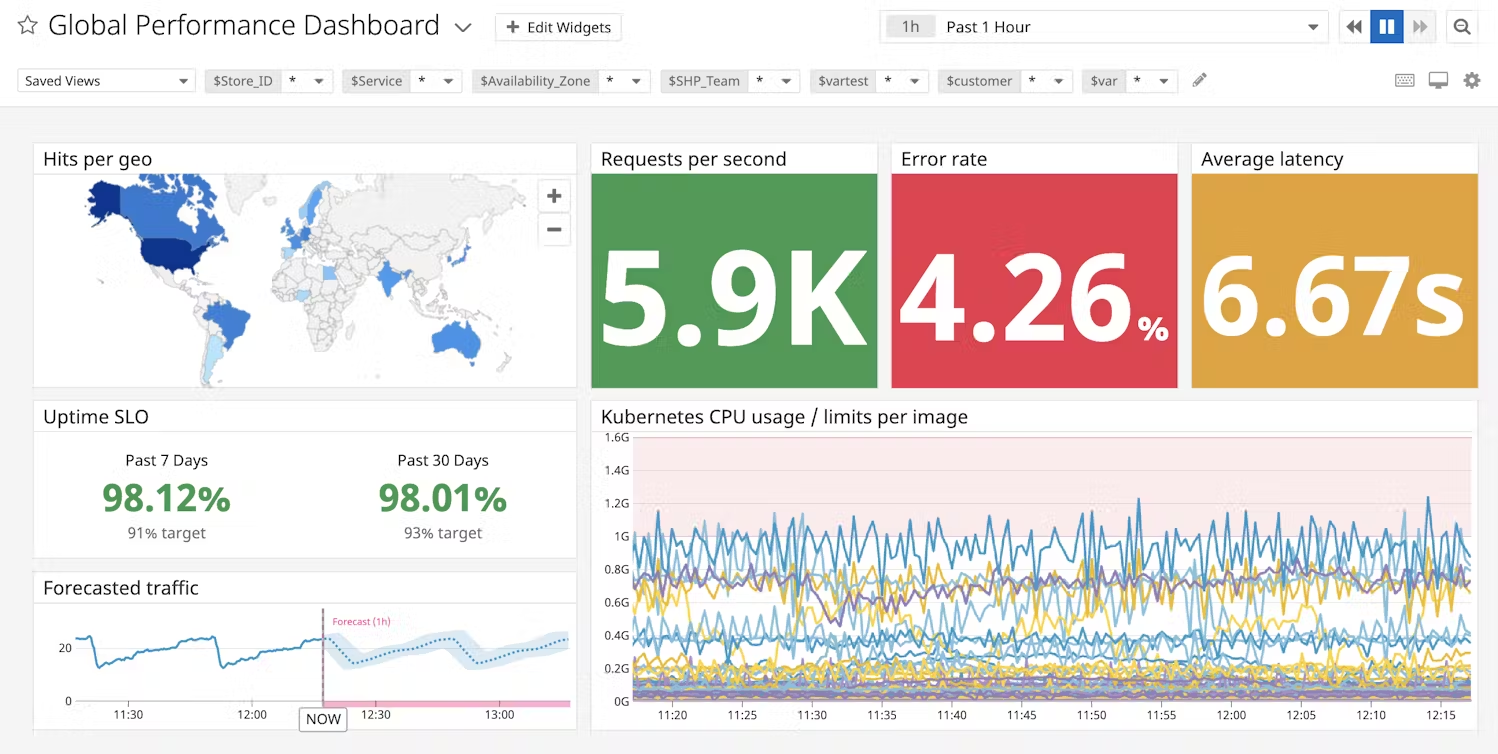
- Custom Dashboards: Grafana allows users to build highly customizable dashboards tailored to specific monitoring needs, enabling deep insights into system performance.
- Data Source Flexibility: It supports multiple data sources, allowing users to visualize data from different backends in a single dashboard.
- Alerts and Notifications: Grafana enables users to set up alerts and notifications based on thresholds, ensuring that critical issues are promptly addressed.
- Community and Plugins: With a vibrant community and a wide array of plugins, Grafana continually evolves, adding new functionalities and integrations.
Prometheus Alternatives
Key Differences Between Datadog and Grafana
| Dimension | Datadog | Grafana |
|---|---|---|
| Type | All-in-one SaaS observability platform | Open-source visualization layer (needs a data source) |
| Signals | Metrics, logs, traces, and APM in one platform | Visualizes data from Prometheus, Loki, InfluxDB, and more |
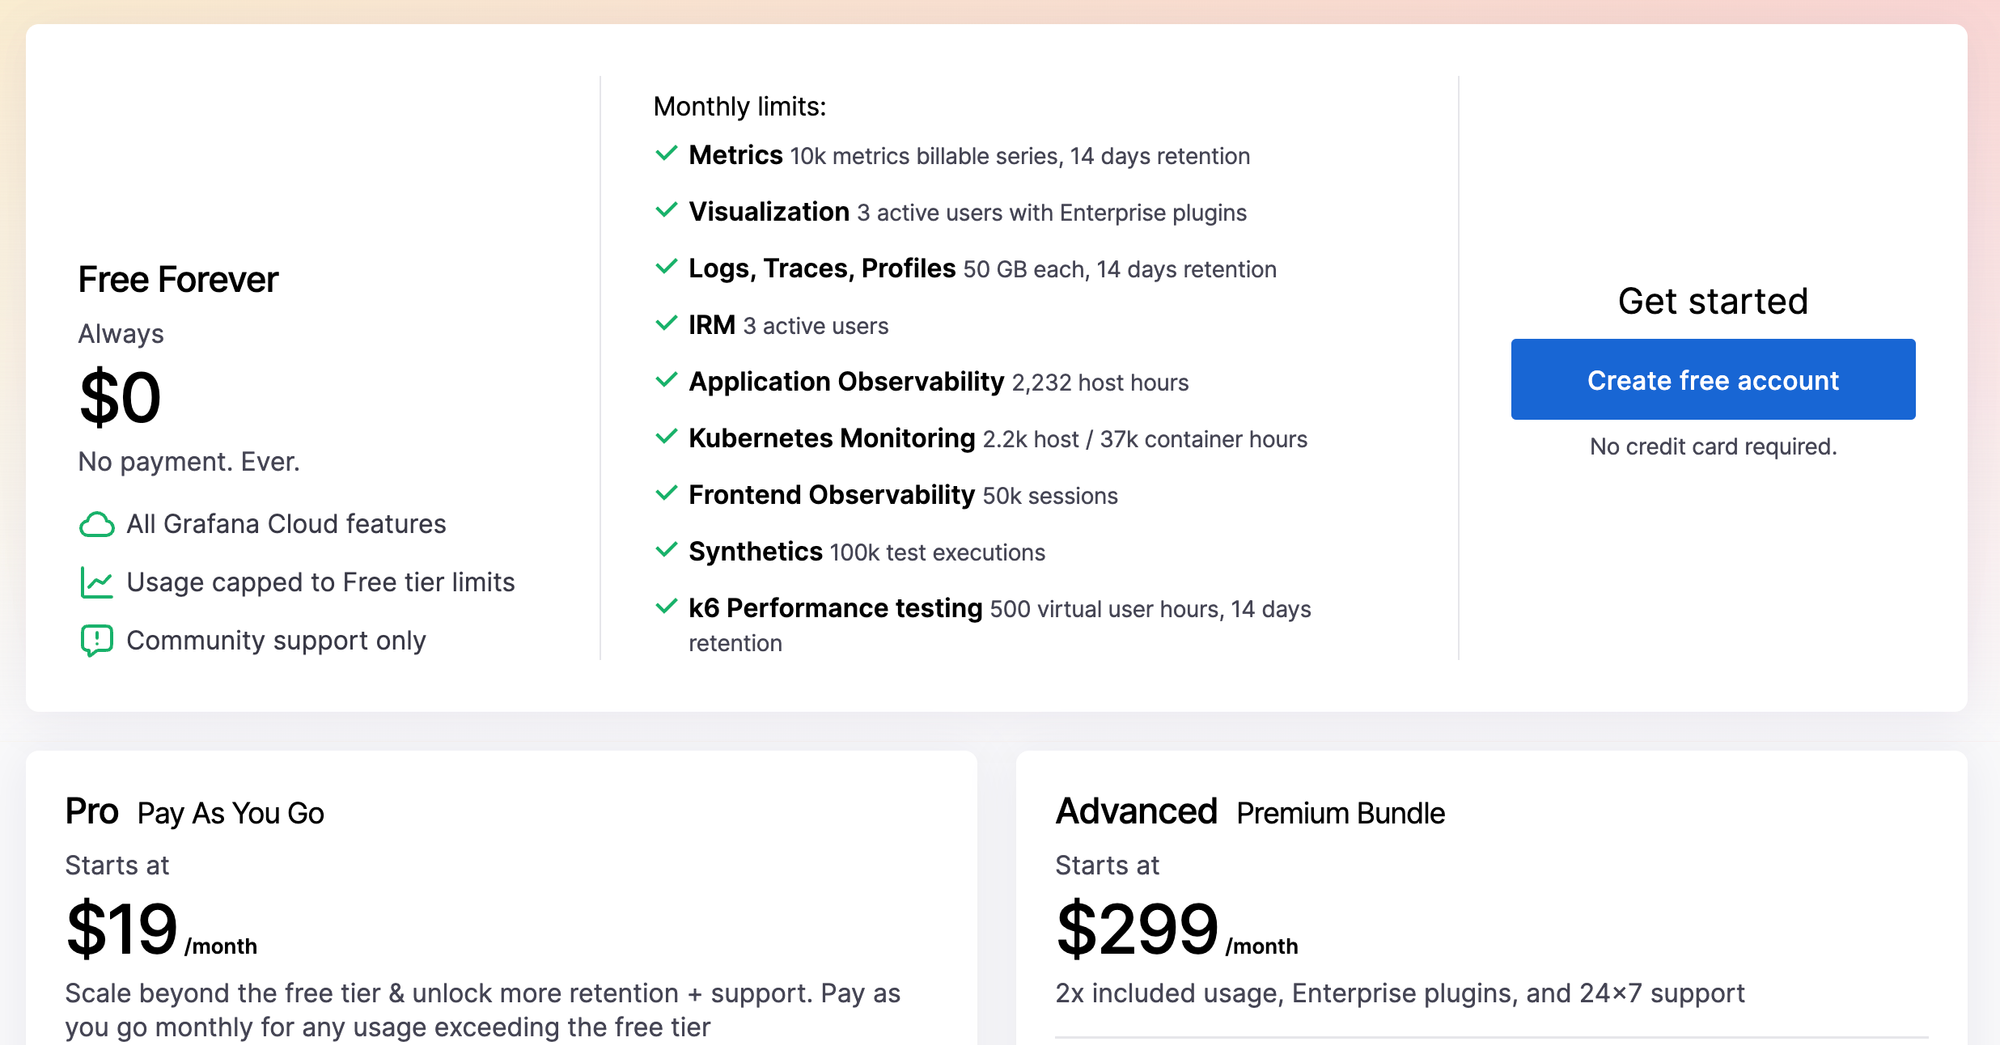
| Pricing | Per host and usage (from $15/host/mo infrastructure, $31 APM) | Free self-hosted; Grafana Cloud is usage-tiered |
| Setup | Minimal, fully managed | More setup; depends on the backends you connect |
| Scaling | Managed, scales with your infrastructure | Scales with the underlying data source |
| Best for | Teams wanting full coverage with little setup | Teams wanting low-cost, flexible dashboards on their own data |
Functionality
Datadog:
Offers a full monitoring solution that combines APM, log management, and infrastructure monitoring in a single platform.
Its strength in delivering real-time insights into application behavior makes it a go-to choice for organizations that prioritize broad visibility, though that level of coverage comes with a premium price tag.
Grafana:
While Grafana shines in data visualization, it’s designed to work alongside other tools for data collection and monitoring. It's best utilized in combination with solutions like Prometheus or Last9 to gather data, allowing users to create highly customizable dashboards for a tailored visual experience. If you are weighing the open-source path, see Prometheus vs Datadog.
Pricing
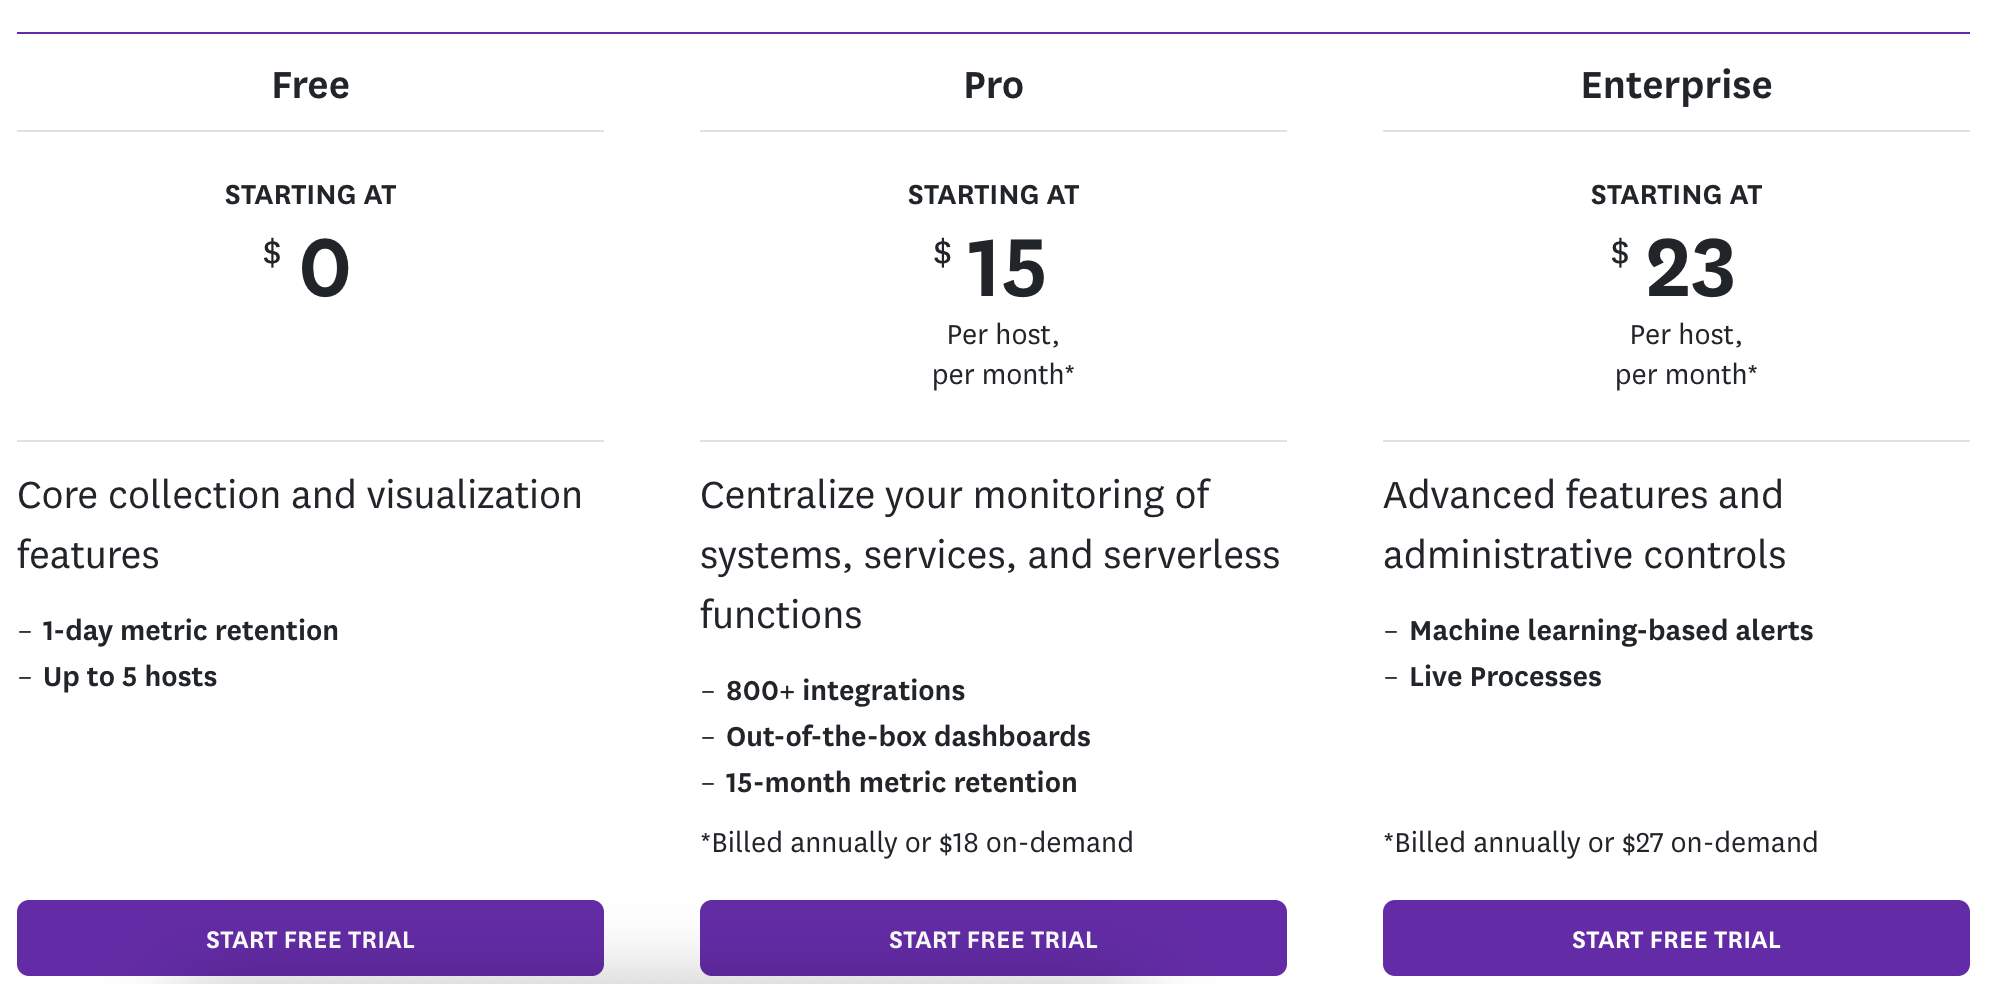
Datadog:
Operates on a subscription-based pricing model, with costs varying based on the number of hosts, containers, or custom metrics. As your infrastructure grows, this can lead to higher expenses, making budgeting a bit tricky for organizations anticipating growth, especially when dealing with high cardinality metrics. For the full breakdown, see our Datadog pricing guide.
Grafana:
Generally offers a more cost-effective solution, particularly with its open-source version. Grafana Cloud provides a tiered pricing model designed to accommodate a range of budgets, making it an attractive option for both startups and established enterprises.
Integrations
Datadog:
Provides extensive integration capabilities, allowing users to connect with numerous cloud services and on-premises tools smoothly. This is beneficial for organizations looking to centralize their monitoring efforts.
Grafana:
Known for its ability to integrate with various data sources, Grafana excels in providing flexibility. Users can visualize data from different backends, making it suitable for environments where diverse monitoring tools are used.
User Experience
Datadog:
Offers a polished, user-friendly interface that is easy to navigate, making it suitable for teams that need to set up monitoring quickly.
Grafana:
While offering powerful customization options, Grafana may require more initial setup and configuration. This can be a barrier for teams without dedicated resources to invest in dashboard creation.

Observability vs Telemetry vs Monitoring
Use Cases
Datadog:
Best suited for organizations that require a full monitoring solution without pricing constraints, Datadog encompasses application performance monitoring, log management, and infrastructure insights.
Its advanced APM capabilities make it an excellent choice for development teams dedicated to optimizing application performance and ensuring smooth user experiences.
Grafana:
Excels in environments that prioritize data visualization while also requiring solid monitoring capabilities. Grafana is especially beneficial for DevOps teams utilizing tools like Prometheus and Elasticsearch, as it offers highly customizable dashboards that enhance data interpretation and insights.
Scalability
One of the key considerations when selecting a monitoring tool is scalability. As organizations grow, their monitoring needs often evolve.
Datadog:
Its cloud-based architecture allows for smooth scaling, making it suitable for enterprises with dynamic infrastructure. Datadog can handle increased workloads without compromising performance.
Grafana:
While Grafana itself is highly scalable, its performance largely depends on the underlying data sources. When integrated with powerful data collection tools like Prometheus or InfluxDB, Grafana can effectively scale alongside your infrastructure.
Community and Support
Community and support can significantly impact the user experience when working with monitoring tools.
Datadog:
Offers dedicated support for its users, including documentation, tutorials, and customer service. This is key for organizations that may require assistance in setting up or troubleshooting the platform.
Grafana:
Being an open-source tool, Grafana has a vibrant community that contributes to its development. Users can access forums, GitHub repositories, and community resources to seek help and share knowledge. Additionally, Grafana Labs offers enterprise support for organizations that require more structured assistance.
Conclusion
In the debate of Datadog vs. Grafana, organizations must consider their unique needs. Ultimately, the choice hinges on whether you prioritize an all-in-one platform or a flexible visualization tool tailored to your existing infrastructure.
If you’re seeking an observability and monitoring solution that encompasses all the features of Datadog without the hefty price tag, Last9 is the answer you’ve been looking for.
Our approach to observability starts with the fundamental principle that effective monitoring begins with the collection and storage of telemetry data. We see Last9 as a telemetry warehouse, effortlessly integrating metrics, traces, and logs into a single platform for your convenience.
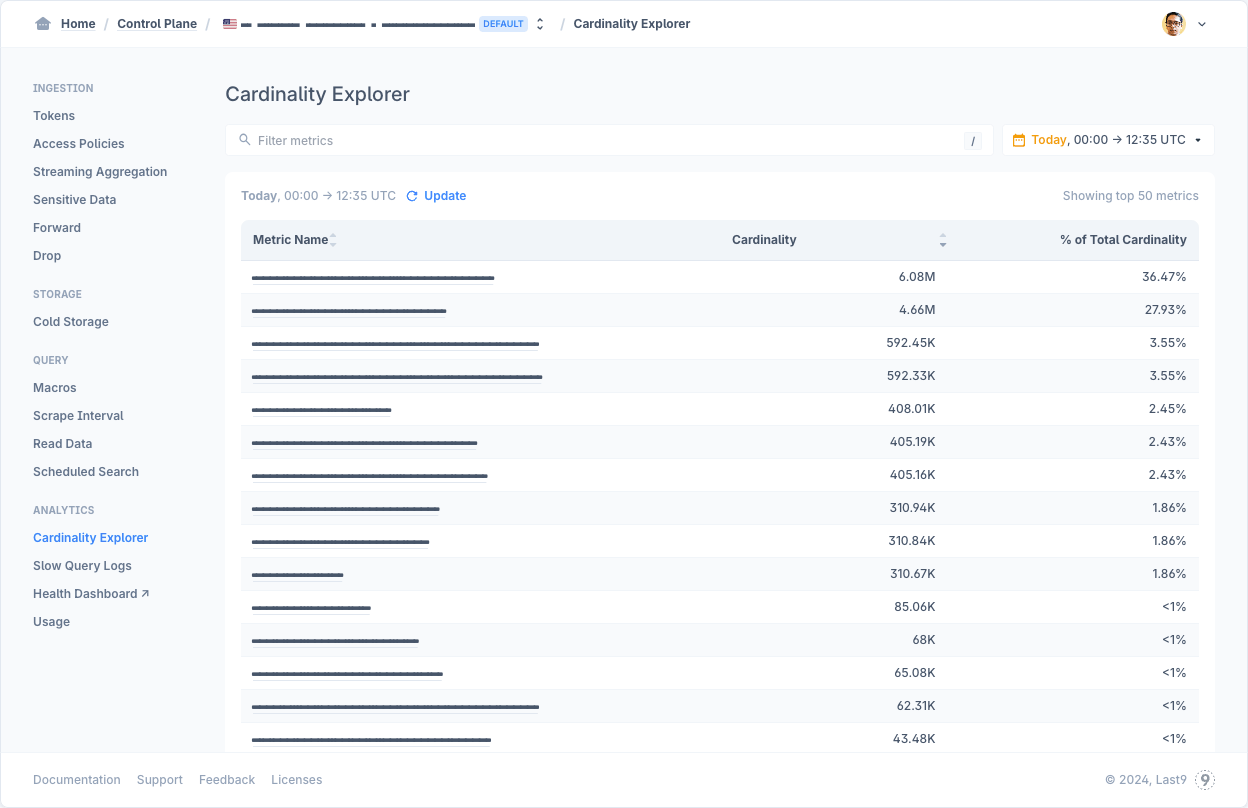
And if high cardinality is a concern as your organization grows, we aim to fill the gaps left by other solutions, creating user experiences that help you manage and utilize your telemetry data more effectively.
FAQs
Is Datadog better than Grafana?
It depends on what you need. Datadog is an all-in-one solution, while Grafana shines in flexibility for data visualization and integration.
What is the difference between Datadog and Prometheus?
Datadog is a full monitoring platform, whereas Prometheus is primarily a time-series database focused on monitoring and alerting.
What is the weakness of Datadog?
Some users find Datadog’s pricing model a bit steep, especially as their infrastructure scales.
Why is Datadog the best?
Datadog offers a strong suite of features and can monitor various aspects of IT environments, making it a great choice for enterprises that need extensive observability.
Why use Grafana and Loki to replace Datadog for log analytics?
Using Grafana with Loki can offer a cost-effective and flexible solution for log analytics, especially for teams already using Grafana for monitoring.
How does log management on Datadog work?
Datadog collects and processes logs in real-time, allowing users to monitor, analyze, and visualize log data effectively.
What are the key differences between Datadog and Grafana for monitoring and visualization?
Datadog provides a complete monitoring solution, while Grafana focuses more on visualization and data integration capabilities.
How do Datadog and Grafana integrate for monitoring solutions?
Grafana can be set up to pull data from Datadog, allowing users to visualize Datadog metrics within Grafana dashboards.
Can Grafana be used as an alternative to Datadog for monitoring?
While Grafana can visualize data from various sources, it might not cover all the full monitoring features that Datadog offers.
How does Grafana integrate with Prometheus for monitoring?
Grafana connects to Prometheus as a data source, enabling users to create dashboards that visualize Prometheus metrics.
Can Grafana be used with Datadog as a data source?
Absolutely! Grafana can use Datadog as a data source to visualize metrics collected by Datadog.

