

Observability has become essential for ensuring smooth system operations and swiftly detecting and resolving potential issues. As applications grow in complexity—especially those built using containers and microservices—a robust monitoring solution is more critical than ever.
Research from the Enterprise Strategy Group shows that mastering observability enables developers to release 60% more products than their peers.
Prometheus is a leading open-source time-series database and has become the industry standard for end-to-end monitoring solutions. Time-series databases (TSDBs) like Prometheus are increasingly prevalent, providing valuable metrics that help track and understand application performance.
In this guide, we’ll explore what Prometheus is, its core features, and how it supports monitoring and observability across systems like Kubernetes, Docker, and cloud environments.
We’ll also highlight how Prometheus integrates with tools like Grafana, Alertmanager, and others for a comprehensive monitoring solution.
What is Prometheus Monitoring?
Prometheus is an open-source monitoring system and time-series database that has been designed with reliability, scalability, and ease of use in mind.
It excels at collecting and storing time-series data, which is critical for monitoring dynamic environments like those using containers, microservices, and cloud-native applications.
At its core, Prometheus operates on a pull model, where it scrapes metrics from predefined data sources at regular intervals. These metrics are stored in a dimensional data model using a time-series database that allows for flexible querying and alerting.
Prometheus’ rich query language, PromQL (Prometheus Query Language), enables users to extract valuable insights from this data, making it an ideal tool for developers and DevOps teams looking to monitor the performance of their infrastructure and services in real-time.
Prometheus Architecture
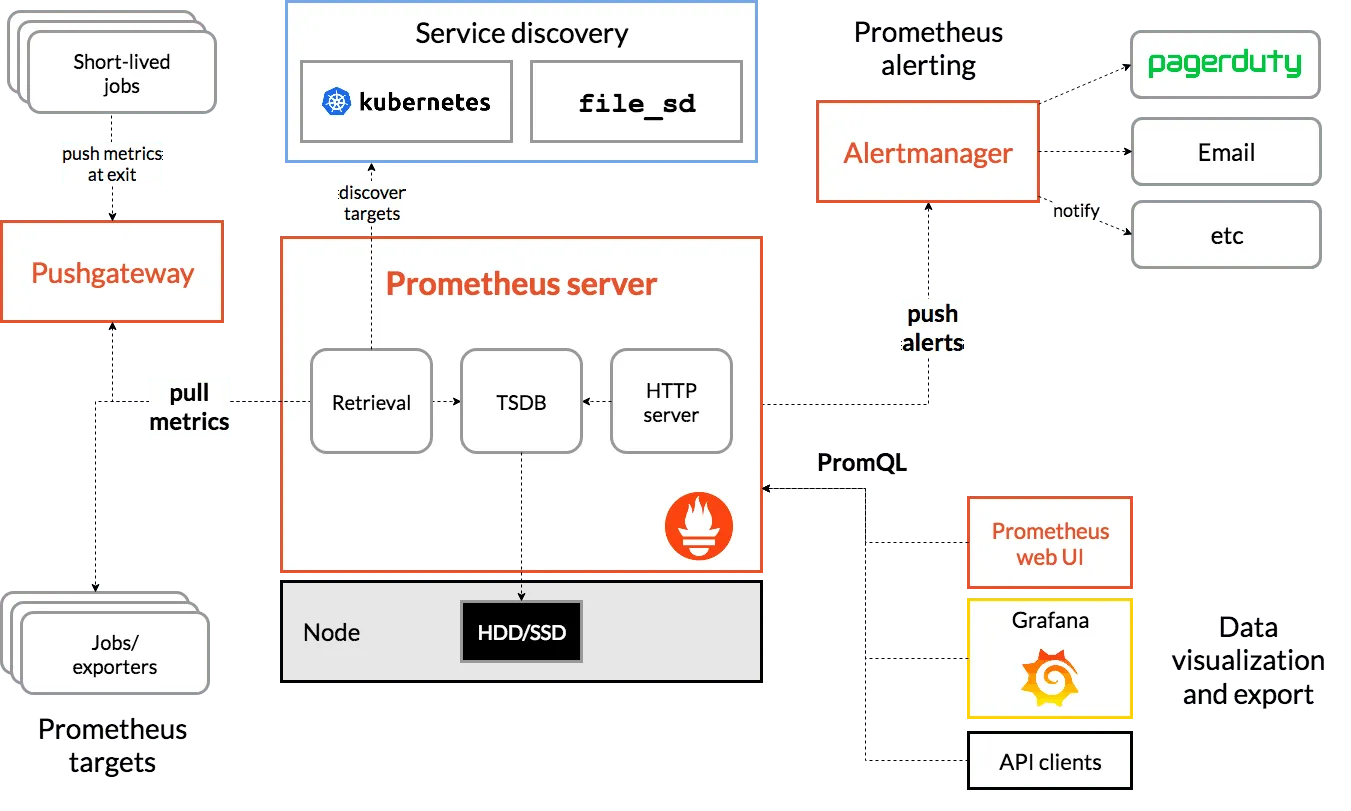
Prometheus tracks and reports a program’s performance by scraping metrics data from one or more targets over HTTP endpoints. This target could be an in-house instrumented application or even a third party.
Prometheus stores the metrics data and examines scraped data using its query language, PromQL. Here is a graphical illustration of the Prometheus architecture:
How Prometheus Works
Prometheus works by scraping metrics at specified intervals from various endpoints, such as those exposed by applications, Kubernetes, Docker containers, or other services. The collected metrics are stored in a time-series database and can be queried using PromQL to extract meaningful insights.
Prometheus also integrates with Alertmanager, which can be configured to send alerts based on the data collected. These alerts can be sent via Slack, email, or other notification channels to keep teams informed of potential issues.
Prometheus also supports remote storage, allowing organizations to store metric data for longer periods, enabling historical analysis and long-term trend tracking.
Key Features of Prometheus Monitoring
Metric Collection and Scraping
One of the core features of Prometheus is its ability to collect metrics through a process known as scraping. Prometheus servers are configured to scrape data from endpoints that expose relevant metrics, such as application performance indicators, resource usage statistics (e.g., CPU, memory, disk), and other system-level data.
This approach allows Prometheus to pull in a wide range of metrics from various sources, including cloud environments like AWS, Linux systems, and Kubernetes clusters.
Scraping is performed at regular intervals, which can be configured to suit the needs of your infrastructure. Prometheus can handle a high volume of metric data efficiently, making it suitable for large-scale deployments.

Prometheus Exporters
Prometheus doesn’t inherently understand how to collect metrics from every possible system or service.
To address this, Prometheus relies on exporters. These are components that expose the data in a format Prometheus can scrape. Exporters are available for a wide variety of services and systems, including Kubernetes, Docker, AWS, and more.
These exporters act as bridges between Prometheus and the system you’re monitoring. For example, the node exporter provides metrics for Linux systems, while the Kubernetes metrics server provides data from Kubernetes clusters. Other exporters include those for databases, web servers, and messaging systems.
Real-Time Data and Alerts
Prometheus excels at monitoring and storing time-series data in real-time. As metrics are collected from the data sources, they can be queried immediately using PromQL to create alerts or visualizations.
Integration with Alertmanager allows Prometheus to send notifications when specific conditions are met, such as when a metric exceeds a threshold. Alerts can be sent via Slack, email, or any other configured notification system.
This real-time monitoring capability is critical for quickly identifying potential issues and taking action before they escalate into more significant problems. Whether you’re monitoring the health of your Kubernetes pods, Docker containers, or AWS resources, Prometheus gives you the tools to respond quickly and prevent downtime.

PromQL (Prometheus Query Language)
PromQL is the query language used by Prometheus to retrieve and manipulate data. For quick reference, see our PromQL cheat sheet stored in its time-series database.
With PromQL, users can build complex queries to aggregate and filter metrics, calculate averages, rates, and other statistical measures, and even generate alerts based on the data.
One of the key strengths of PromQL is its ability to handle a wide range of queries that can span multiple dimensions.
For instance, you can query metrics by metric name, labels, or annotations, enabling you to create highly tailored queries that provide deep insights into the performance of your systems.
Long-Term Storage and Remote Storage
While Prometheus is designed for efficient short-term storage of time-series data, it also supports integration with external systems for long-term storage.
Connecting Prometheus to a remote storage system allows you to store metrics for extended periods, making it easier to perform historical analysis and meet compliance requirements.
Prometheus also offers retention policies, which define how long data is kept before it’s deleted or moved to long-term storage. This feature is particularly useful for organizations that need to retain large amounts of metric data but don’t want to overwhelm their primary Prometheus server with excessive data.

Grafana Integration
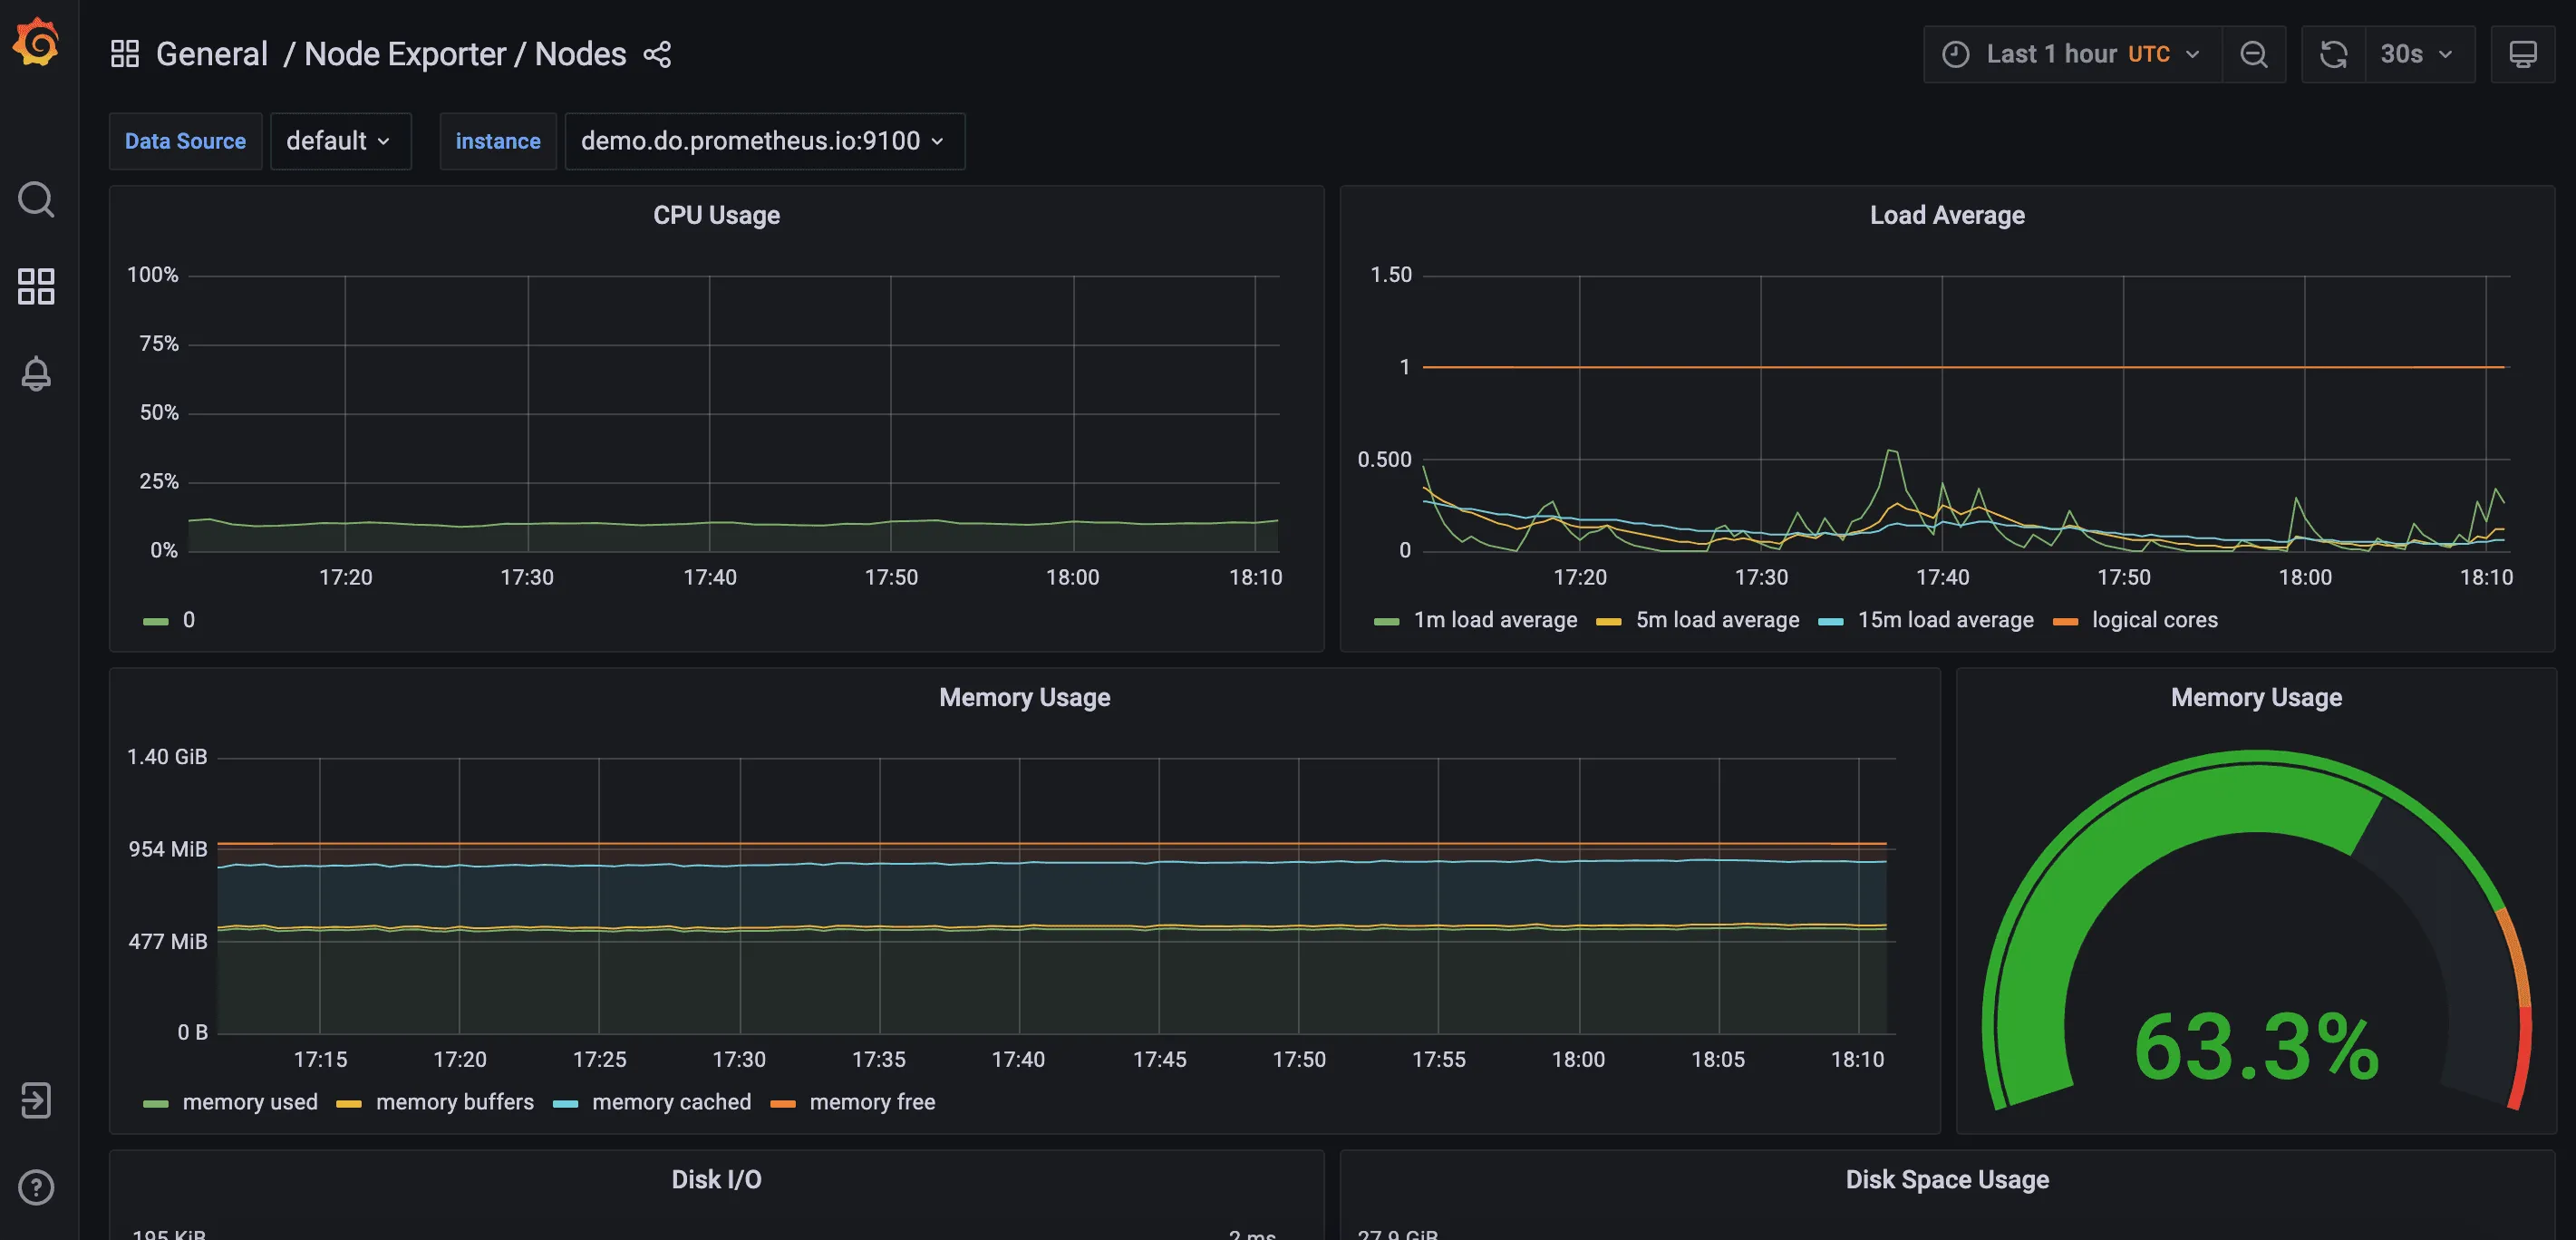
While Prometheus provides the backend for collecting and storing metrics, Grafana is often used as the frontend for data visualization.
Grafana allows you to create powerful dashboards and graphs that visualize the metrics stored in Prometheus. This integration is one of the key reasons why Prometheus and Grafana are commonly used together in observability setups.

With Grafana, you can monitor real-time data, visualize trends over time, and drill down into specific metrics to gain a better understanding of system performance. Grafana’s rich ecosystem of pre-built templates makes it easy to get started, and you can customize dashboards to suit your unique monitoring needs.
Scalability and High Availability
Prometheus is designed to scale horizontally, making it suitable for large environments. It can handle thousands of targets and millions of data points efficiently.
For high availability, Prometheus can be set up with multiple instances, ensuring that monitoring continues even in the event of a failure.
Additionally, Prometheus integrates with Kubernetes, which allows for dynamic service discovery and the ability to monitor Kubernetes workloads that may change frequently. This dynamic nature of Prometheus ensures that your monitoring solution can adapt to your infrastructure as it evolves.
Prometheus and Cloud Native Computing Foundation (CNCF)
Prometheus is a core part of the Cloud Native Computing Foundation (CNCF), which focuses on advancing the adoption of cloud-native technologies.
Prometheus is widely used by cloud-native applications and workloads, making it an integral tool for organizations that adopt CNCF’s standards.
With its instrumentation capabilities and integration with Kubernetes, Prometheus helps companies monitor their cloud-native infrastructures at scale.
Use Cases for Prometheus Monitoring
Prometheus is an ideal monitoring solution for a variety of use cases, including:
- Kubernetes Monitoring: With Prometheus, you can track the performance and health of Kubernetes clusters, services, pods, and nodes. Metrics from Kubernetes are critical for understanding the behavior of your applications running in containers.
- Cloud Monitoring: Prometheus can collect metrics from cloud platforms like AWS, providing visibility into the performance of virtual machines, databases, and other resources.
- Container Monitoring: Prometheus is widely used to monitor Docker containers, providing insights into container resource usage and performance.
- Infrastructure Monitoring: Prometheus can be used to monitor the health and performance of your backend infrastructure, such as servers, storage devices, and network equipment.
- Service Monitoring: Use Prometheus to monitor the health of microservices and APIs, ensuring that your distributed systems are running optimally.
Prometheus Metrics Types
Prometheus is designed to handle a wide range of metrics, making it incredibly versatile for monitoring different types of systems.
Prometheus categorizes metrics into four main types, each serving a different purpose in the monitoring and observability landscape.
Here’s an overview of each:
1. Counter
A counter is the simplest type of metric in Prometheus. It represents a cumulative value that only increases over time. It is typically used to track events, such as the number of requests served, errors that occurred, or jobs completed.
Once a counter is incremented, it cannot be decremented, making it ideal for counting things like requests or errors that happen once and do not revert.
Example use cases:
- Counting the number of HTTP requests handled by a web server.
- Tracking the number of successful or failed login attempts.
Prometheus tracks the rate of change in a counter by using it in a rate function to compute the number of occurrences per second within a given time range. This is helpful when calculating metrics such as the request rate or error rate.
2. Gauge
A gauge represents a value that can go up or down over time. Unlike a counter, a gauge is not strictly cumulative, and its value can increase, decrease, or remain the same.
Gauges are used for tracking values that can fluctuate, such as temperature, memory usage, or the current number of active connections to a service.
Example use cases:
- Monitoring the current CPU usage of a system.
- Tracking memory or disk space utilization.
- Measuring the number of active users in an application at any given time.
Since gauges can increase or decrease, they are perfect for capturing real-time system state or resource consumption metrics.

3. Histogram
A histogram is used to capture the distribution of data across a set of predefined buckets. This metric type allows Prometheus to collect and store a series of observations, such as request durations or response sizes, and categorize them into buckets based on the values.
Histograms are particularly useful when you need to understand the frequency of various ranges of a metric, like how long HTTP requests take or how large file uploads are.
A histogram records the number of observations in each bucket, as well as the total sum of all observed values. This can later be used to calculate percentages or compute statistical metrics like the median, quantiles, and averages.
Example use cases:
- Measuring the latency of HTTP requests and breaking them down by time intervals (e.g., how many requests took less than 100ms, 200ms, etc.).
- Recording the size of messages or responses to understand the distribution of their sizes.
Histograms are powerful for analyzing the distribution of performance metrics and identifying bottlenecks in your systems.
4. Summary
A summary is similar to a histogram, but instead of using buckets, it tracks the quantiles of a set of observations. Summaries are useful for calculating high-percentile values, such as the 99th percentile latency or response time, which can be more insightful than averages when it comes to measuring performance in distributed systems.
Like histograms, summaries also track the total sum and count of observations. However, the key difference is that a summary allows you to calculate specific percentiles over a configurable time period, making it particularly useful for tracking tail latencies.
Example use cases:
- Calculating high-percentile response times, such as the 95th or 99th percentile of HTTP request durations.
- Measuring the distribution of task completion times in an application or job queue.
Since summaries focus on quantiles, they are an excellent choice when you need to track and alert on performance outliers that affect user experience or system performance.

Choosing the Right Metric Type
Selecting the appropriate metric type is essential for accurate monitoring and observability. In general:
- Use a counter for metrics that only increase, like request counts or job completions.
- Use a gauge for metrics that can fluctuate, such as temperature, memory usage, or active connections.
- Use a histogram when you need to record the distribution of a metric over a range of values, such as request latency or message sizes.
- Use a summary when you need to calculate high-percentile values or track quantiles, such as latency or response time percentiles.
Kubernetes monitoring using Prometheus
For Kubernetes-based systems, you can use the Prometheus operator. It allows dynamic service discovery of services in k8s env based on metadata config of pods, services, etc.
The purpose of this project is to simplify and automate the configuration of a Prometheus-based monitoring stack for Kubernetes clusters.
Prometheus alerting
The Prometheus server transmits alerts to the Alertmanager. The alert manager takes care of deduplication, grouping, inhibition, quiet, and forwarding alerts to the appropriate recipient.
The Prometheus server periodically examines PromQL phrases known as alerting rules. When a user-defined alerting rule triggers an alert scenario, the Prometheus server delivers alerts.
Alertmanager can route the alerts to the proper notification channels, such as email, or third-party alerting applications such as PagerDuty, Slack, or OpsGenie. Recently support was also added for modern destinations such as Discord.

In-built Visualization
Prometheus has an expression browser where you can input any query and view the results in a table or a simulation of graphs.
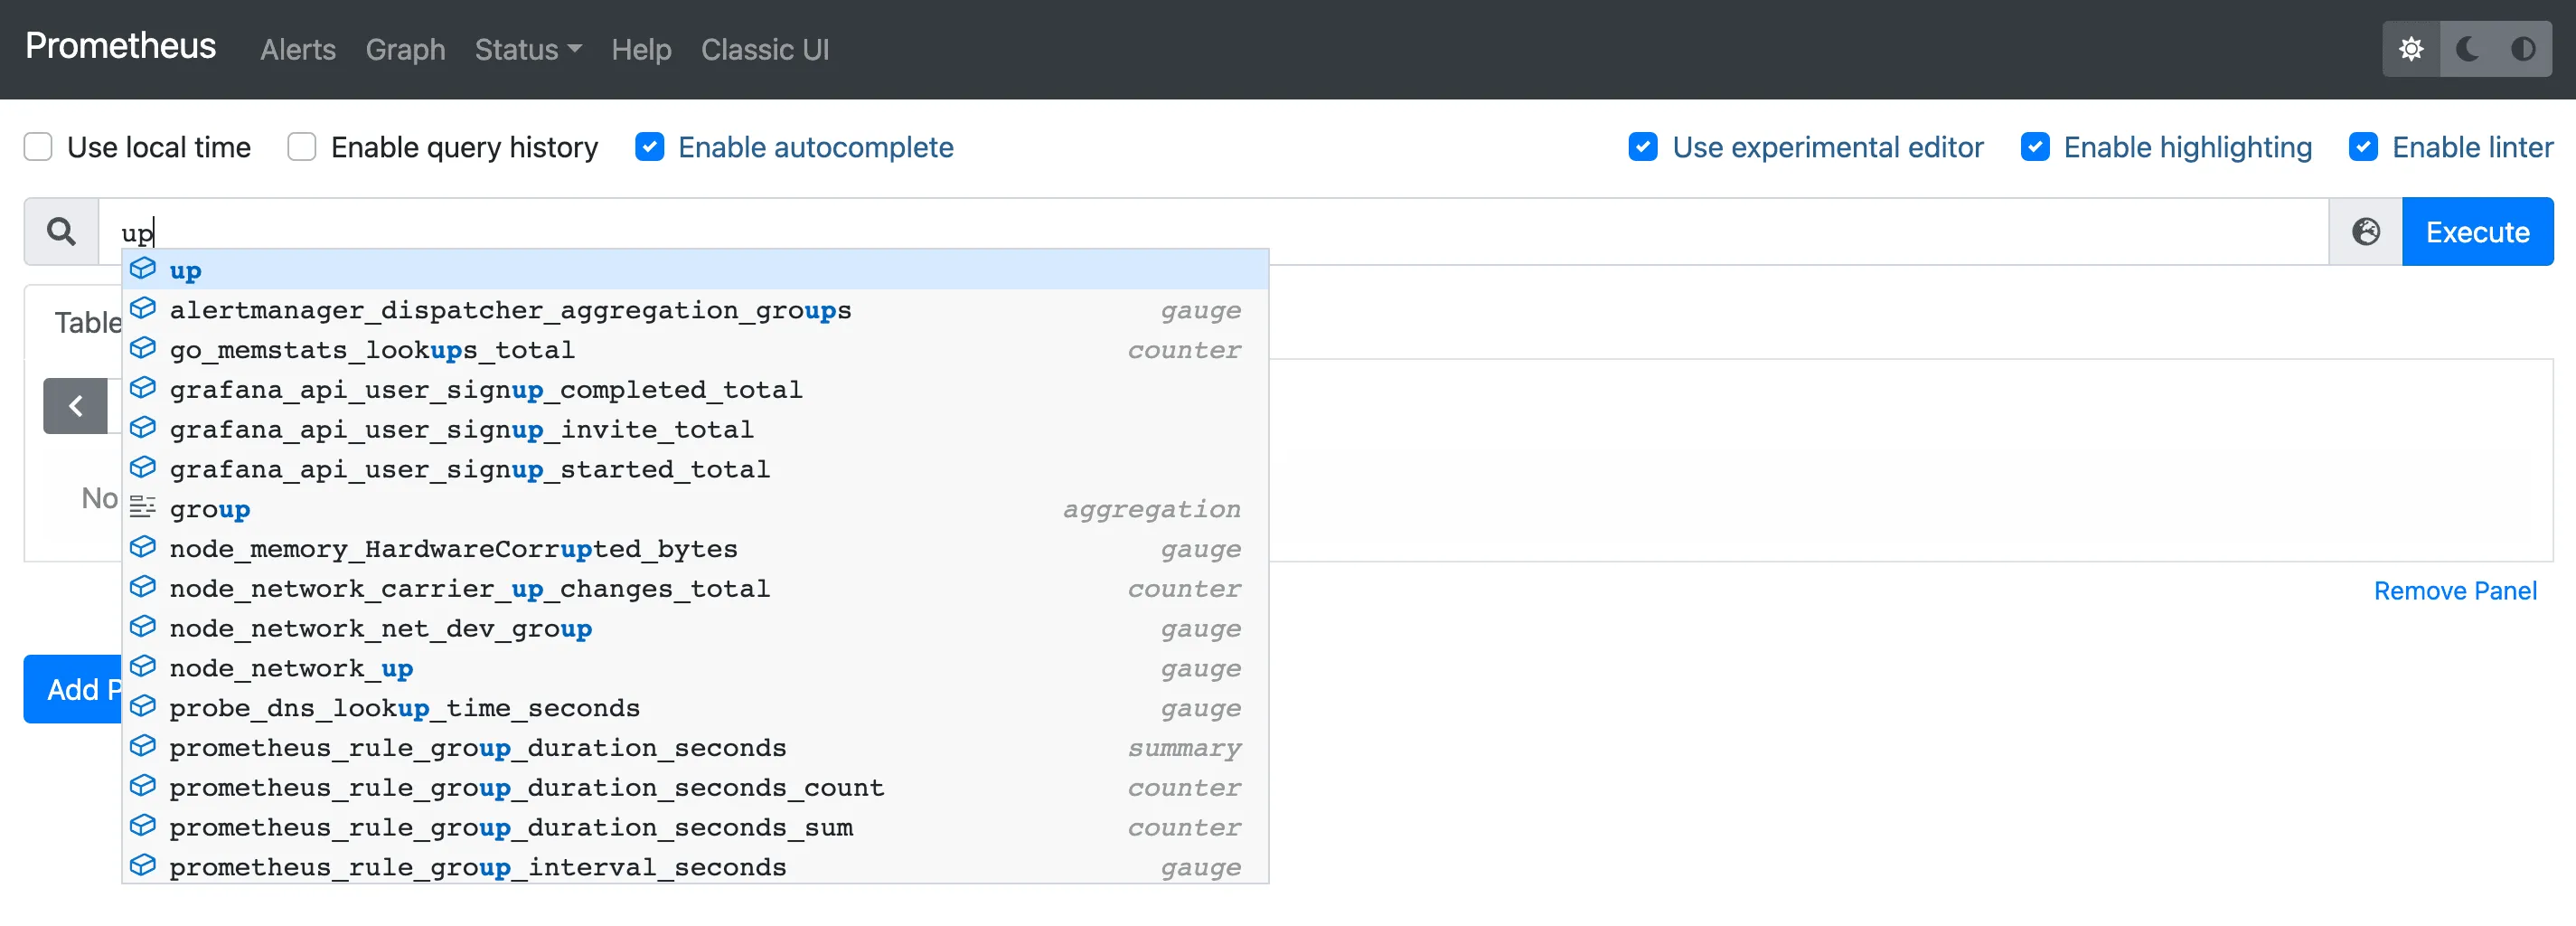
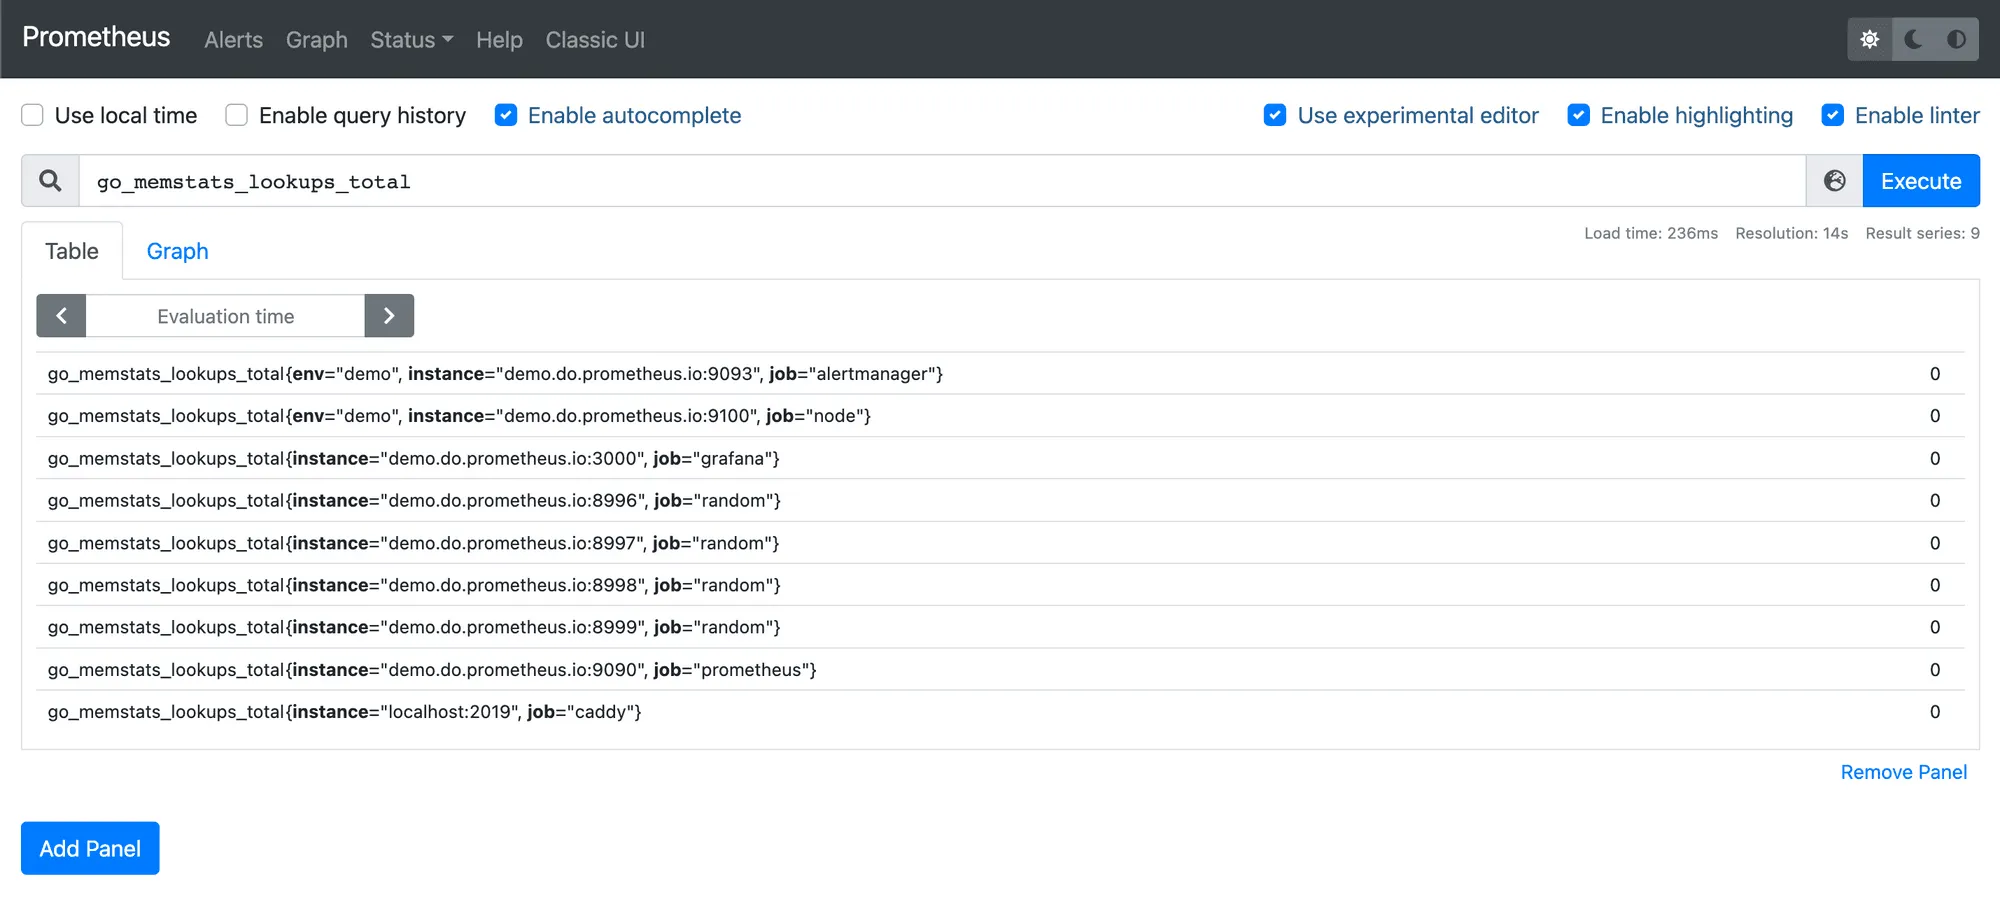
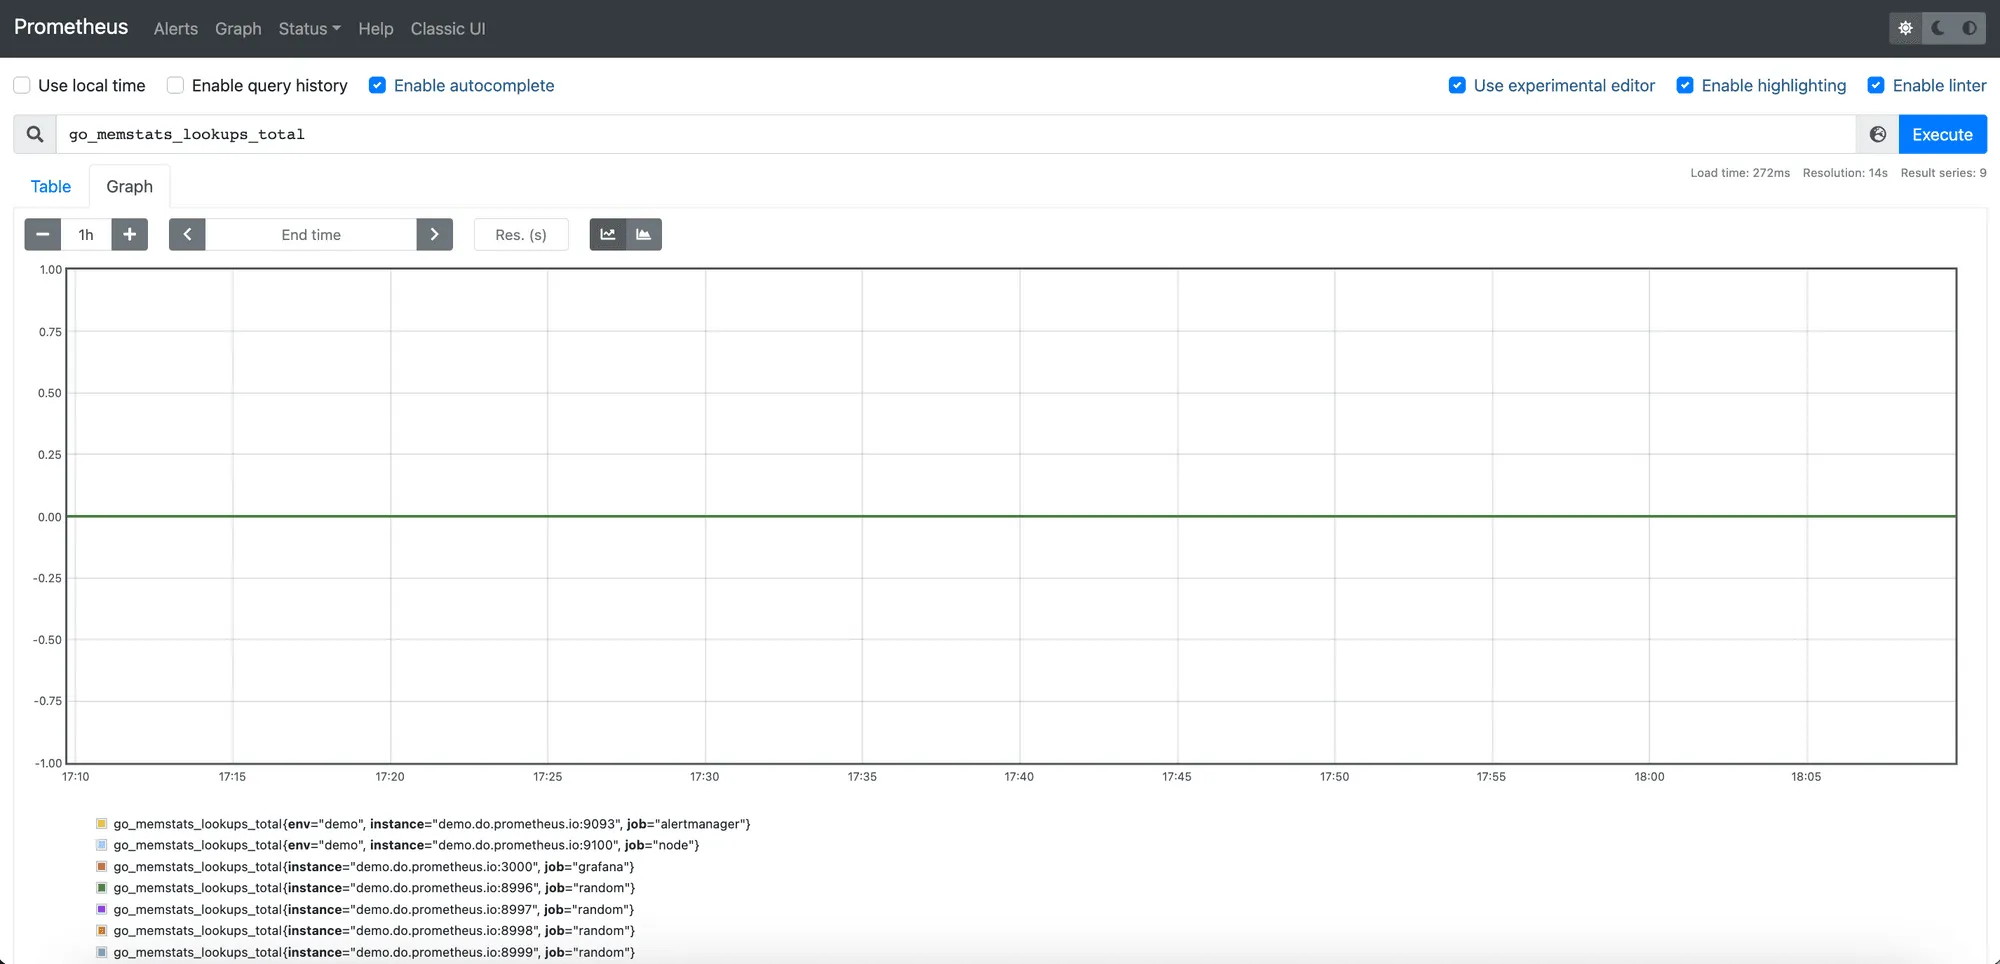
Recently, Promlens was donated to the Prometheus project and will be part of upcoming Prometheus releases to help the in-built visualization.
Visualization using Grafana
Alternatively, you can use Grafana to create dashboards to visualize metrics stored in Prometheus. Grafana is a multi-platform open-source analytics and interactive visualization web application.
Grafana can be installed independently as an open-source package, and Prometheus data source can be configured inside it to fetch time series data from Prometheus using PromQL.
Long term storage
Prometheus includes a local on-disk time series database for storage. As per Prometheus docs:
Again, Prometheus’s local storage is not intended to be durable long-term storage; external solutions offer extended retention and data durability.
Prometheus allows long-term storage of data by remote writing it in third-party services, such as Mimir, Cortex, and Last9. You can run Prometheus in agent mode, and remote write the data to long-term storage. This also helps reduce the operational overhead of running Prometheus.
Prometheus Alternatives
There are plenty of alternatives to Prometheus, like InfluxDB, Splunk, Zabbix, Cassandra, and VictoriaMetrics. Each of these tools focuses on different areas—some are great for analytics, others for logs, and some provide complete monitoring solutions or data aggregation. Additionally, cloud providers offer managed services for Prometheus.
While each tool has its strengths, many monitoring tools fail to give a complete picture of application performance, something 60% of software engineers agree on. As a result, more powerful alternatives are becoming increasingly necessary.
Last9 aims to simplify observability by combining metrics, logs and traces into a single view. This integration helps teams quickly make connections across systems, streamline alert management, and troubleshoot issues more efficiently.
Last9 works effortlessly with tools like Prometheus and OpenTelemetry, offering deeper insights into performance and errors. It’s especially useful for teams dealing with distributed systems and microservices, giving them a comprehensive view of their infrastructure and services.
Using Last9’s high cardinality workflows, we were able to accurately measure customer SLAs across dimensions, extract knowledge about our systems, and measure customer impact proactively. — Ranjeet Walunj, SVP Engineering, CleverTap
Schedule a demo with us or try it for free to learn more about Last9!
FAQs
What is Prometheus?
Prometheus is an open-source monitoring and alerting toolkit designed for collecting, storing, and querying time-series data. It is widely used in cloud-native environments for monitoring applications, services, and infrastructure.
What is Prometheus for monitoring?
Prometheus is used for monitoring and alerting in cloud-native and containerized environments. It collects and stores metrics from various systems and services, providing real-time visibility into their performance.
Is Prometheus monitoring good?
Yes, Prometheus is considered one of the best monitoring tools, especially for cloud-native and Kubernetes-based environments. Its scalability, powerful query language (PromQL), and integration with tools like Grafana make it a comprehensive solution for modern monitoring.
What is Prometheus good for?
Prometheus is particularly good for monitoring dynamic and distributed systems like Kubernetes, Docker, and cloud platforms. It provides real-time insights, powerful querying, and alerting to ensure the health of infrastructure and applications.
What is Prometheus and Grafana?
Prometheus is a monitoring and alerting toolkit, while Grafana is a data visualization tool. When used together, they provide a robust solution for collecting, storing, visualizing, and alerting metrics.
What are the benefits of Prometheus?
Prometheus offers several benefits, including scalability, real-time monitoring, powerful querying with PromQL, open-source flexibility, and integration with various tools like Grafana and Alertmanager for visualization and alerting.
What is Grafana?
Grafana is an open-source data visualization and monitoring tool that integrates with Prometheus to create interactive dashboards and graphs for visualizing time-series data. It helps teams analyze system performance and make data-driven decisions.

