When it comes to monitoring and visualizing your data, two popular tools often come up: Kibana and Grafana.
Both are powerful tools for analyzing and presenting data, but they have distinct features, strengths, and weaknesses that make them suited for different tasks.
In this blog, we'll explore these differences and help you decide which tool is the best fit for your organization.
What is Kibana?
Kibana is a data visualization and exploration tool that works natively with Elasticsearch, which is a popular search engine and analytics platform.
It’s a part of the Elastic Stack (formerly known as the ELK Stack), which also includes Elasticsearch and Logstash. Kibana is specifically designed to interact with Elasticsearch data, providing powerful search, visualization, and analysis capabilities.

Key Features of Kibana:
- Deep Elasticsearch Integration: Kibana is built to work seamlessly with Elasticsearch, making it the perfect choice for anyone using Elasticsearch as a data source.
- Advanced Search Capabilities: Kibana provides powerful search functionality that allows users to filter, query, and analyze their Elasticsearch data in depth.
- Log Management: Kibana is widely used for log aggregation and analysis, helping organizations troubleshoot issues and monitor system performance.
- Real-time Data Exploration: Kibana allows you to explore data in real-time, enabling you to react to changes in your data as they happen.
Use Cases for Kibana:
- Log Analytics: Kibana shines when it comes to analyzing logs, especially in environments where logs are stored in Elasticsearch.
- Application Troubleshooting: Developers and system administrators can use Kibana to quickly identify issues within logs and system performance.
- Security Analytics: With Kibana’s advanced search and filtering capabilities, it is widely used for security data analysis.
What is Grafana?
Grafana, on the other hand, is a visualization and monitoring tool that integrates with multiple data sources, including Prometheus, InfluxDB, Graphite, and more.
Grafana specializes in creating interactive, real-time dashboards for monitoring time-series data, making it a popular choice for infrastructure monitoring, application performance monitoring (APM), and other metric-based data.
Key Features of Grafana:
- Multi-Source Data Integration: Grafana can pull data from multiple sources like Prometheus, InfluxDB, and even Elasticsearch, making it flexible and adaptable to various use cases.
- Time-Series Visualization: Grafana excels at visualizing time-series data such as system metrics, network traffic, and server health.
- Customizable Dashboards: Grafana allows users to create highly customizable dashboards that display data from different sources in an easy-to-understand format.
- Alerting: Grafana offers alerting capabilities to notify users of important changes in metrics, such as CPU usage or memory consumption.
Use Cases for Grafana:
- Infrastructure Monitoring: Grafana is often used to monitor the health and performance of infrastructure, including servers, databases, and network devices.
- Application Monitoring: It is also widely used for application monitoring, especially in environments that generate time-series data, such as cloud-native applications.
- Business Metrics Visualization: Grafana is increasingly used for tracking business KPIs and other important metrics.

Key Differences: Kibana vs Grafana
To help you choose between Kibana and Grafana, we’ve summarized the key differences in the table below:
| Feature | Kibana | Grafana |
|---|---|---|
| Primary Focus | Log and data exploration via Elasticsearch | Time-series monitoring and visualization |
| Data Sources | Primarily Elasticsearch | Multiple data sources (e.g., Prometheus, InfluxDB, Graphite, Elasticsearch) |
| Dashboarding | Basic dashboards for log data | Advanced dashboards for time-series data |
| Alerting | Basic alerting | Advanced alerting with threshold-based notifications |
| Use Case | Log management, security analytics, troubleshooting | Infrastructure monitoring, APM, business metrics |
| Ease of Use | User-friendly, especially for Elasticsearch users | Highly customizable, great for metric visualization |
| Machine Learning | Available through Elastic Stack with machine learning capabilities | No native machine learning features, but can integrate with external tools |
| Pricing | Free and open-source, commercial options available | Free and open-source, commercial options available |
Detailed Comparison: Kibana vs Grafana
While both Kibana and Grafana are visualization tools, they excel in different areas, and your choice largely depends on your specific use case.
Let’s take a deeper look at how they differ in terms of their capabilities, integrations, and how they handle data.
1. Integrations and Data Sources
One of the most important factors to consider when choosing between Kibana and Grafana is how each tool handles integrations and data sources.
- Kibana: It is designed to work seamlessly with Elasticsearch. If your organization is already using Elasticsearch for data storage or log management, Kibana is likely the natural choice.
It allows you to query and visualize data in real-time and is tightly integrated with other tools in the Elastic Stack, such as Logstash and Beats.
- Grafana: Grafana, on the other hand, is far more flexible when it comes to data sources. While it can integrate with Elasticsearch (as Kibana does), it also supports a wide range of other data sources, including Prometheus, Last9, InfluxDB, Graphite, AWS CloudWatch, and SQL databases.
This makes Grafana ideal for environments with a diverse set of data sources, especially when dealing with time-series data.
2. Data Visualizations
Both Kibana and Grafana provide excellent data visualization capabilities, but their strengths are in different areas.
- Kibana: Kibana’s strength lies in the visualization of log and event data. It offers a range of chart types such as histograms, pie charts, and line charts.
The visualizations are designed to help users interact with Elasticsearch data, enabling advanced queries and search functionality. Kibana also offers Timelion, which is designed for time-series analysis.
- Grafana: Grafana excels at visualizing time-series data. It supports a variety of visualizations, including heatmaps, histograms, and more advanced options like alerting visualizations and automated anomaly detection.
Grafana is particularly well-suited for monitoring infrastructure and applications, with a powerful templating feature that allows for dynamic dashboards and visualizations across different time periods and environments.
3. Alerting and Monitoring
- Kibana: Kibana’s alerting features are less robust than Grafana’s, although it does provide basic alerting capabilities via the Watcher plugin (in the commercial version of Elastic Stack).
These alerts can be set for specific queries or thresholds and can be sent via email, Slack, or other channels.
- Grafana: Grafana offers advanced alerting that is highly customizable. It allows users to set threshold-based alerts on specific metrics, and notifications can be sent through multiple channels like email, Slack, PagerDuty, or webhook.
Grafana also supports multi-metric alerts, meaning users can set alerts that depend on more than one metric at a time.

4. Machine Learning & AI
- Kibana: Kibana offers machine learning features through Elastic Stack’s ML capabilities.
It can detect anomalies in your data, which is particularly useful for identifying unexpected spikes or drops in data without the need for manual intervention. However, this feature is available only in the commercial version of Elastic Stack.
- Grafana: While Grafana doesn’t have built-in machine learning capabilities, it can integrate with external tools like Prometheus or Loki to bring in anomaly detection features.
Grafana has the flexibility to integrate with machine learning services but does not natively offer these capabilities in the same way Kibana does.
5. Security and Access Control
Both tools offer security features, but with some notable differences:
- Kibana: Kibana benefits from Elastic Stack’s security features, which include role-based access control (RBAC), single sign-on (SSO), and data encryption. These features are available in the Elastic Stack's commercial offerings.
- Grafana: Grafana has integrated security features like RBAC, authentication via LDAP, and OAuth. It is often used in open-source environments where security configurations can be customized to a greater extent.
In the Enterprise version, Grafana provides even more features like audit logging, permissions management, and data encryption.
6. Ease of Use
- Kibana: Kibana’s interface is clean and relatively easy to use, especially for those familiar with Elasticsearch.
The discover and visualize functions allow users to easily access their data, while the query builder is intuitive for users who need to filter and search through logs or other data.
- Grafana: Grafana is known for its highly customizable and interactive dashboards. While it may take a bit of a learning curve to fully use its templating and alerting features,
Grafana’s user interface is widely appreciated for its flexibility. It’s an excellent choice for those who want to create a tailored experience for visualizing time-series metrics and monitoring infrastructure.
Industry-Specific Use Cases
Both Kibana and Grafana are used in a variety of industries, but they tend to shine in different environments:
- Kibana is favored in organizations that focus heavily on log analytics, security, and application troubleshooting.
It is particularly useful in industries like e-commerce, finance, and cybersecurity, where analyzing logs, detecting threats, and troubleshooting applications in real-time are key.
- Grafana is preferred for infrastructure monitoring, especially in industries that rely heavily on metrics-based monitoring, such as cloud providers, IT operations, and telecommunications. It's also used in business intelligence to track KPIs and other business metrics.
Conclusion: Which One Should You Choose?
The decision between Kibana and Grafana ultimately comes down to your specific needs and the nature of your data.
Choose Kibana for log management, Elasticsearch-based data exploration, and real-time troubleshooting, offering deep search capabilities for log analysis.
Opt for Grafana if you need flexible, customizable dashboards for time-series data and infrastructure monitoring, with support for a wide range of data sources and cloud-native environments.
If you're looking for an observability and monitoring solution that offers all the capabilities at an affordable price, Last9 is the perfect choice.
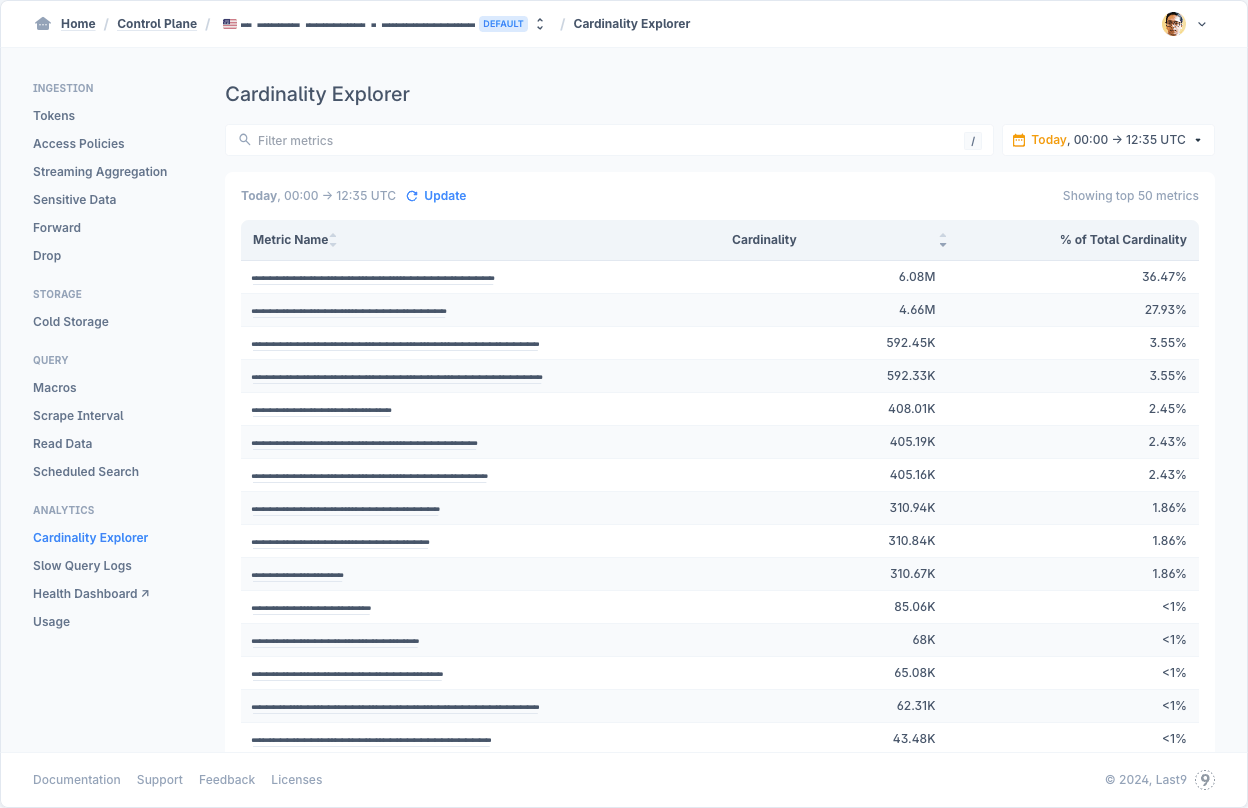
At the heart of our approach to observability is the belief that effective monitoring starts with the proper collection and storage of telemetry data. We consider Last9 to be a telemetry hub, effortlessly combining metrics, traces and logs into one unified platform for easy access.
As your organization scales and high cardinality becomes a challenge, we're here to bridge the gaps left by other solutions, offering user-friendly experiences that help you manage and use your telemetry data more efficiently.
Last9 took away the toil of setting up monitoring that works flawlessly at scale, and that too, with high cardinality data. We had one less thing to worry about and could focus on serving our user base during the peak moments. - Ashish Garg, CTO, Probo
FAQs
What is the main difference between Kibana and Grafana?
The main difference is that Kibana is designed primarily for visualizing and analyzing log data stored in Elasticsearch. It is best suited for searching, querying, and visualizing log data. On the other hand, Grafana is a time-series analytics platform that excels at visualizing metrics from various data sources, including Prometheus, Last9, InfluxDB, and Elasticsearch.
Can I use Kibana and Grafana together?
Yes, many organizations use Kibana and Grafana together to take advantage of their respective strengths. Kibana is excellent for querying and analyzing logs from Elasticsearch, while Grafana is perfect for visualizing time-series data and setting up real-time dashboards. Integrating both can provide a comprehensive solution for monitoring and analyzing both logs and metrics.
Which tool is better for monitoring infrastructure?
Grafana is better suited for infrastructure monitoring due to its time-series data visualization capabilities. It can integrate with multiple metrics sources, such as Prometheus, Graphite, InfluxDB, and Last9, making it ideal for monitoring server performance, network health, and other infrastructure metrics.
Which tool is better for log analysis?
If you’re using Elasticsearch to store and manage your logs, Kibana is a great choice. It lets you dive deep into your log data with advanced queries and interactive visualizations, making it easier to spot and troubleshoot issues. But if you’re looking for something that integrates smoothly with your existing tools and offers a more comprehensive log management experience, Last9 can also be a solid option. It brings everything together, helping you stay on top of your logs and identify problems faster.
Does Grafana support alerting?
Yes, Grafana offers advanced alerting features. You can set up alert rules based on specific conditions like threshold values, and alerts can be sent via multiple channels such as email, Slack, PagerDuty, or webhooks.
Is Kibana easier to use than Grafana?
Both tools have user-friendly interfaces, but they differ in complexity. Kibana may be easier for users already familiar with Elasticsearch due to its tight integration. Grafana, however, offers more flexibility with its dashboarding and templating capabilities, but it may require more time to master, especially when setting up advanced dashboards and alerts.
Can I use Grafana with Elasticsearch?
Yes, Grafana supports Elasticsearch as a data source, allowing you to create visualizations and dashboards based on the data stored in Elasticsearch. While Kibana is the default visualization tool for Elasticsearch, Grafana can also be used effectively if you prefer its interface or need to integrate Elasticsearch data with other sources.
Which tool is better for businesses or enterprises?
Both tools offer enterprise-grade features, but the choice depends on your needs:
Kibana is perfect for those using Elasticsearch for log data and requires strong security features like RBAC and SSO. Grafana shines for metrics monitoring across systems, with customizable alerts and dashboards for complex infrastructures. For a more integrated solution, Last9 can also be a great choice, offering flexible monitoring and observability across diverse data sources.
Can Kibana and Grafana be used for machine learning?
Kibana offers machine learning capabilities through Elastic Stack's ML features, which allow for anomaly detection and predictive analytics.
Grafana does not have built-in machine-learning features, but it can integrate with machine-learning platforms like Prometheus or Loki, which can provide insights based on data anomalies.
Which tool is better for visualizing time-series data?
Grafana is generally considered superior for visualizing time-series data, especially for time-based metrics like CPU usage, memory consumption, and network throughput. Its advanced dashboarding features and integration with Prometheus make it an excellent tool for time-series analysis. For high cardinality observability, Last9 also stands out as a powerful platform, helping you manage complex telemetry data across diverse systems with ease.
