Nearly 80% of all the metrics data collected is unused. A large volume of them is at times, unnecessary. When I speak to engineering teams, I usually state that 30-40% are unused, and pat comes the inevitable reply, “It’s a minimum of 70%”. This is not new or novel. But yet, we chug along.
We built Levitate to solve exactly these problems. Sign up here.
It’s funny because engineers still pay exorbitant costs to store these metrics. It’s another point how management and finance have no visibility into these obvious slippages. But that’s a conversation for another day. The reality - is an utter lack of visibility into the costs associated with this storage. The pain of retaining historical data, and the ability to contextually transfer it as you hire more engineers, is insurmountable.
Our hypothesis on this is simple: Storing metrics without having to worry about scale needs to be simpler. Way simpler.
There was a time when folks were discussing build vs. buy for cloud storage. Now, that conversation is redundant. Time series storage is at that point — it makes no sense to maintain your time series databases.
Uplifting your metrics woes
Every customer we’ve spoken with highlighted the endless exasperation of scaling their time series database. It was not just cardinality but the constant tuning to improve retention, optimize latency, and ensure the availability of core workflows & dashboards. This hampered their overall ability to build a resilient reliability mandate.
This endless exasperation became apparent as we spoke about one of our primary products around Change Detection; Compass. Without the ability to centralize and manage data, building intelligence is meaningless. But to do that effectively, it's ideal to have all metrics data in one place. Bringing all this siloed data helps understand change and build correlations.
Levitate was born.

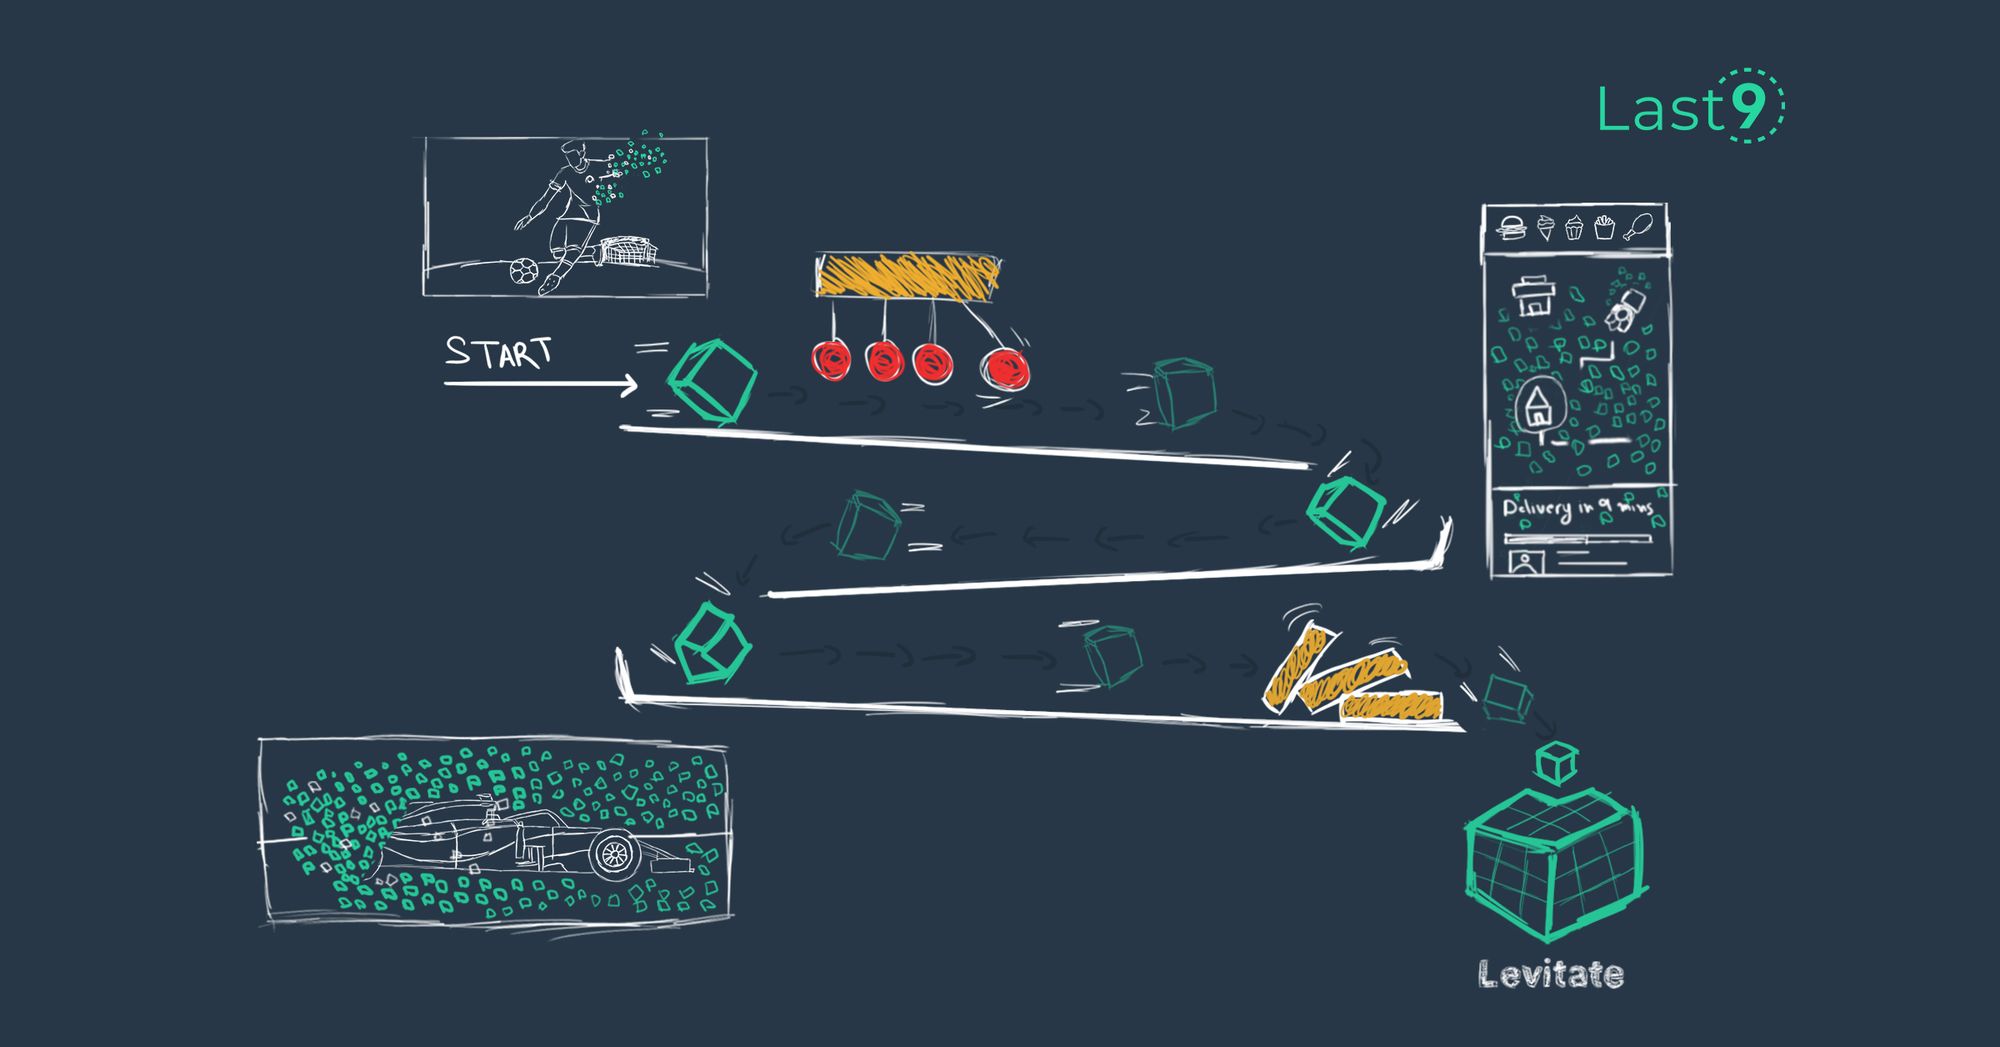
We piloted this with a few clients, but our biggest test was to roll out Levitate to one of the world’s largest OTT players. When concurrent users climb from 1 million to 25 million in minutes and crash back to 2-3 million, a systems engineer understands the insane tech powering these experiences for customers.
We’ve been patient about this rollout, ironing out chinks in the armor. After managing an unprecedented scale of 600+ million metrics a minute at 200 ms of ingestion (😎), we’re now opening Levitate to the public.
Imagine missing a critical goal from Ronaldo or the final Formula 1 race - you’ve effectively ruined a customer's most memorable piece of history. We piloted Levitate with several customers and quickly realized how effective Levitate was in managing high cardinality. What started as an experiment soon became a crucial product.
Our belief in Levitate was further solidified when we could tier queries based on priority. Companies that manage scale routinely crash their dashboards as more engineers write queries. For the first time, we had a time series database to handle this pressure easily.
As we opened these conversations to more companies, Levitate became a no-brainer.
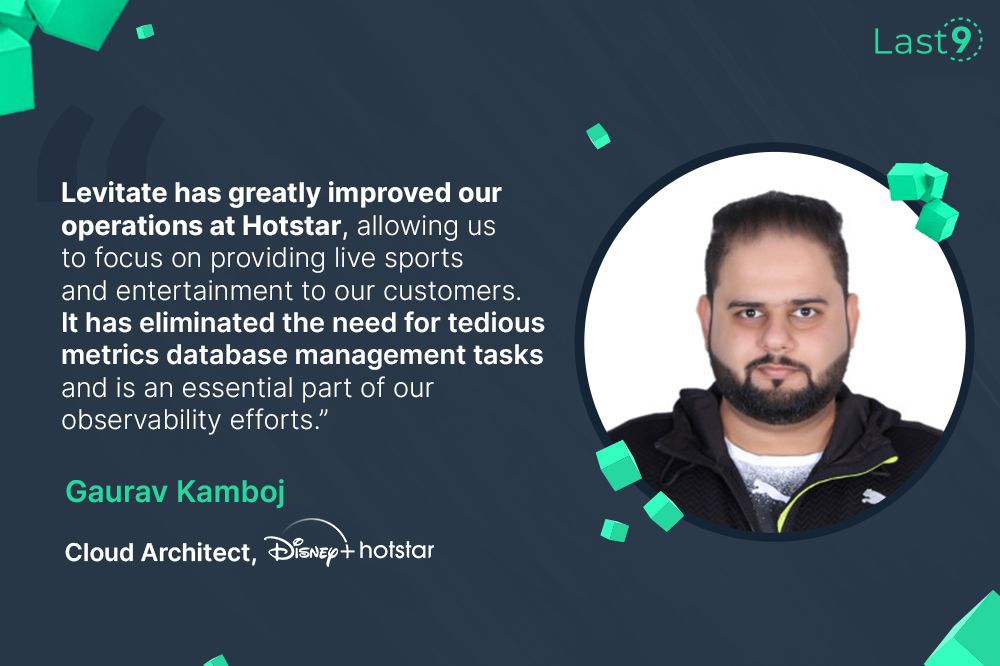
"Levitate solves one of the most significant operational distractions we have dealt with at Disney+ Hotstar. We have spent countless hours setting up, backing up, replicating, scaling, swapping, and tuning our Metrics databases. This was an essential piece in the Observability of Hotstar. We couldn't be more excited to migrate to Levitate and concentrate on doing what we do best: Serve live sports and entertainment across our customers," said - Gaurav Kamboj, Cloud Architect, Disney+ Hotstar.

What makes Levitate different
Our goal with Levitate was two-fold:
- Reduce all operational toil = More productivity, lesser costs.
- Manage mission-critical storage = High query performance, high availability, and low latency writing.
Levitate’s write availability SLA is ~99.9%, with no work needed by your team.
That means your Prometheus agents can be lightweight transmitters. Bye Bye storage concerns and no data loss 👋
Our standard read availability SLA is 99.5%, giving your team confidence that your monitoring database won’t leave your team blind during an incident.
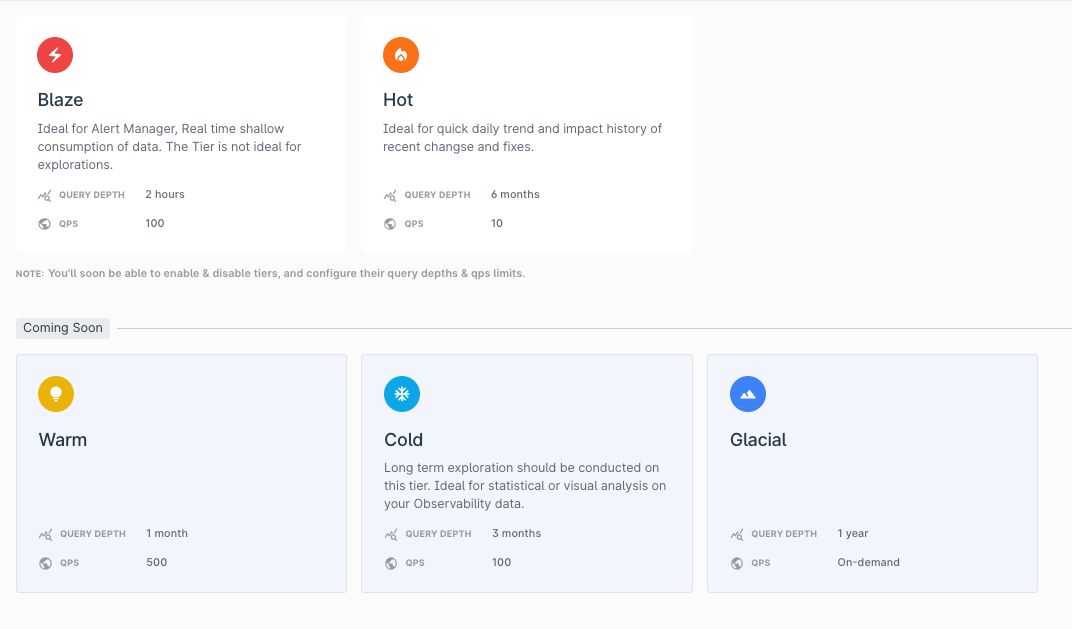
Inspired by principles of Data Warehousing, where Data Tiering is a common phenomenon, we introduced tiers for the Time Series storage.

Levitate can segregate data into Virtual clusters, or Tiers, with distinct access control parameters like:
- Retention Limit - Limit the data that is available in the Tier—i.e x months/days/hours.
- Concurrency Control - Limit the active number of queries the Tier can handle simultaneously. This is the most trustworthy indicator of Performance.
- Range Control - Limit the number of days of data allowed to be looked up in a single query. It directly impacts the number of data points or series loaded into the memory.
But… That’s not all. 😉
We have powerful Policies and Governance features with Levitate. This helps identify dead time series metrics data and trim the fat according to policies the team creates.
In all, Levitate has the right control levers to tame data growth and control costs while not losing sight of the most critical metrics & workflows. In the journey to improving Reliability, you start with the fundamentals; attacking the root cause of metrics storage helps build a strong Reliability mandate.
Get started by signing up here: https://app.last9.io/product/levitate.
Hit us up on Discord 😍 with any queries about Levitate.
Learn more about Levitate, and how you should consider scaling your metrics as your engineering org grows –> https://last9.io/whitepapers/scaling-metrics-maturity-in-a-cloud-native-world/


