As organizations build and scale their digital services, managing and monitoring the intricate layers of their technology stack becomes a complex and critical task.
This is where full-stack observability helps by providing a holistic view of every part of your system, from the front-end interfaces that users interact with to the underlying infrastructure that powers the entire application.
Full-stack observability isn’t just about tracking metrics—it's about gaining actionable insights across your entire stack to ensure seamless application performance.
In this blog, we'll discuss what full-stack observability is, its key benefits, and some key features.
What is Full-Stack Observability?
At its core, full-stack observability provides a unified way of monitoring the health, performance, and reliability of all system components, whether they reside on-premises, in the cloud, or hybrid environments.

The goal is to create visibility that spans the entire application lifecycle, from code execution to user interaction, offering comprehensive insights into infrastructure, software services, databases, and even external integrations.
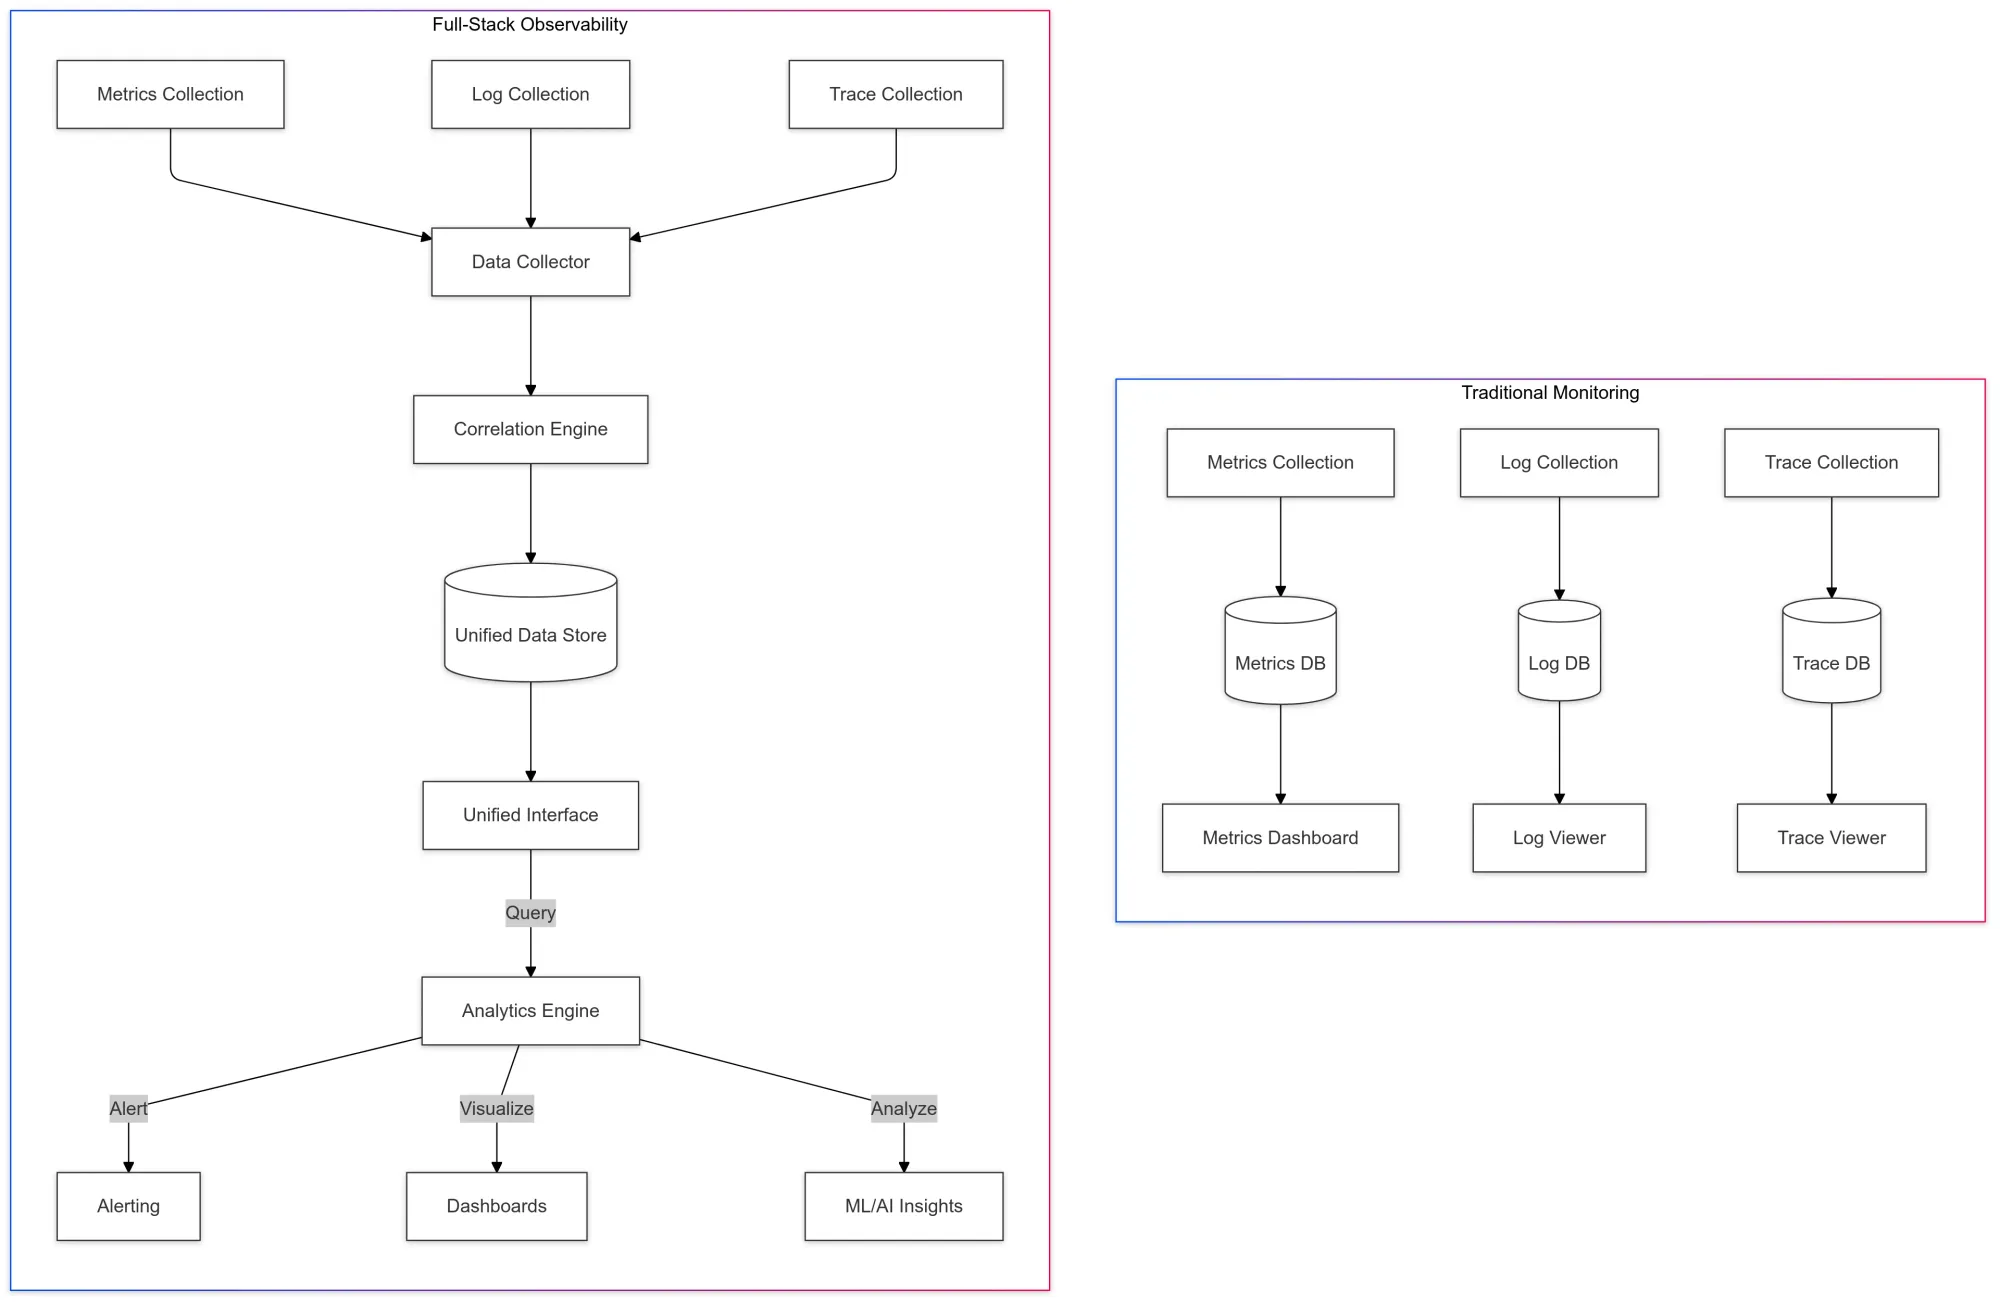
Unlike traditional monitoring, which might focus on just the infrastructure layer or application logs, full-stack observability integrates metrics, traces, and logs into one unified view.

This allows teams to not only monitor but also proactively manage the user experience, troubleshoot more effectively, and optimize resources as needed.
Key Benefits of Full-Stack Observability
1. End-to-End User Insights
The ultimate goal of observability is to improve user experience, and full-stack observability helps achieve this by tracking performance across all layers of the application.
From the moment a user initiates a request to the backend database interactions and beyond, full-stack observability ensures you understand the full context of how your application performs, both from the user’s perspective and from the system’s perspective.

Imagine being able to identify exactly where a performance bottleneck occurs—whether it’s in the frontend, an API, or the infrastructure itself. This deep visibility enables your team to resolve issues faster, reducing the time users experience slowdowns or interruptions.
2. Proactive Issue Detection and Mitigation
One of the biggest challenges in modern software systems is identifying issues before they affect users. Traditional monitoring tools often require a reactive approach: waiting for alerts to go off, followed by an investigation.
With full-stack observability, however, AI and anomaly detection systems are typically embedded in the platform. These systems continuously analyze data across all layers, spotting irregularities before they escalate into major problems.
Detecting performance anomalies early, such as spikes in latency or unexpected errors, helps mitigate risks and prevents them from snowballing into downtime.
Automated remediation actions can even help resolve issues without manual intervention, further reducing operational burden.

3. Data-Driven Decision Making
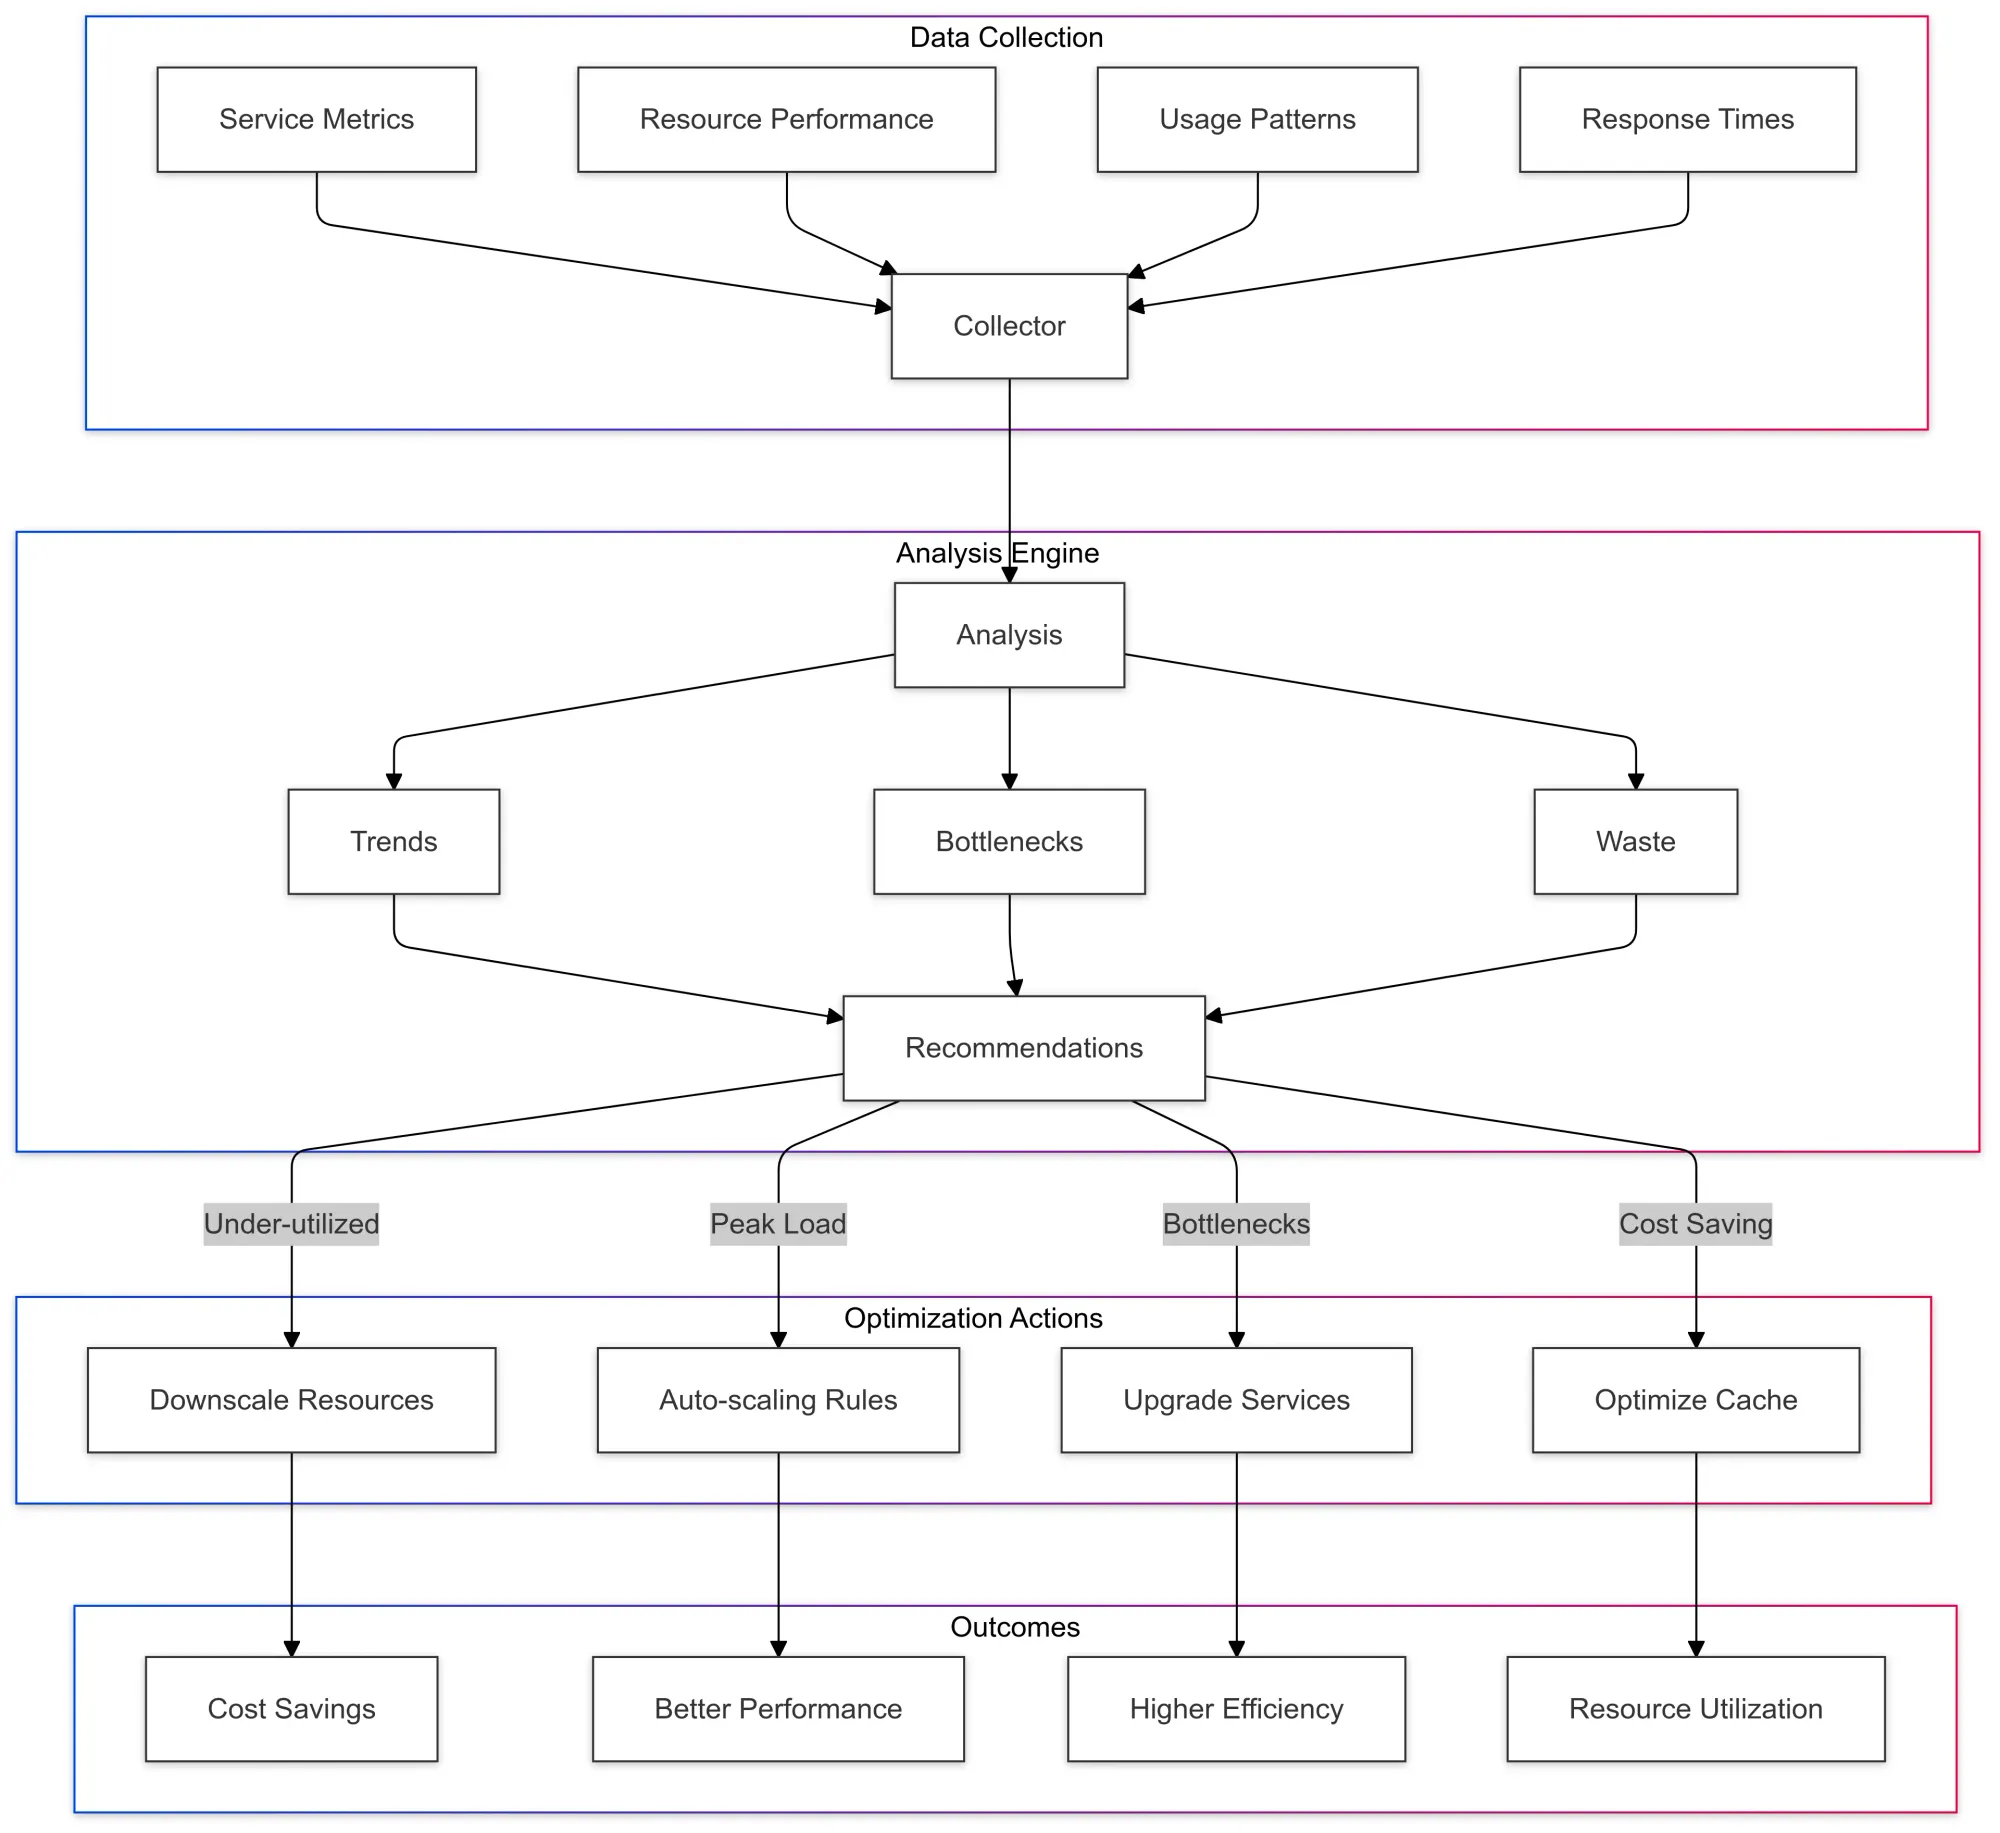
With full-stack observability, you're not just collecting data for the sake of it. You’re harnessing that data to make smarter, more informed decisions about performance, scaling, and resource allocation.
Rather than relying on guesswork or trial and error, your team can make data-driven optimizations.

For instance, full-stack observability can highlight underutilized resources, helping you decide when to scale back or reallocate resources. Similarly, it can pinpoint inefficiencies in your application’s architecture or identify redundant processes, allowing you to cut costs while improving performance.
4. Effortless Cooperation Across Teams
In today's environment, IT teams—whether developers, operations staff, or site reliability engineers—work together to ensure application reliability.
Full-stack observability provides a shared view of the entire stack, improving communication and collaboration across teams.
A single source of truth for system health enables different teams to quickly align and tackle problems without being siloed.
Developers can work with operations to resolve issues faster, for instance, by identifying when an infrastructure problem is causing application errors.

How Full-Stack Observability Works
Modern software architectures, such as microservices and cloud-native environments, introduce their own unique challenges.
Full-stack observability has evolved to handle these complexities, providing visibility across every component, service, and dependency within a microservices environment.
1. Microservices and Distributed Systems
Microservices architectures involve multiple, independently deployed services that communicate with each other over the network. Full-stack observability allows you to see the performance of each service and how they interact with one another.
For example, if a user-facing service is slow, full-stack observability can help you trace the root cause back to a specific microservice or database call, allowing you to address the issue directly.

2. Cloud-Native Environments
As more organizations move their workloads to the cloud, observability becomes more critical to managing the dynamic nature of cloud resources.
Full-stack observability platforms integrate with cloud services to monitor cloud-native resources, such as containerized applications, Kubernetes clusters, and serverless functions. This gives teams the visibility needed to ensure that cloud resources are being used efficiently and perform as expected.
3. Real-Time Metrics, Traces, and Logs
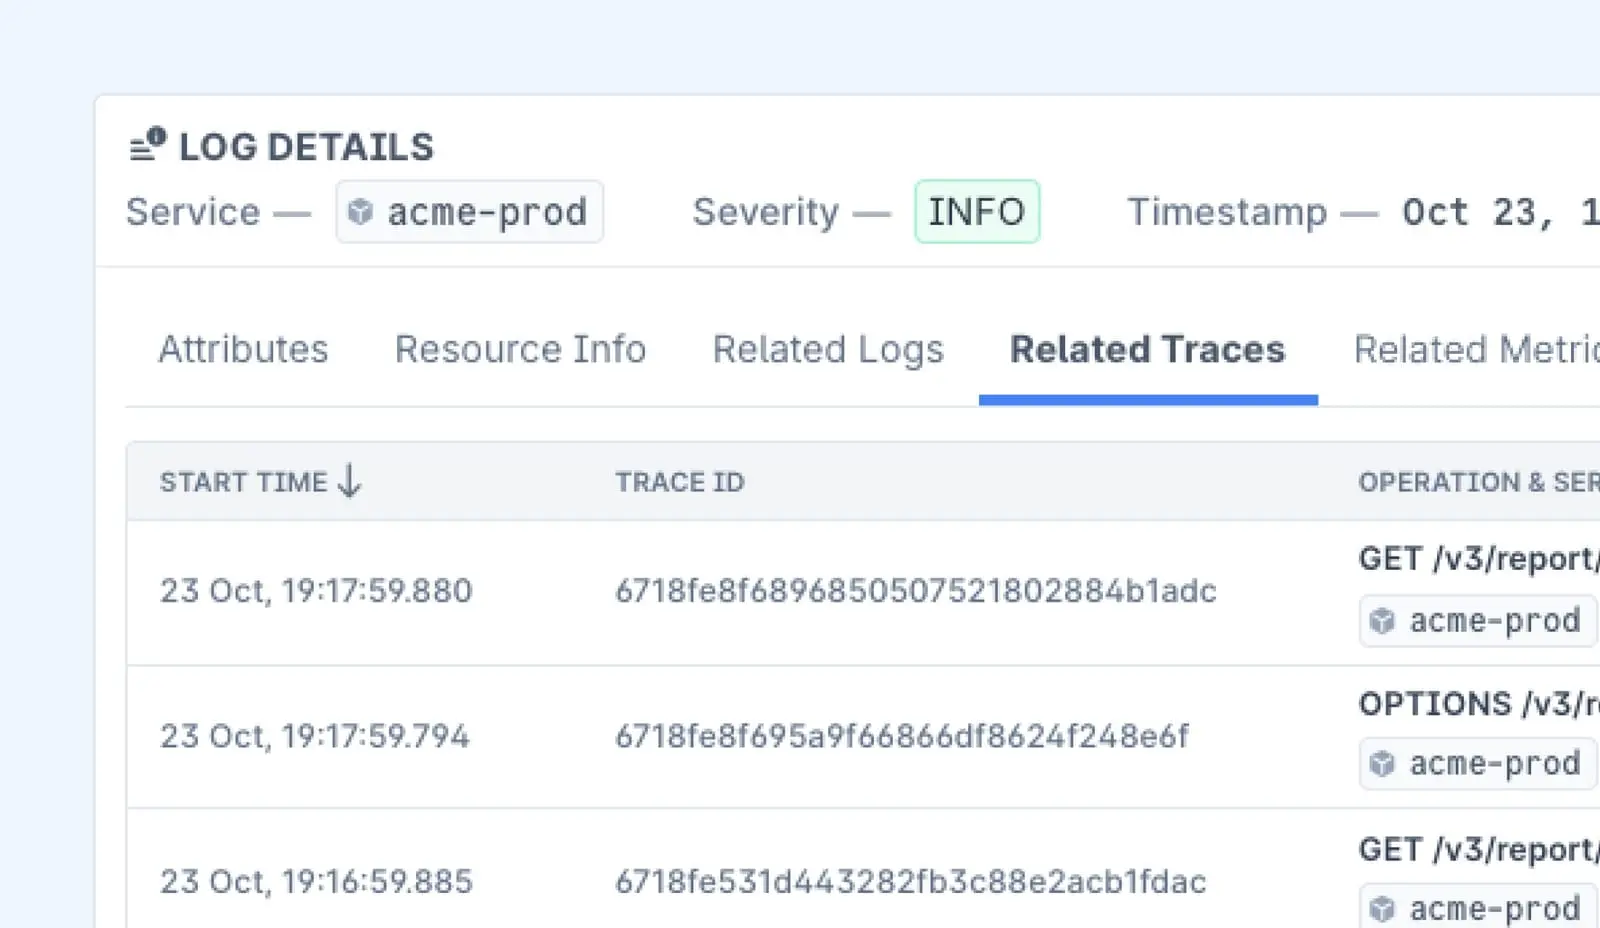
To get the complete picture of application health, full-stack observability integrates three pillars of observability: metrics, logs, and traces. Metrics give you numerical data about system performance, logs provide detailed records of events and errors, and traces allow you to track the flow of requests across services.
When combined, these provide an end-to-end view of what’s happening in your system and allow you to drill down into specific issues when they arise.
Key Features of Full-Stack Observability
When choosing a full-stack observability platform, look for these key features:
- Comprehensive Coverage: Ensure that the platform provides monitoring across your entire stack—frontend, backend, infrastructure, and external services.
- Real-Time Monitoring: Real-time visibility into all components ensures that performance issues can be addressed before they affect users.
- AI-Driven Insights: Machine learning capabilities can help spot trends, predict issues, and automate remediation, reducing the manual effort required.
- Integration Support: The platform should integrate seamlessly with existing development, deployment, and operations tools.

Optimizing Full-Stack Observability: Metrics, Logs, and Traces
To get the most out of your observability tools, you need to understand the three key components: metrics, logs, and traces.
These pillars help you monitor, troubleshoot, and optimize your systems, especially in complex environments like microservices or cloud-native apps.
Metrics: Quick Performance Overview
- What they are: Numbers that give you an instant snapshot of your system (e.g., CPU usage, response time).
- Why they matter: Metrics let you spot performance issues quickly, like slow response times or resource overloads, before they affect users.
Logs: Dig Deeper into Issues
- What they are: Detailed records of events and errors happening in your system.
- Why they matter: Logs give you context and detailed information when things go wrong, helping you troubleshoot and fix problems faster.
Traces: The Path of Requests
- What they are: A record of how requests move through your system, from one service to another.
- Why they matter: Traces show you exactly where delays or errors happen across microservices, so you can fix problems at the source.

Bringing It All Together
- Combining metrics, logs, and traces gives you the full picture.
- Example: If your system is slow (metrics), logs show what went wrong, and traces show where the problem occurred (e.g., a slow database call or API request).
- This unified approach helps you troubleshoot faster and optimize your system more effectively.
Real-Time Insights = Smarter Decisions
- With real-time monitoring of metrics, logs, and traces, you can spot problems and act quickly.
- You can also make data-driven decisions about scaling, optimizing resources, and preventing future issues.
Conclusion
Full-stack observability is key to managing modern applications, enabling teams to quickly troubleshoot, enhance performance, and deliver an exceptional user experience. As businesses scale and embrace new technologies, the need for real-time insights becomes even more vital.
Last9 simplifies observability by unifying metrics, logs, and traces into one view. With easy integration with tools like Prometheus and OpenTelemetry, it helps teams improve alert management, connect the dots across systems, and troubleshoot more effectively.

FAQs
What is the difference between full-stack observability and traditional monitoring?
Full-stack observability offers a more comprehensive approach by integrating metrics, logs, and traces into one unified view, whereas traditional monitoring typically focuses on individual components like servers or databases.
How does full-stack observability help with microservices?
Full-stack observability helps by tracking the interactions between microservices and monitoring their performance. This visibility ensures that teams can trace issues across distributed systems and address problems at the service level.
Can full-stack observability be applied to cloud-native applications?
Yes! Full-stack observability is particularly useful for cloud-native applications, providing visibility across containers, Kubernetes clusters, serverless functions, and other cloud-native components.
What should businesses consider when adopting full-stack observability?
Businesses should look for a platform that provides comprehensive monitoring, integrates easily with existing systems, offers real-time data, and uses AI for advanced insights and automation.


