Trace anything, fast.
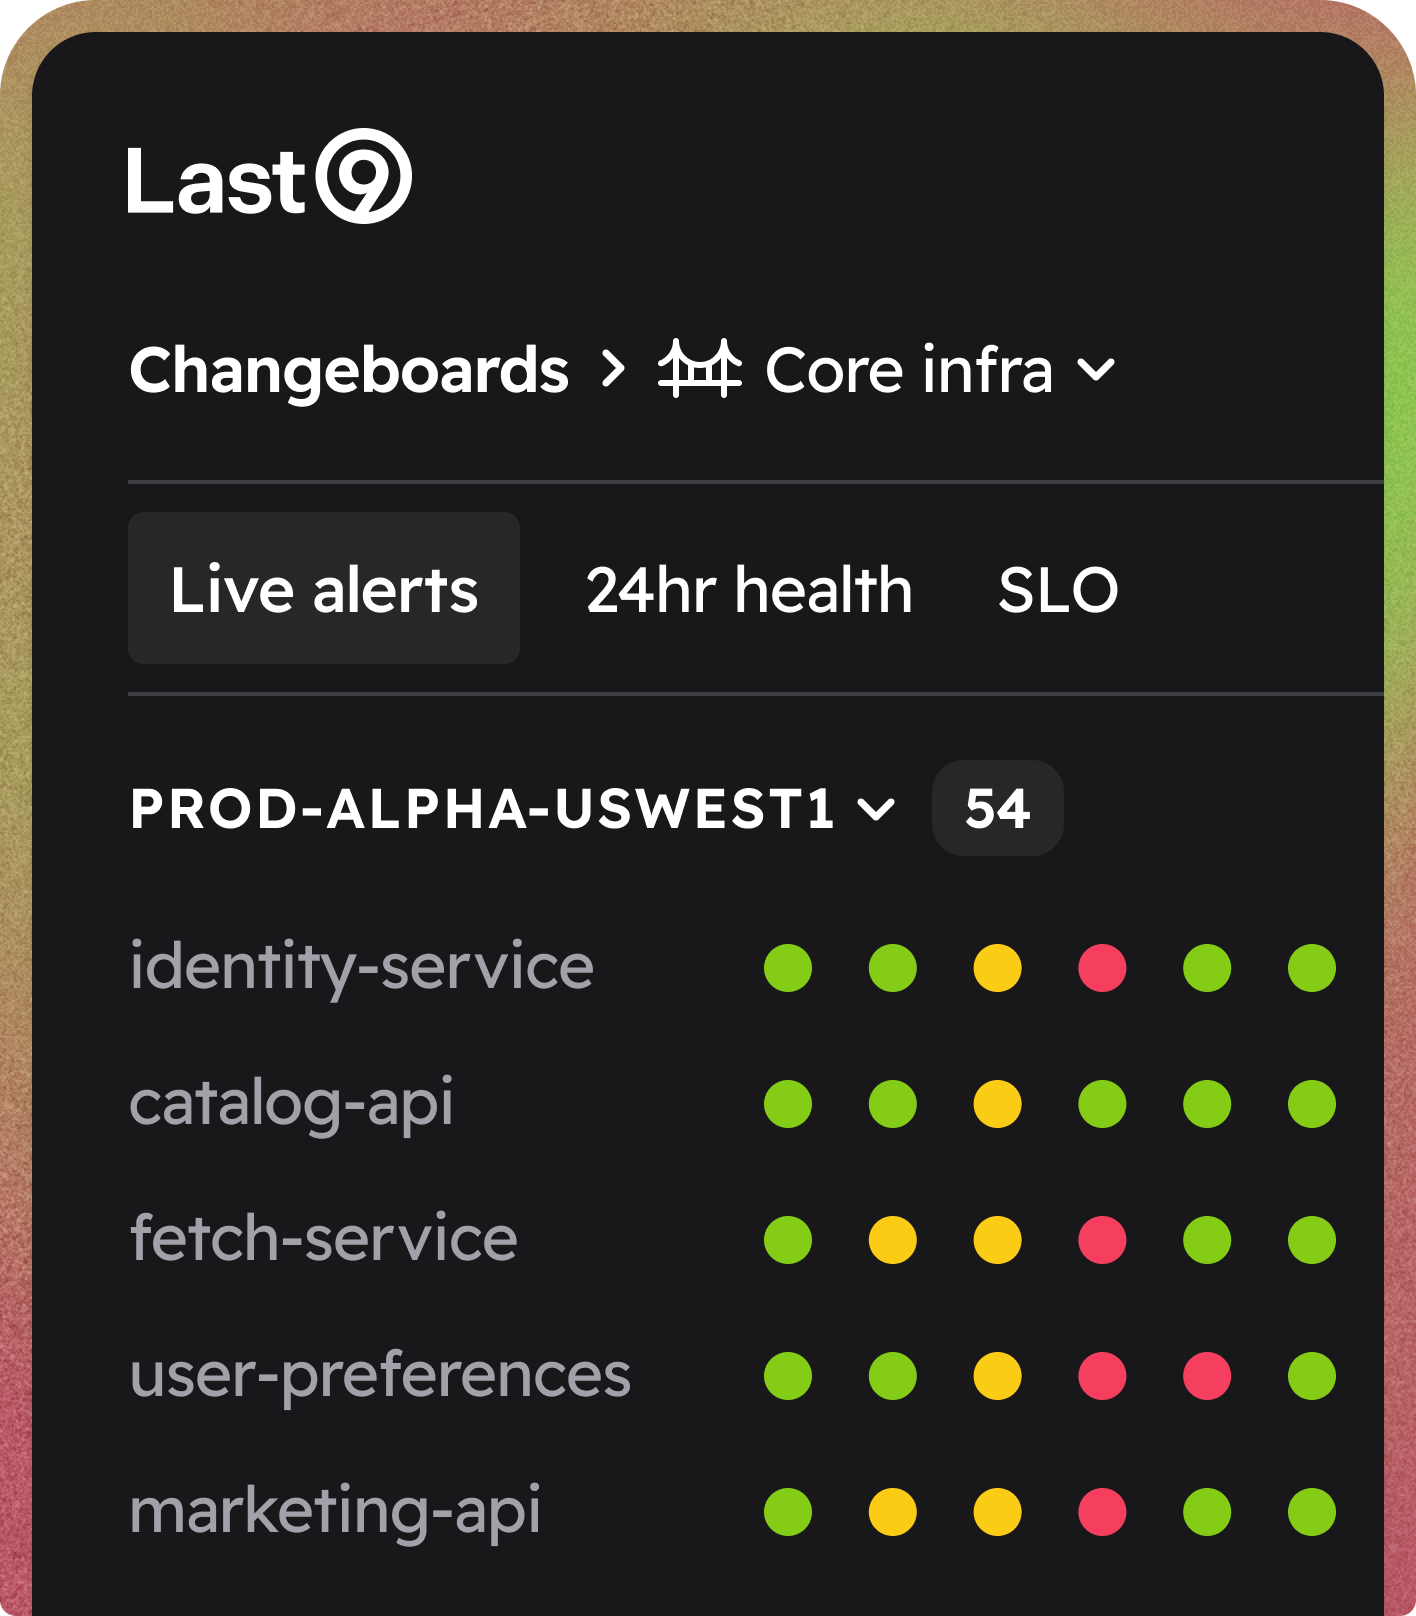
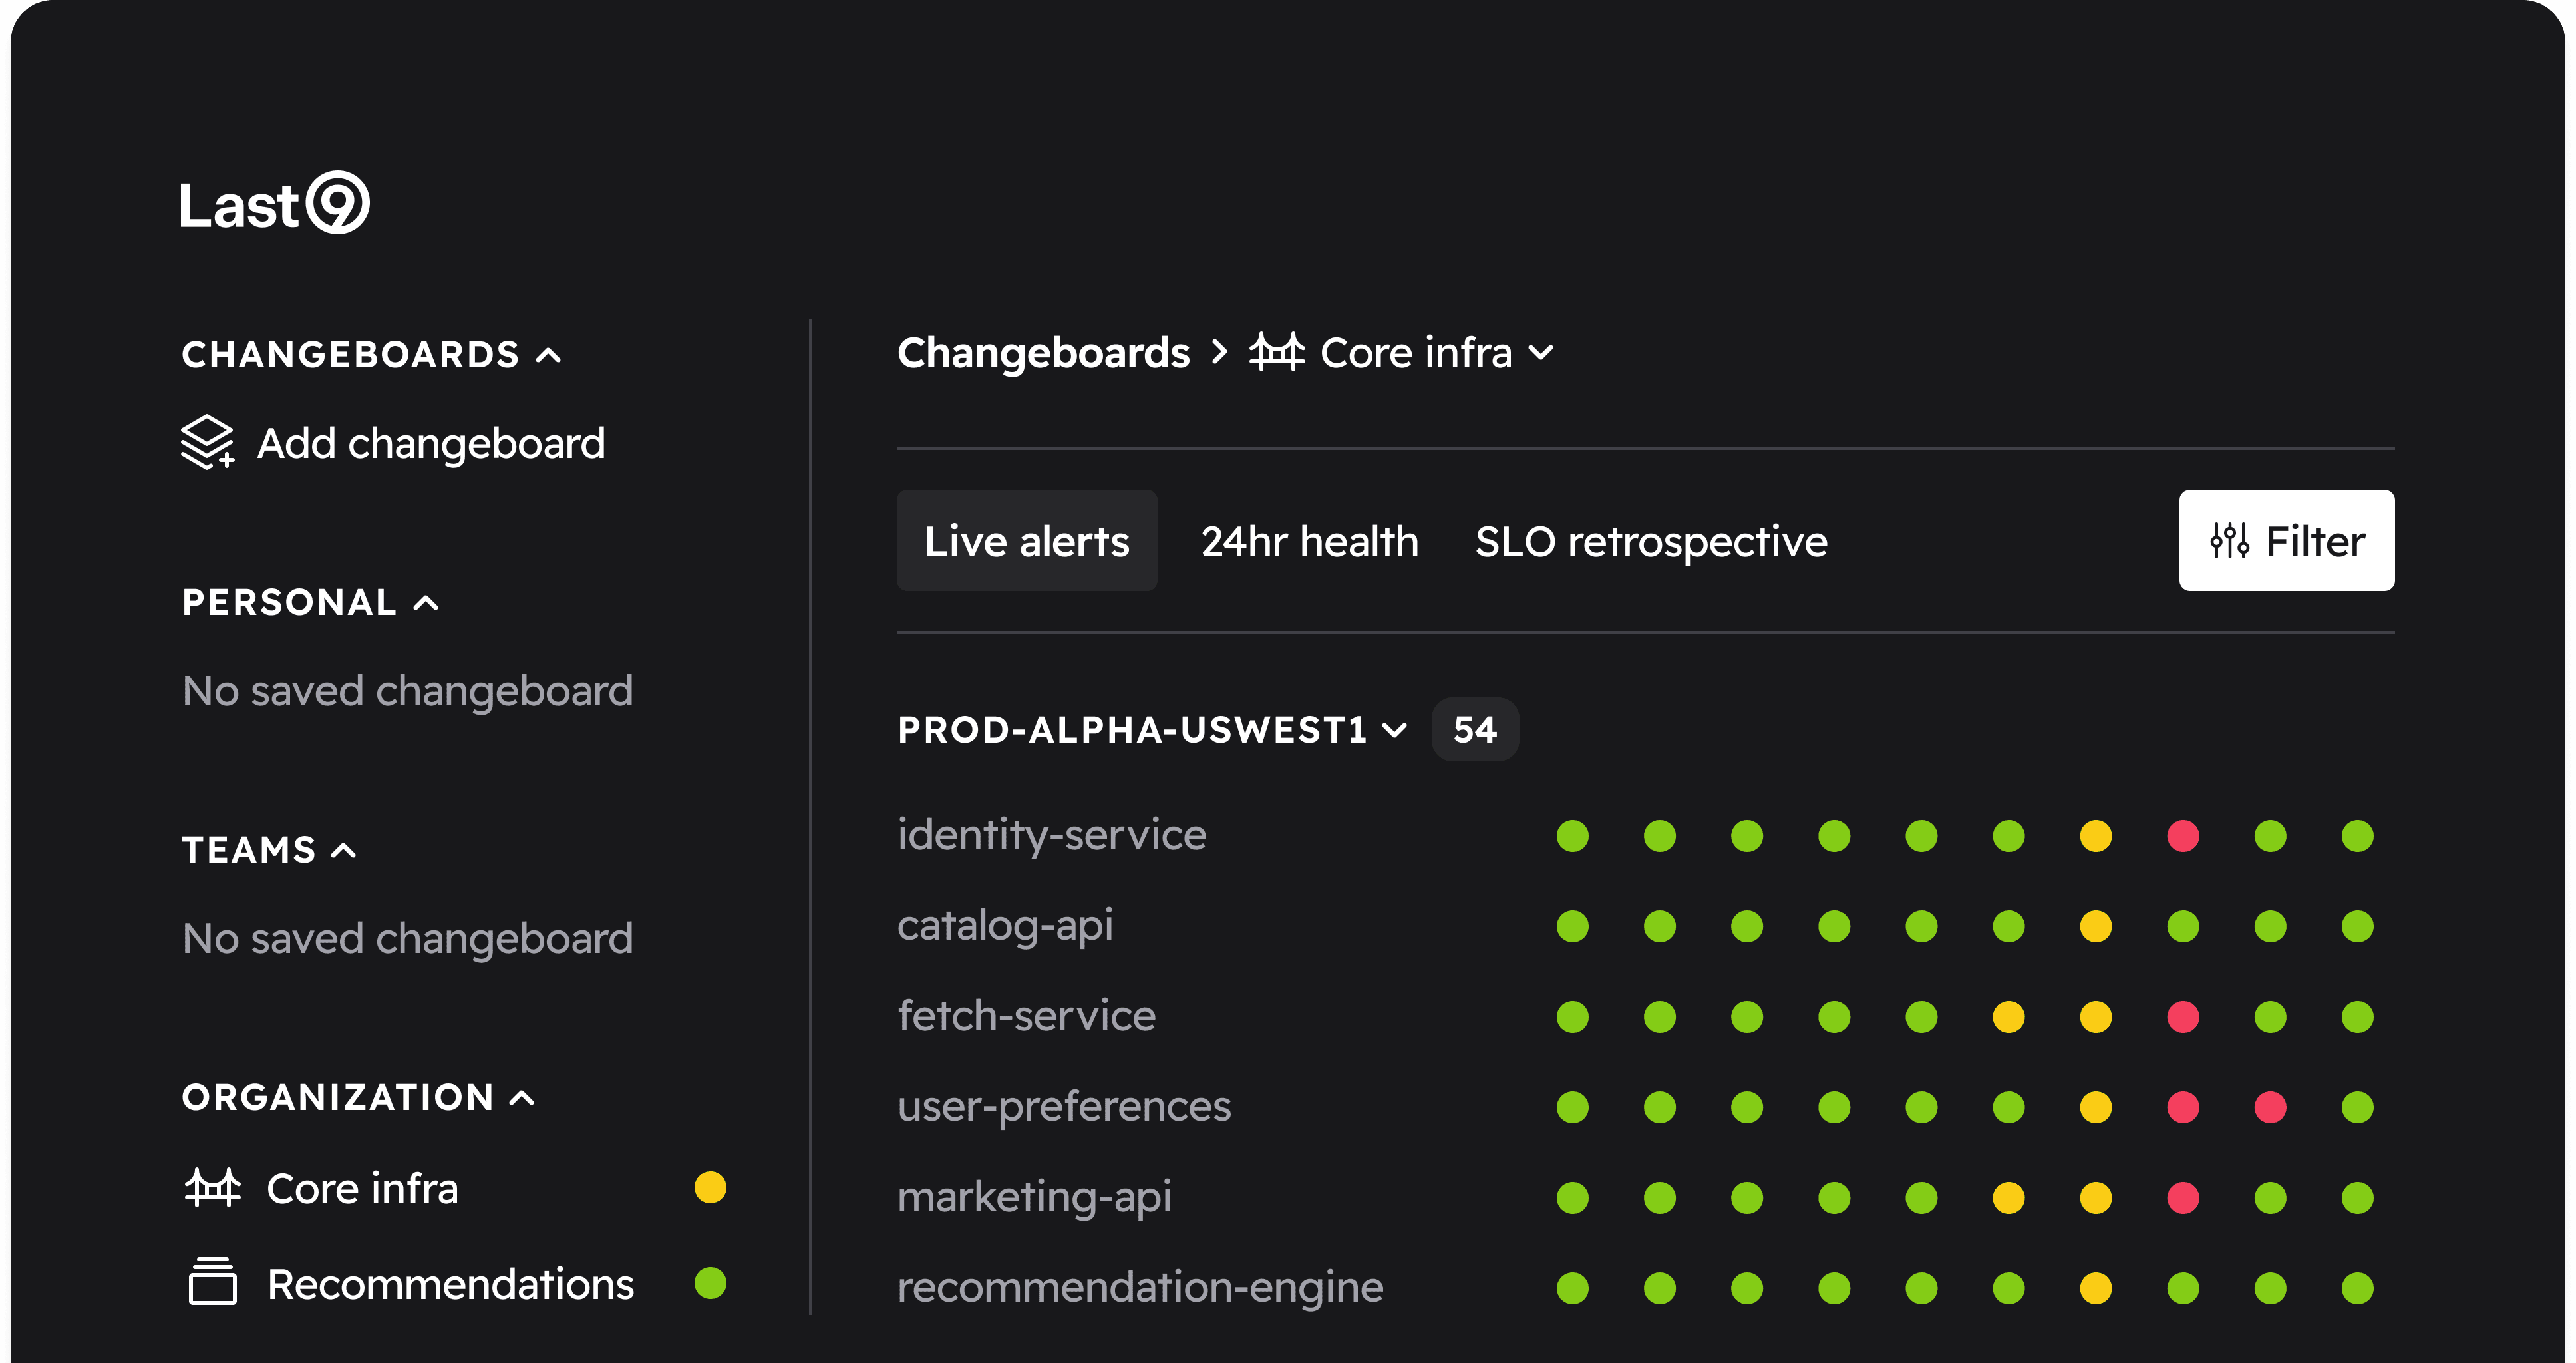
It's all correlated and queryable. Switch between logs, traces and metrics in one click. Query however you prefer—you're in control.
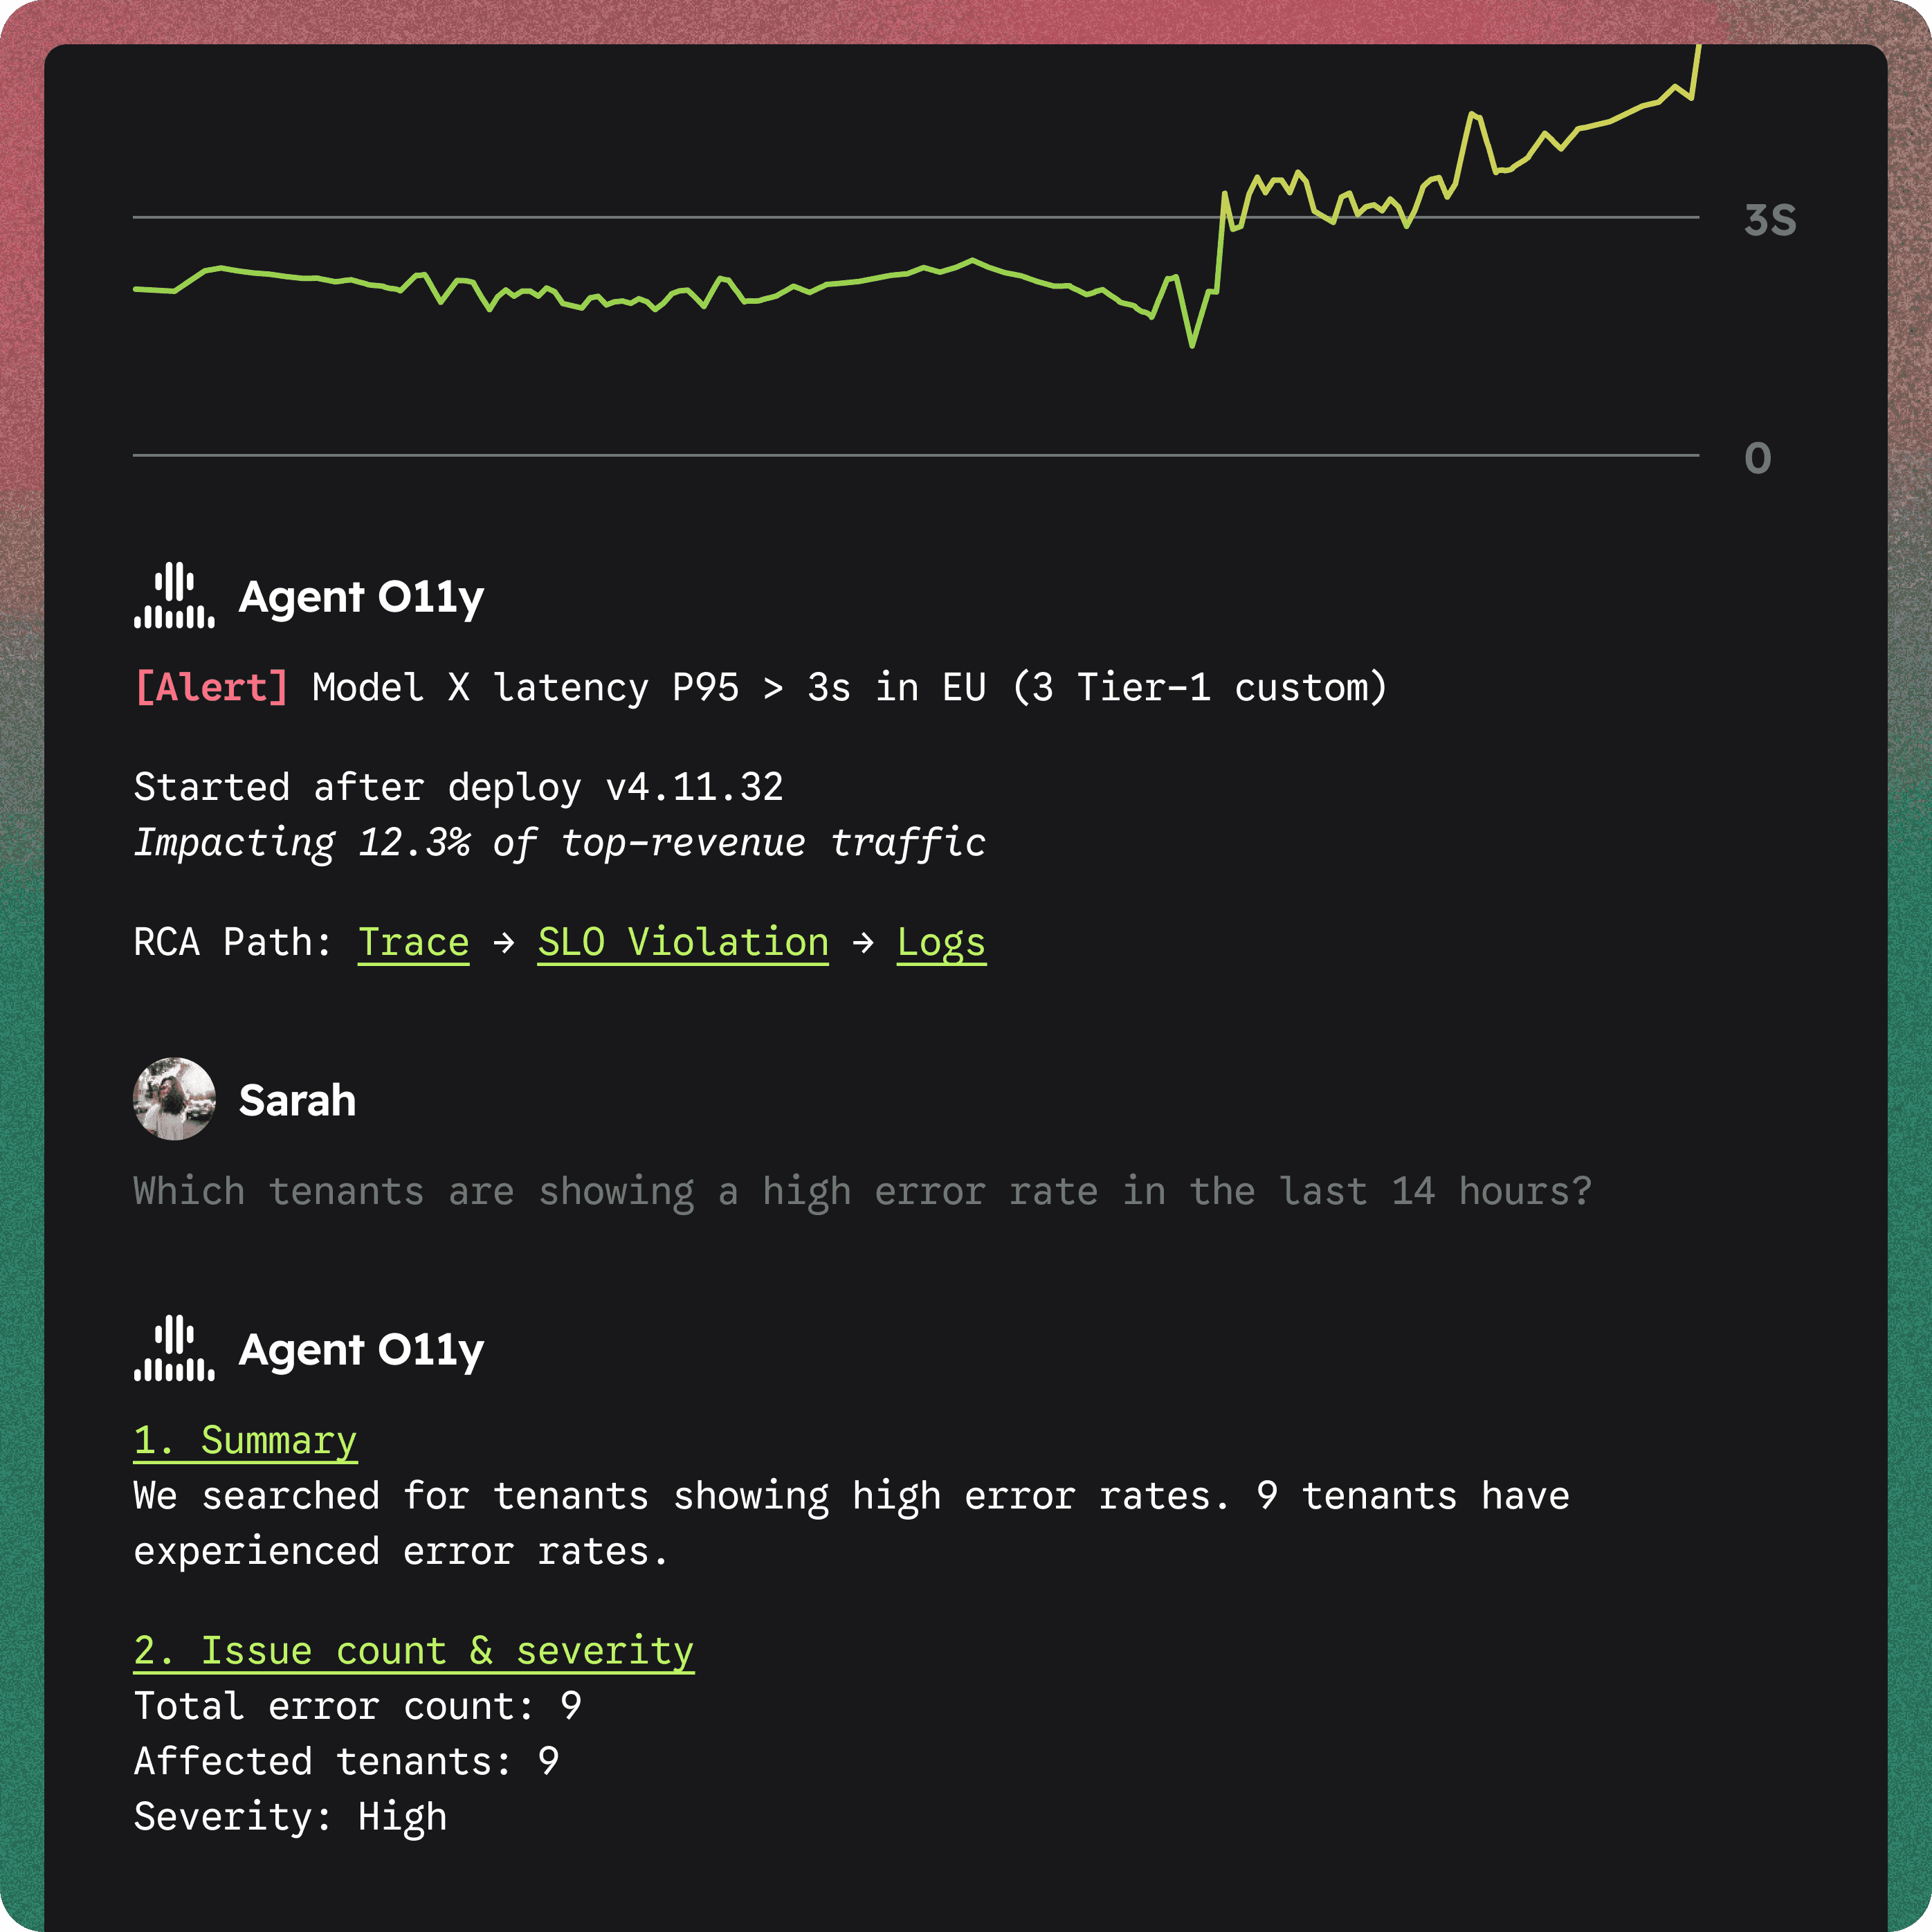
Triage smarter, faster and remediate across your stack with AI. Last9 makes sense of noisy telemetry data for the whole team.
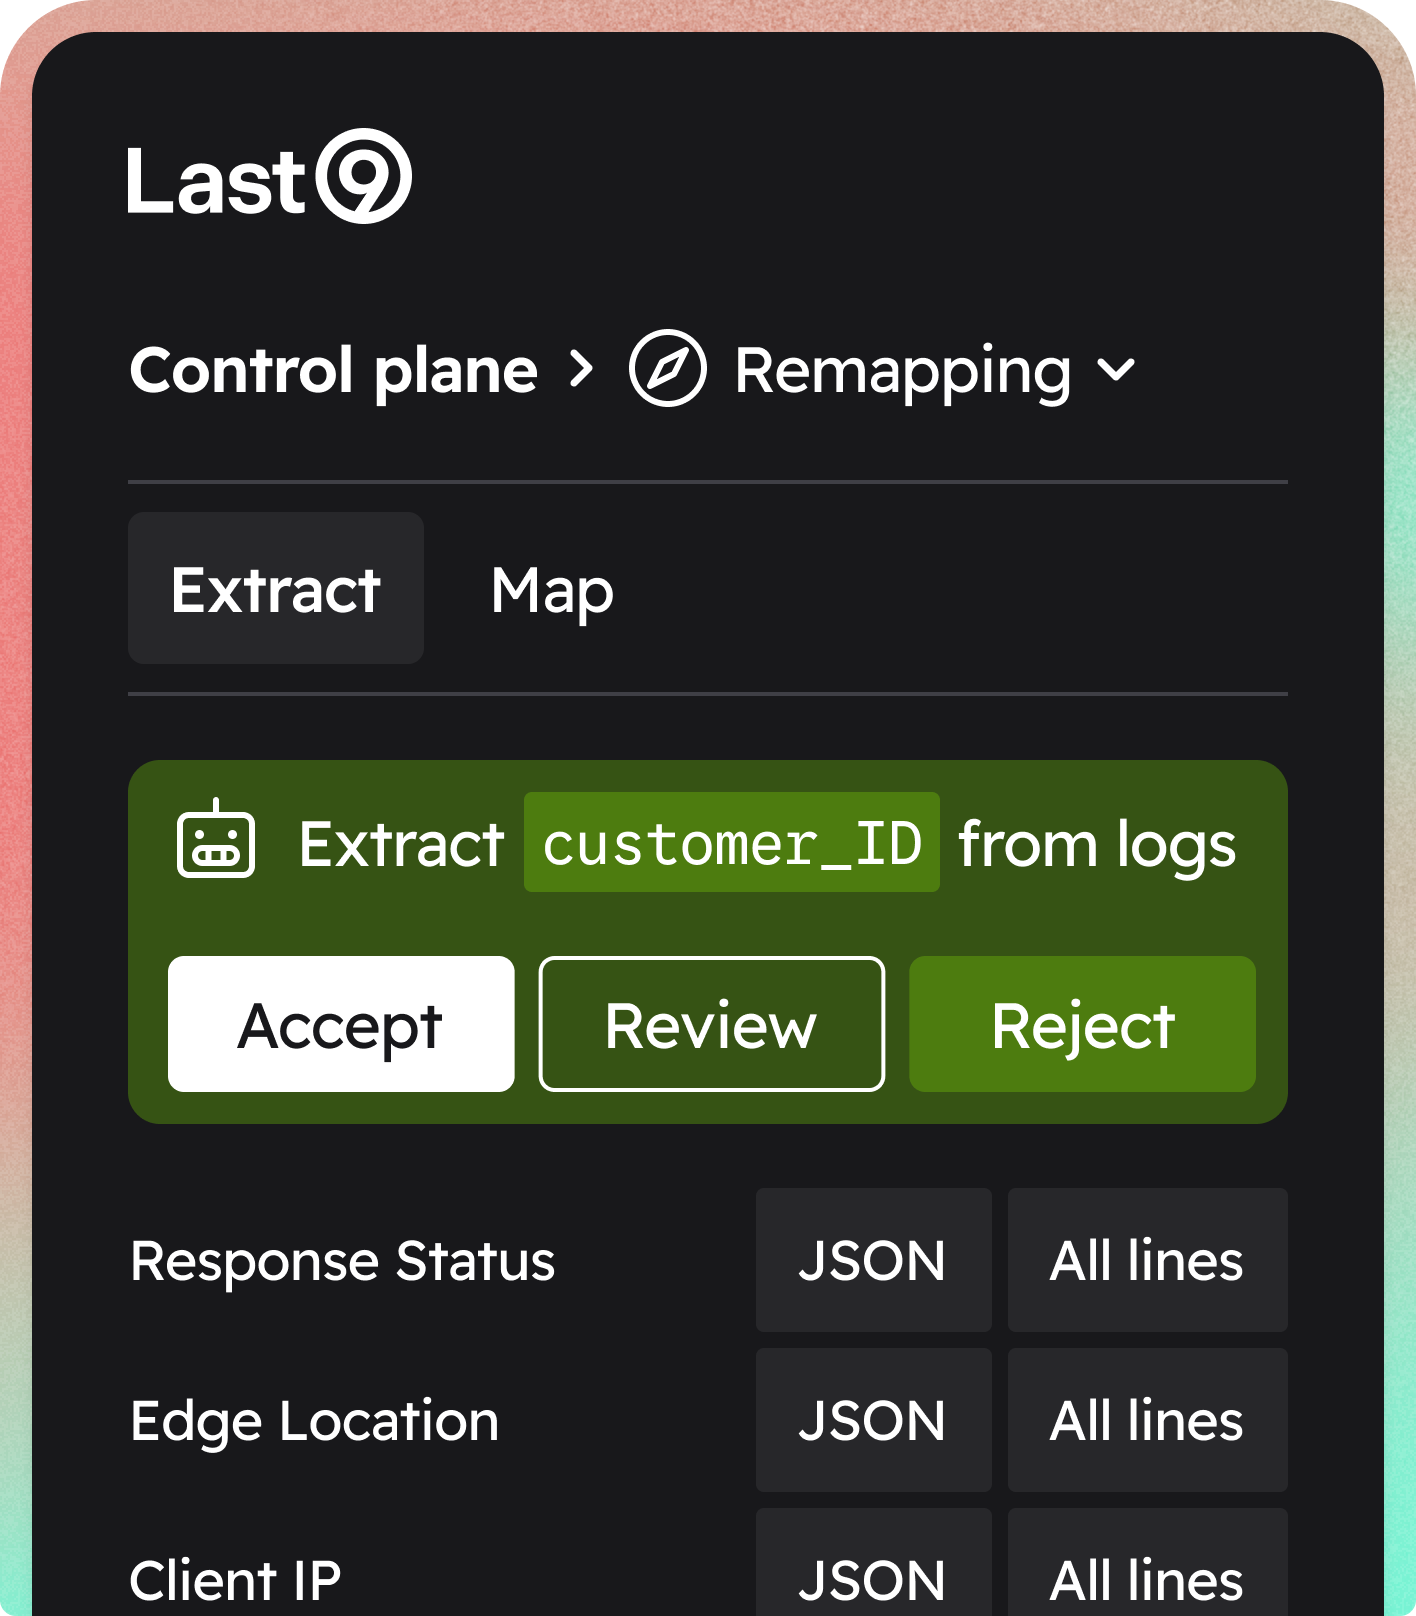
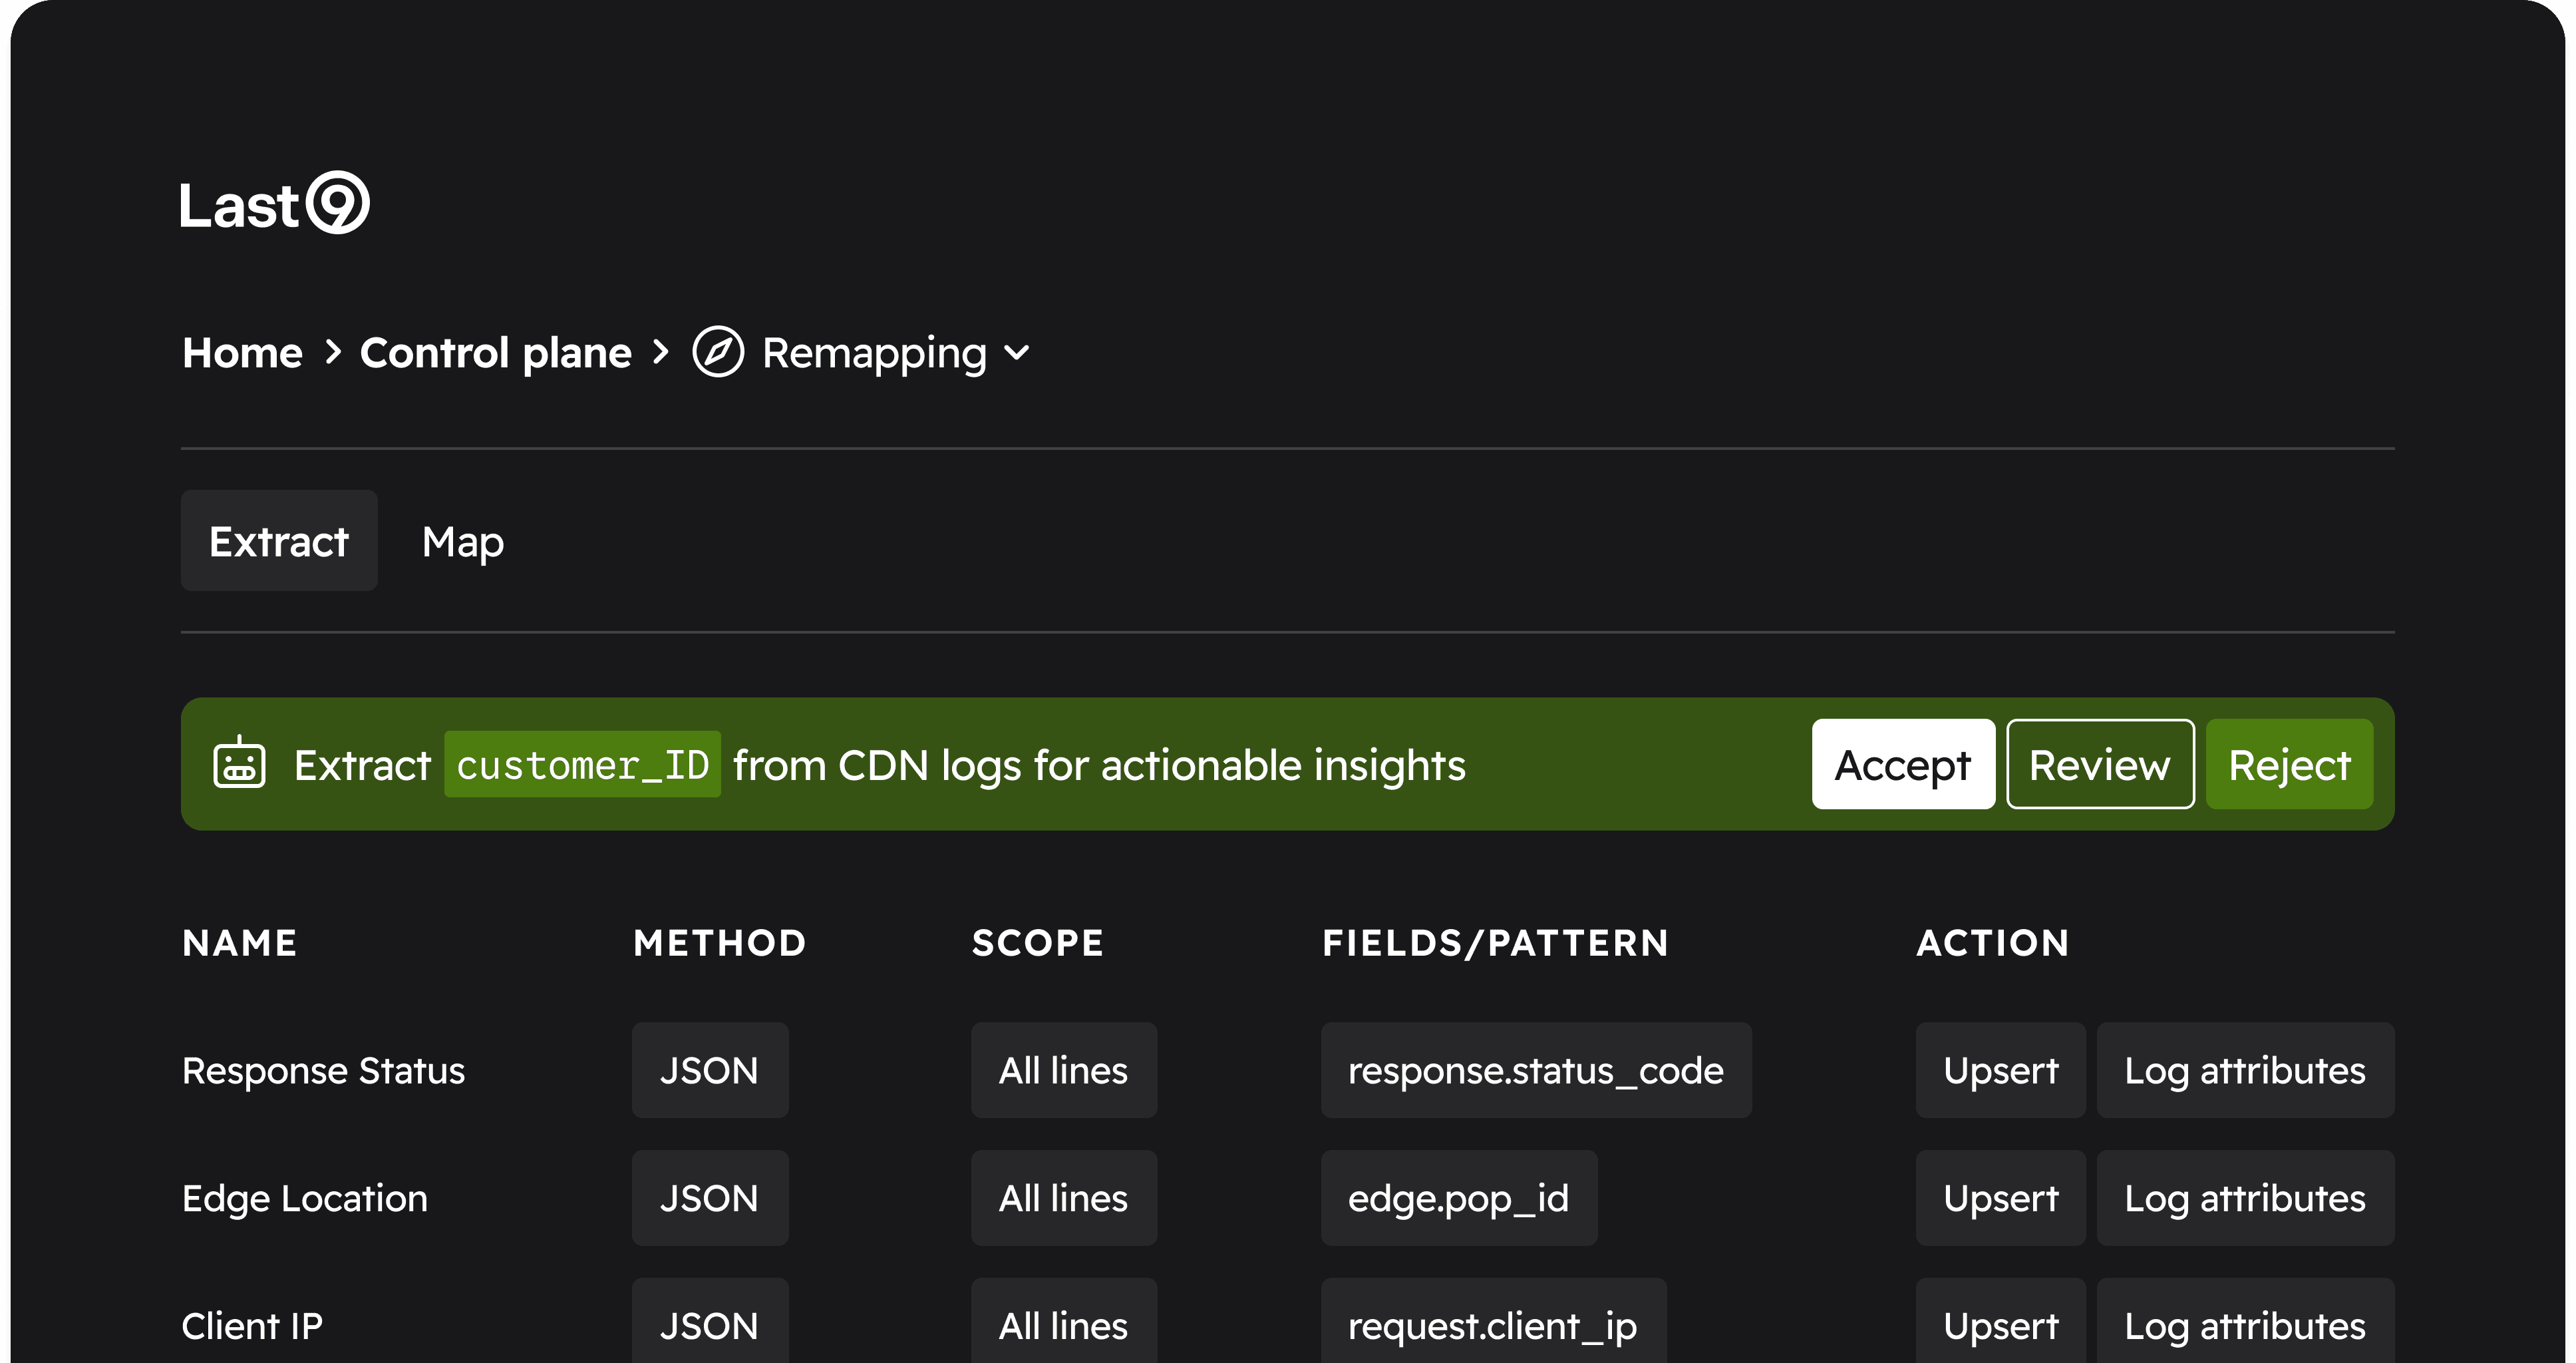
A single control plane to manage telemetry pipelines across logs, metrics, and traces — route, transform, and apply cost controls before data hits storage.
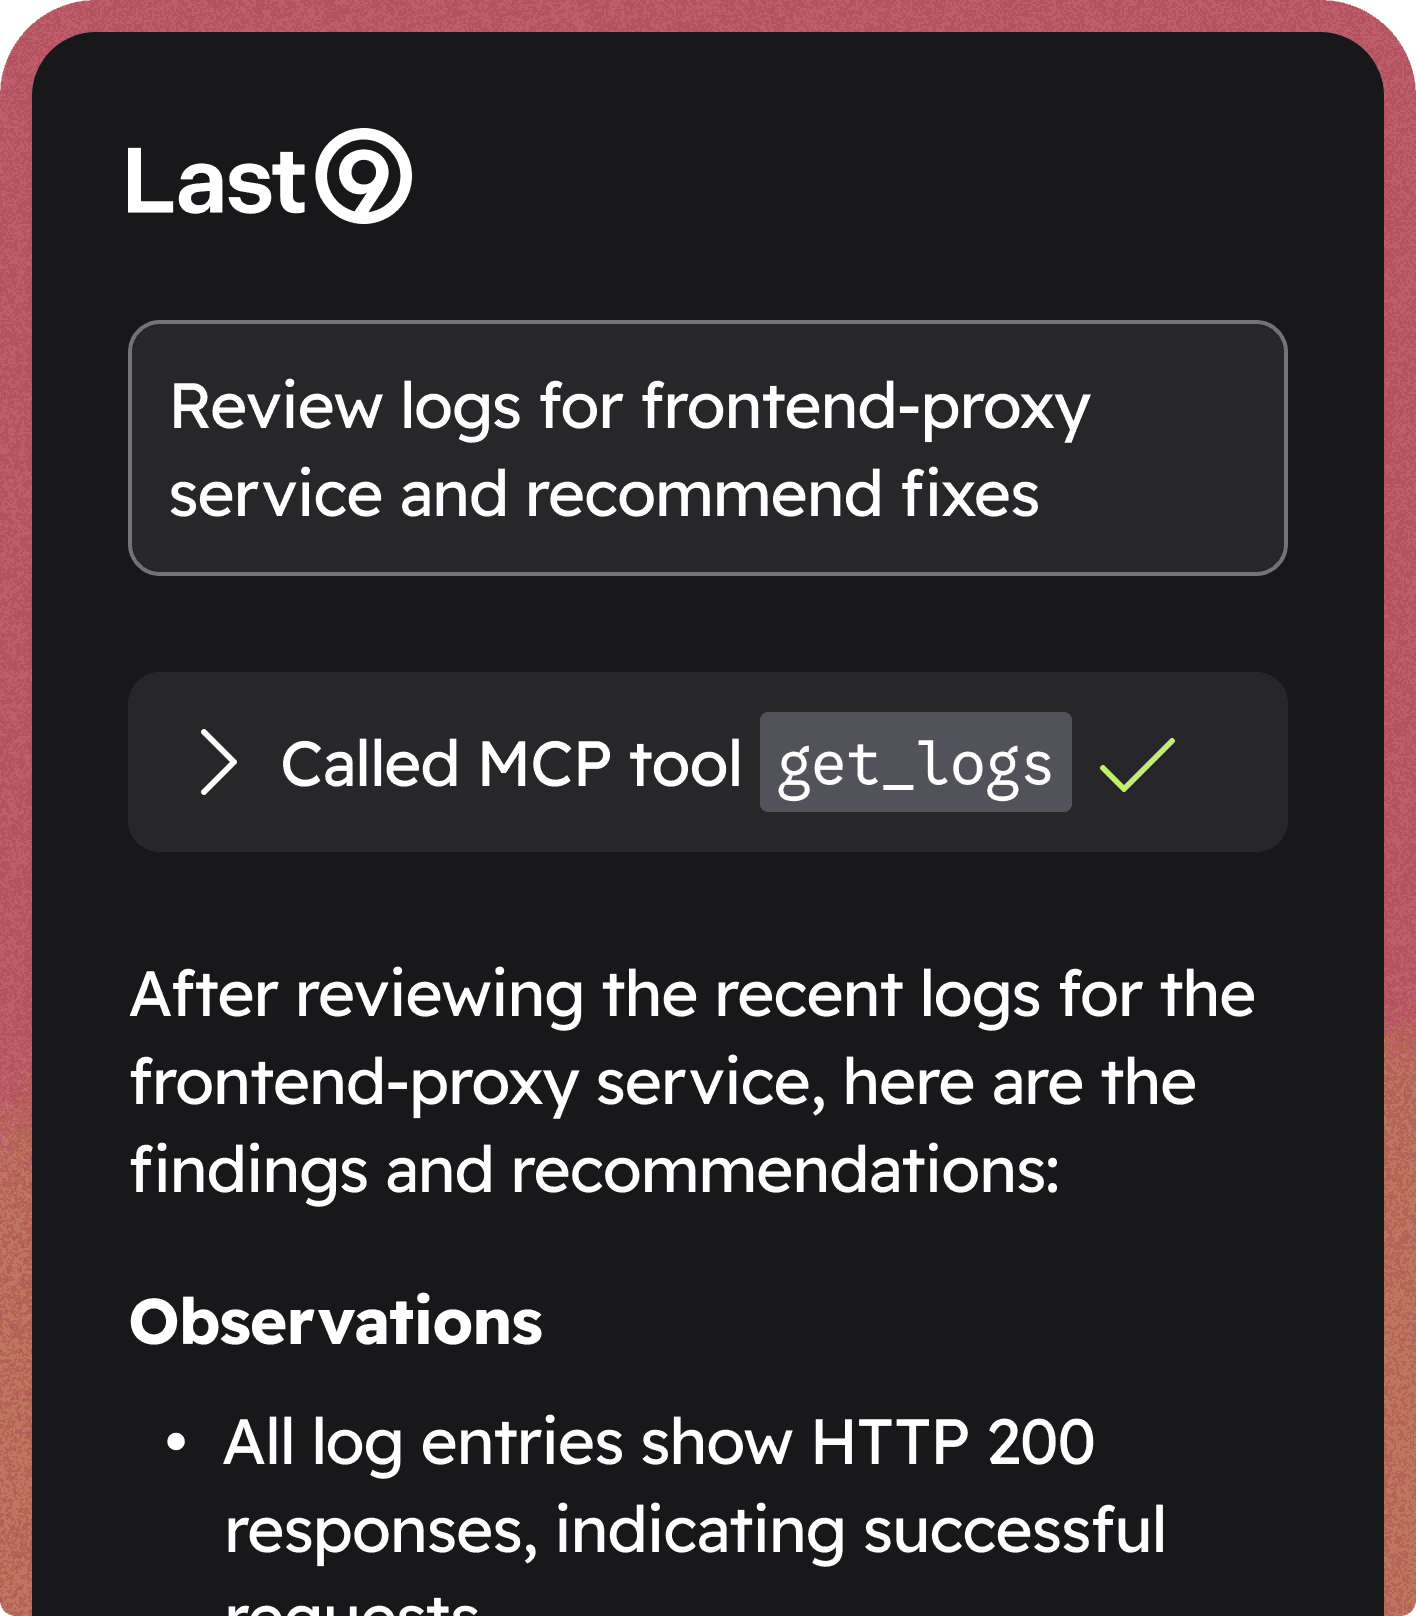
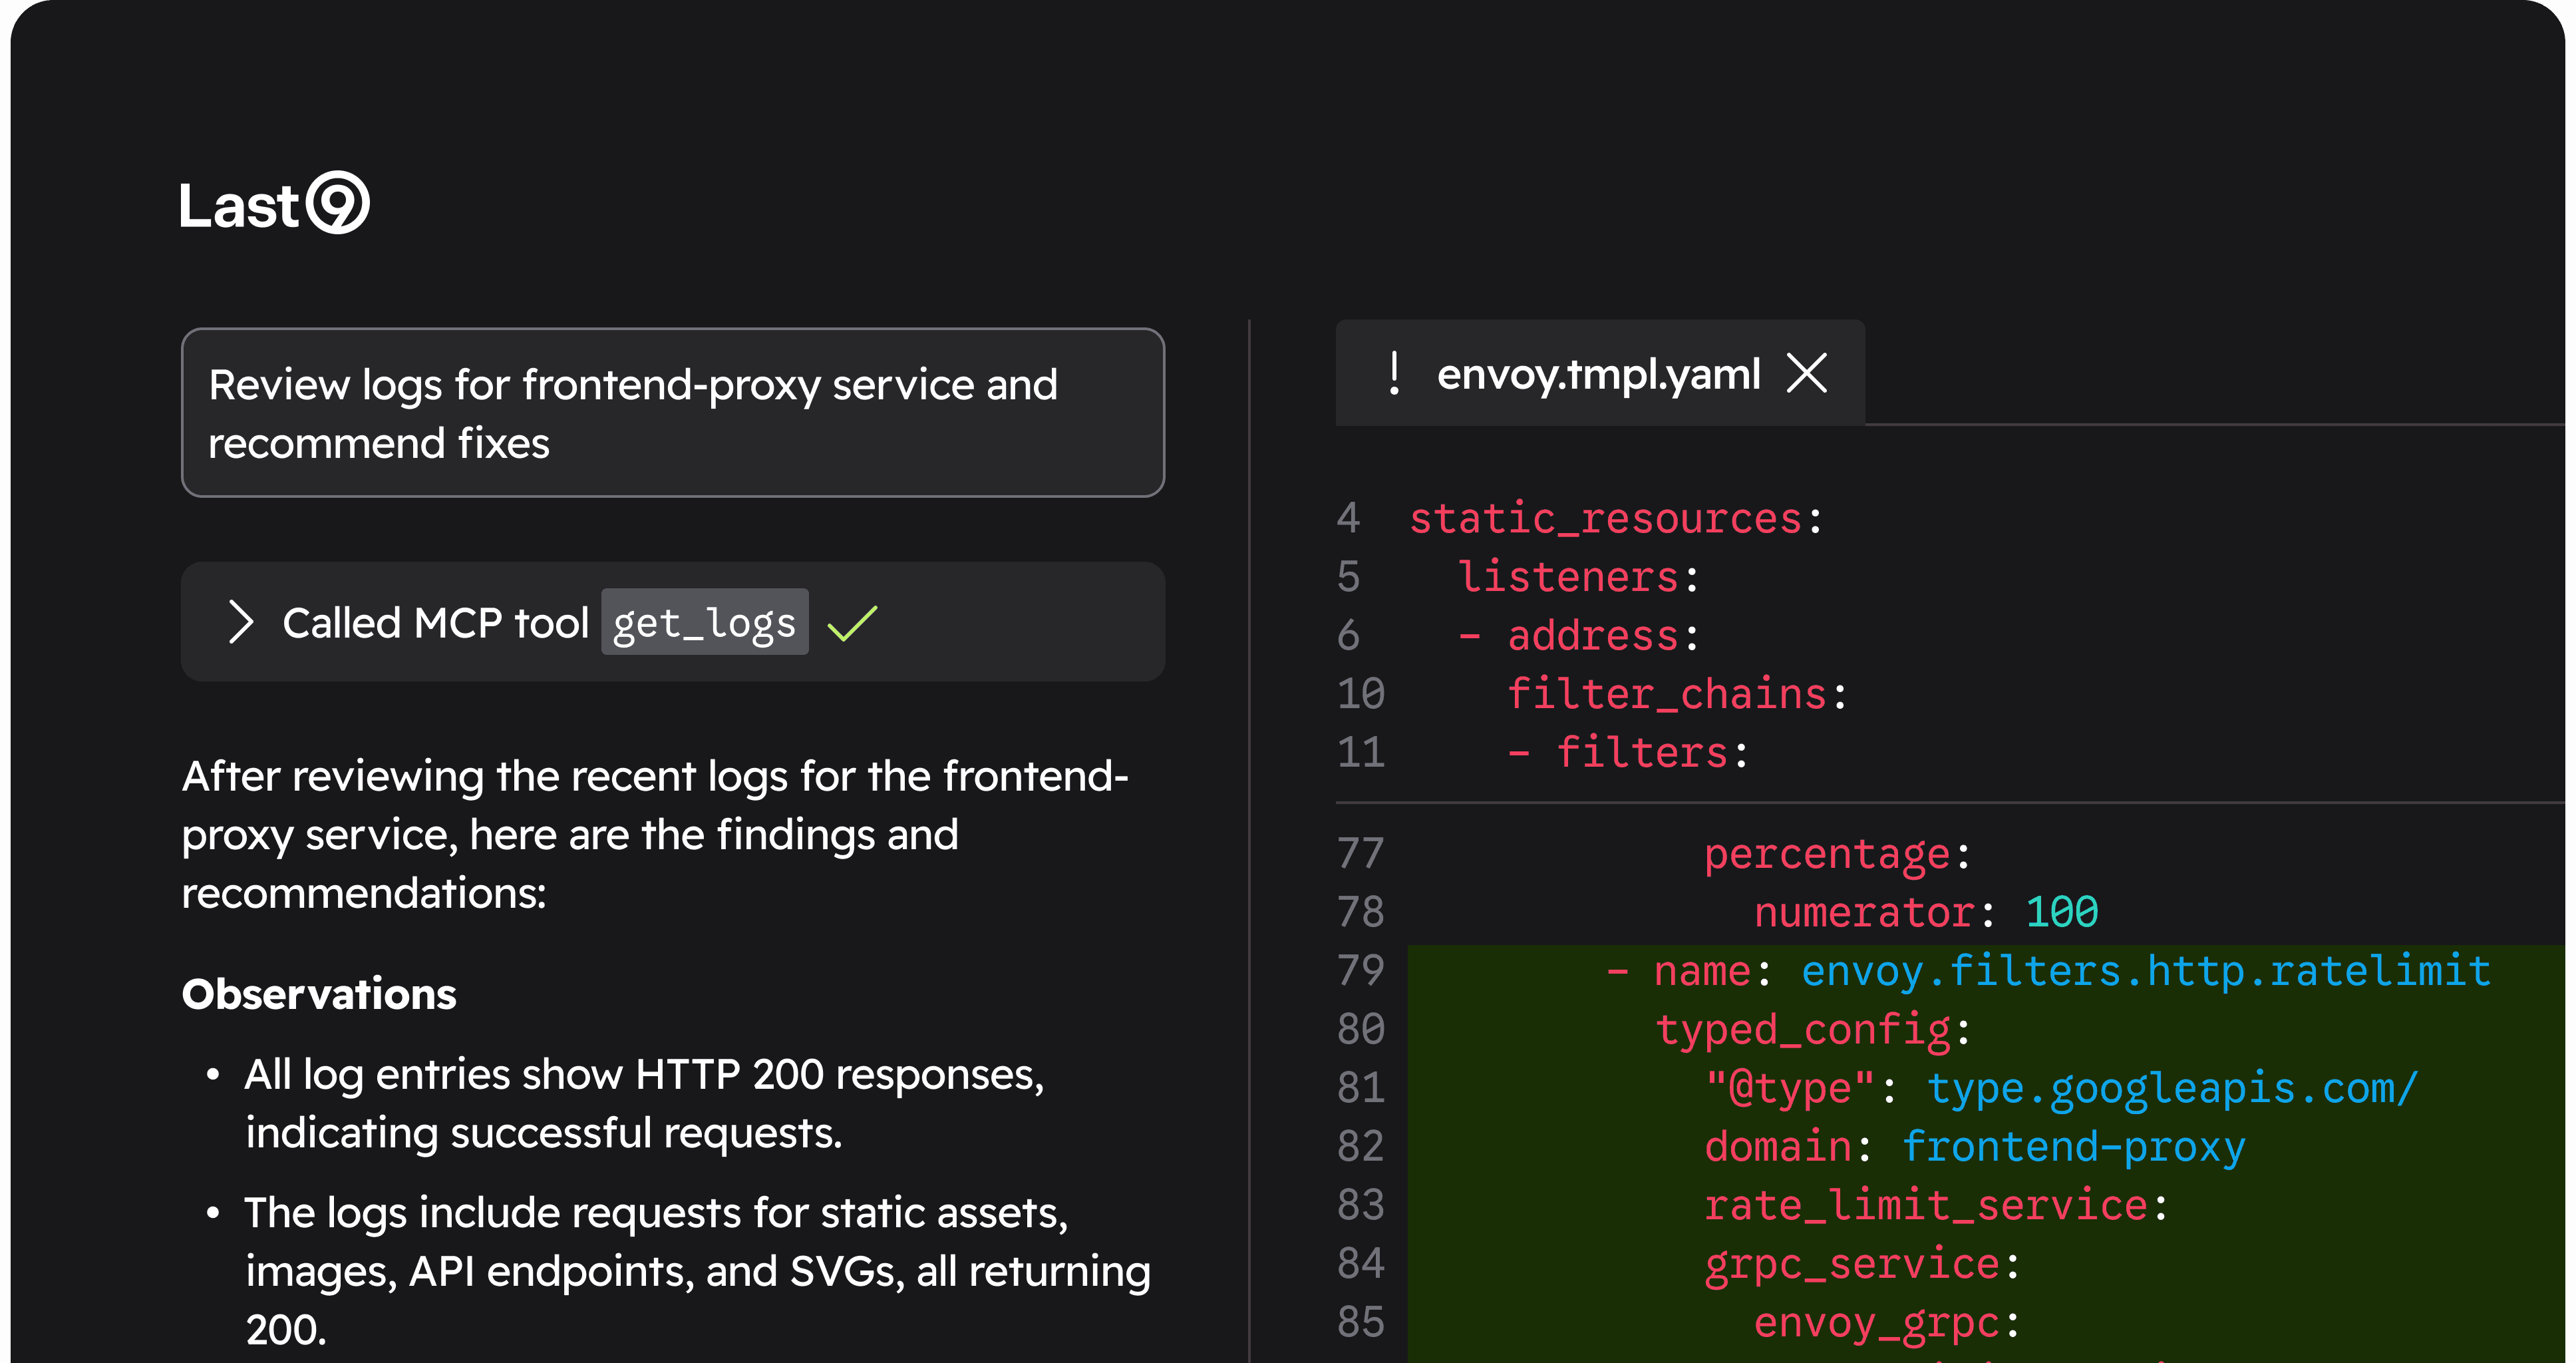
An AI-native developer experience with an MCP server, so coding agents and SREs can query telemetry, triage incidents, and remediate issues directly from their IDE or chat.
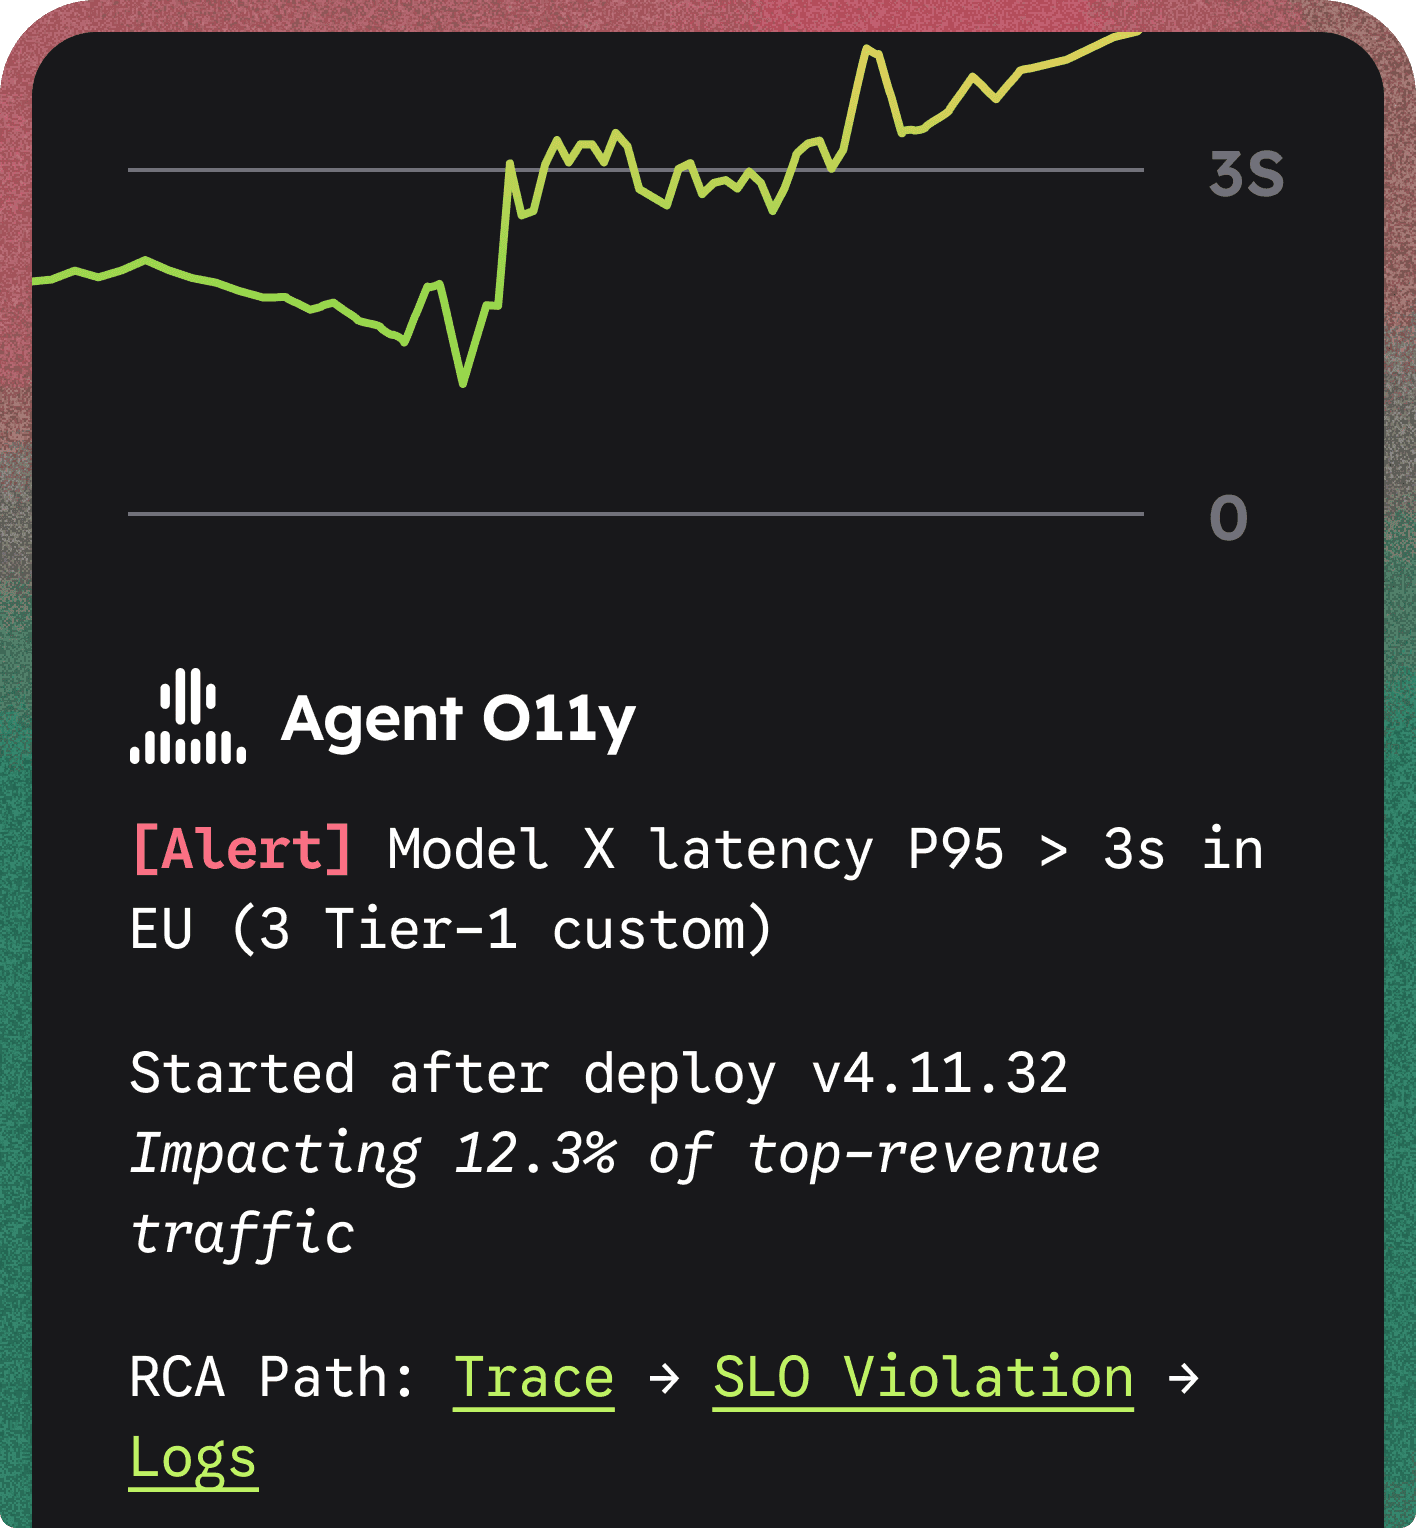
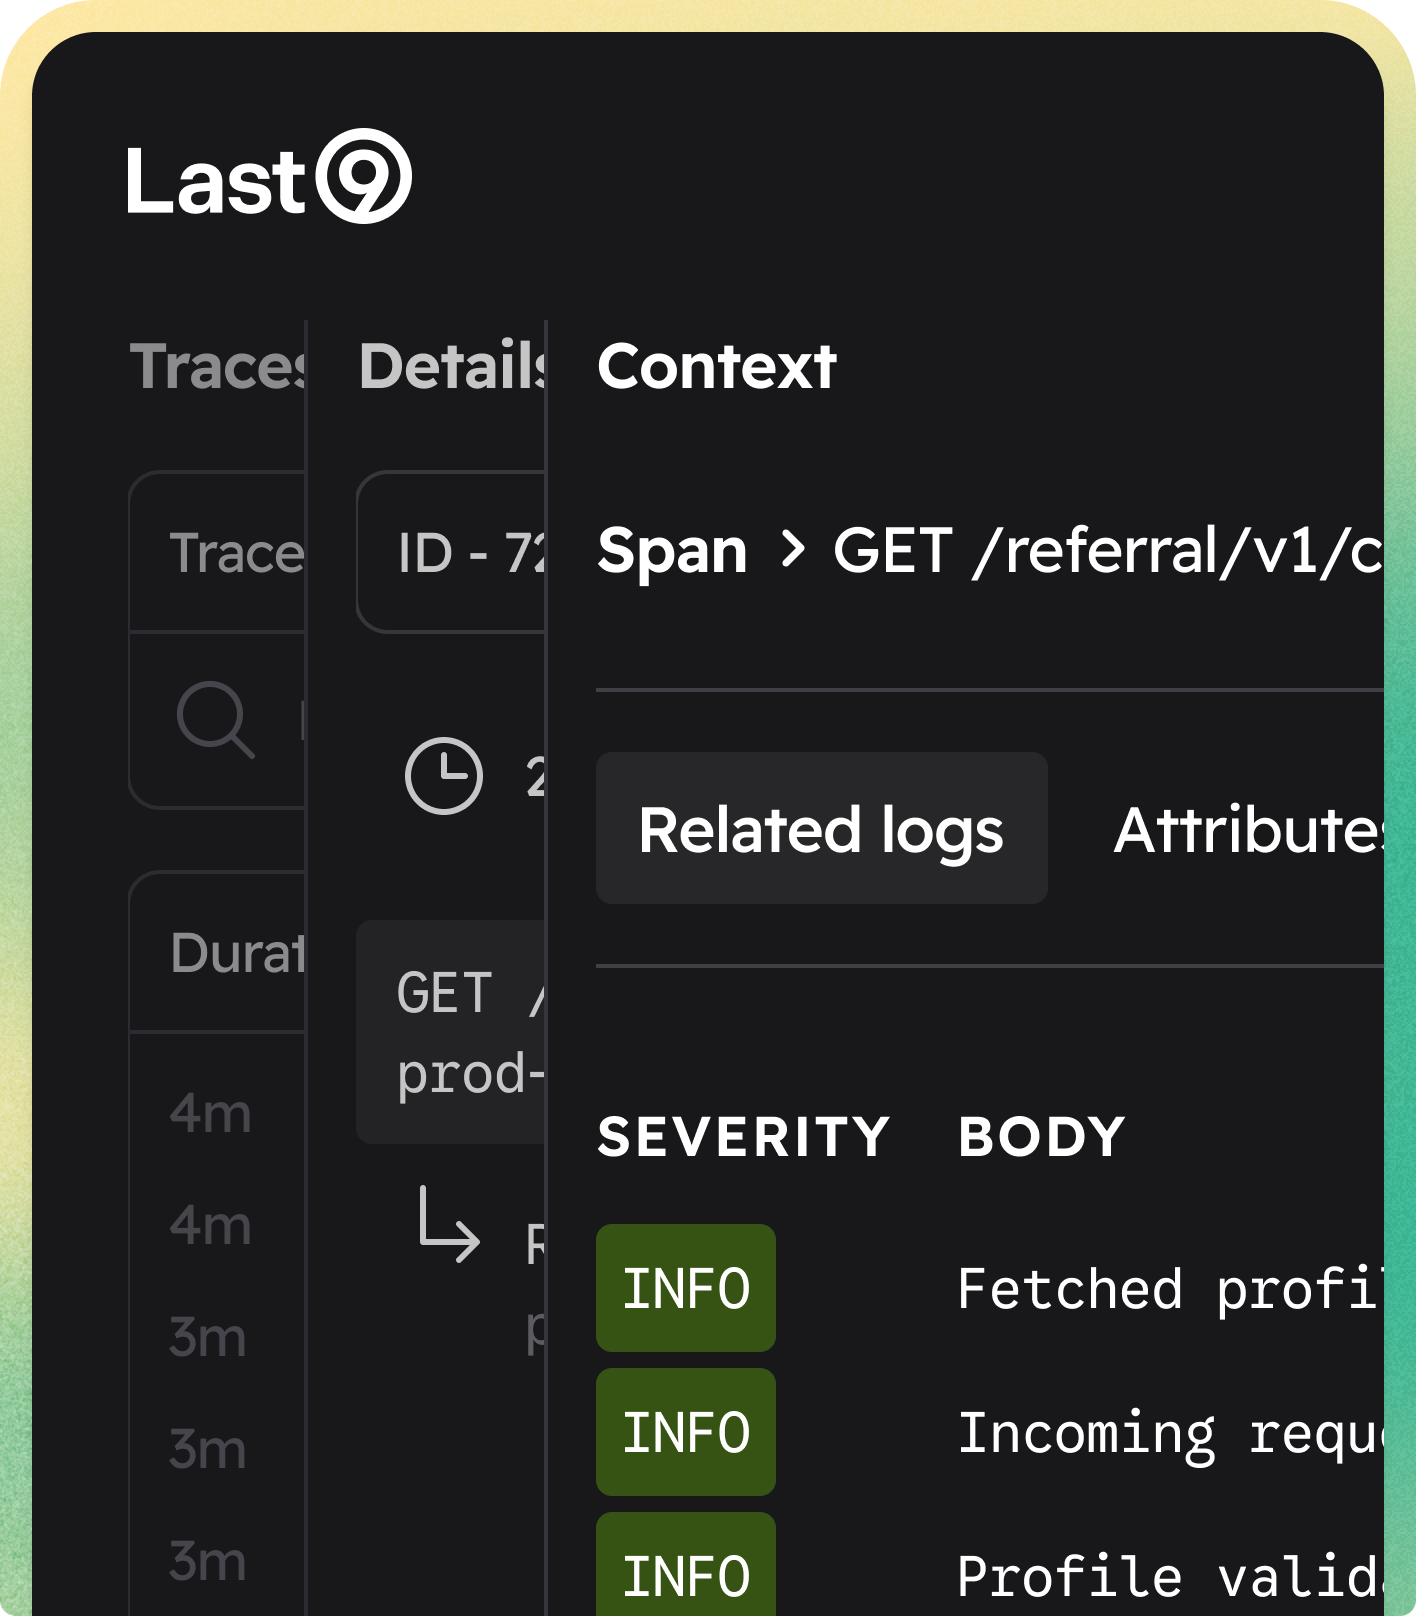
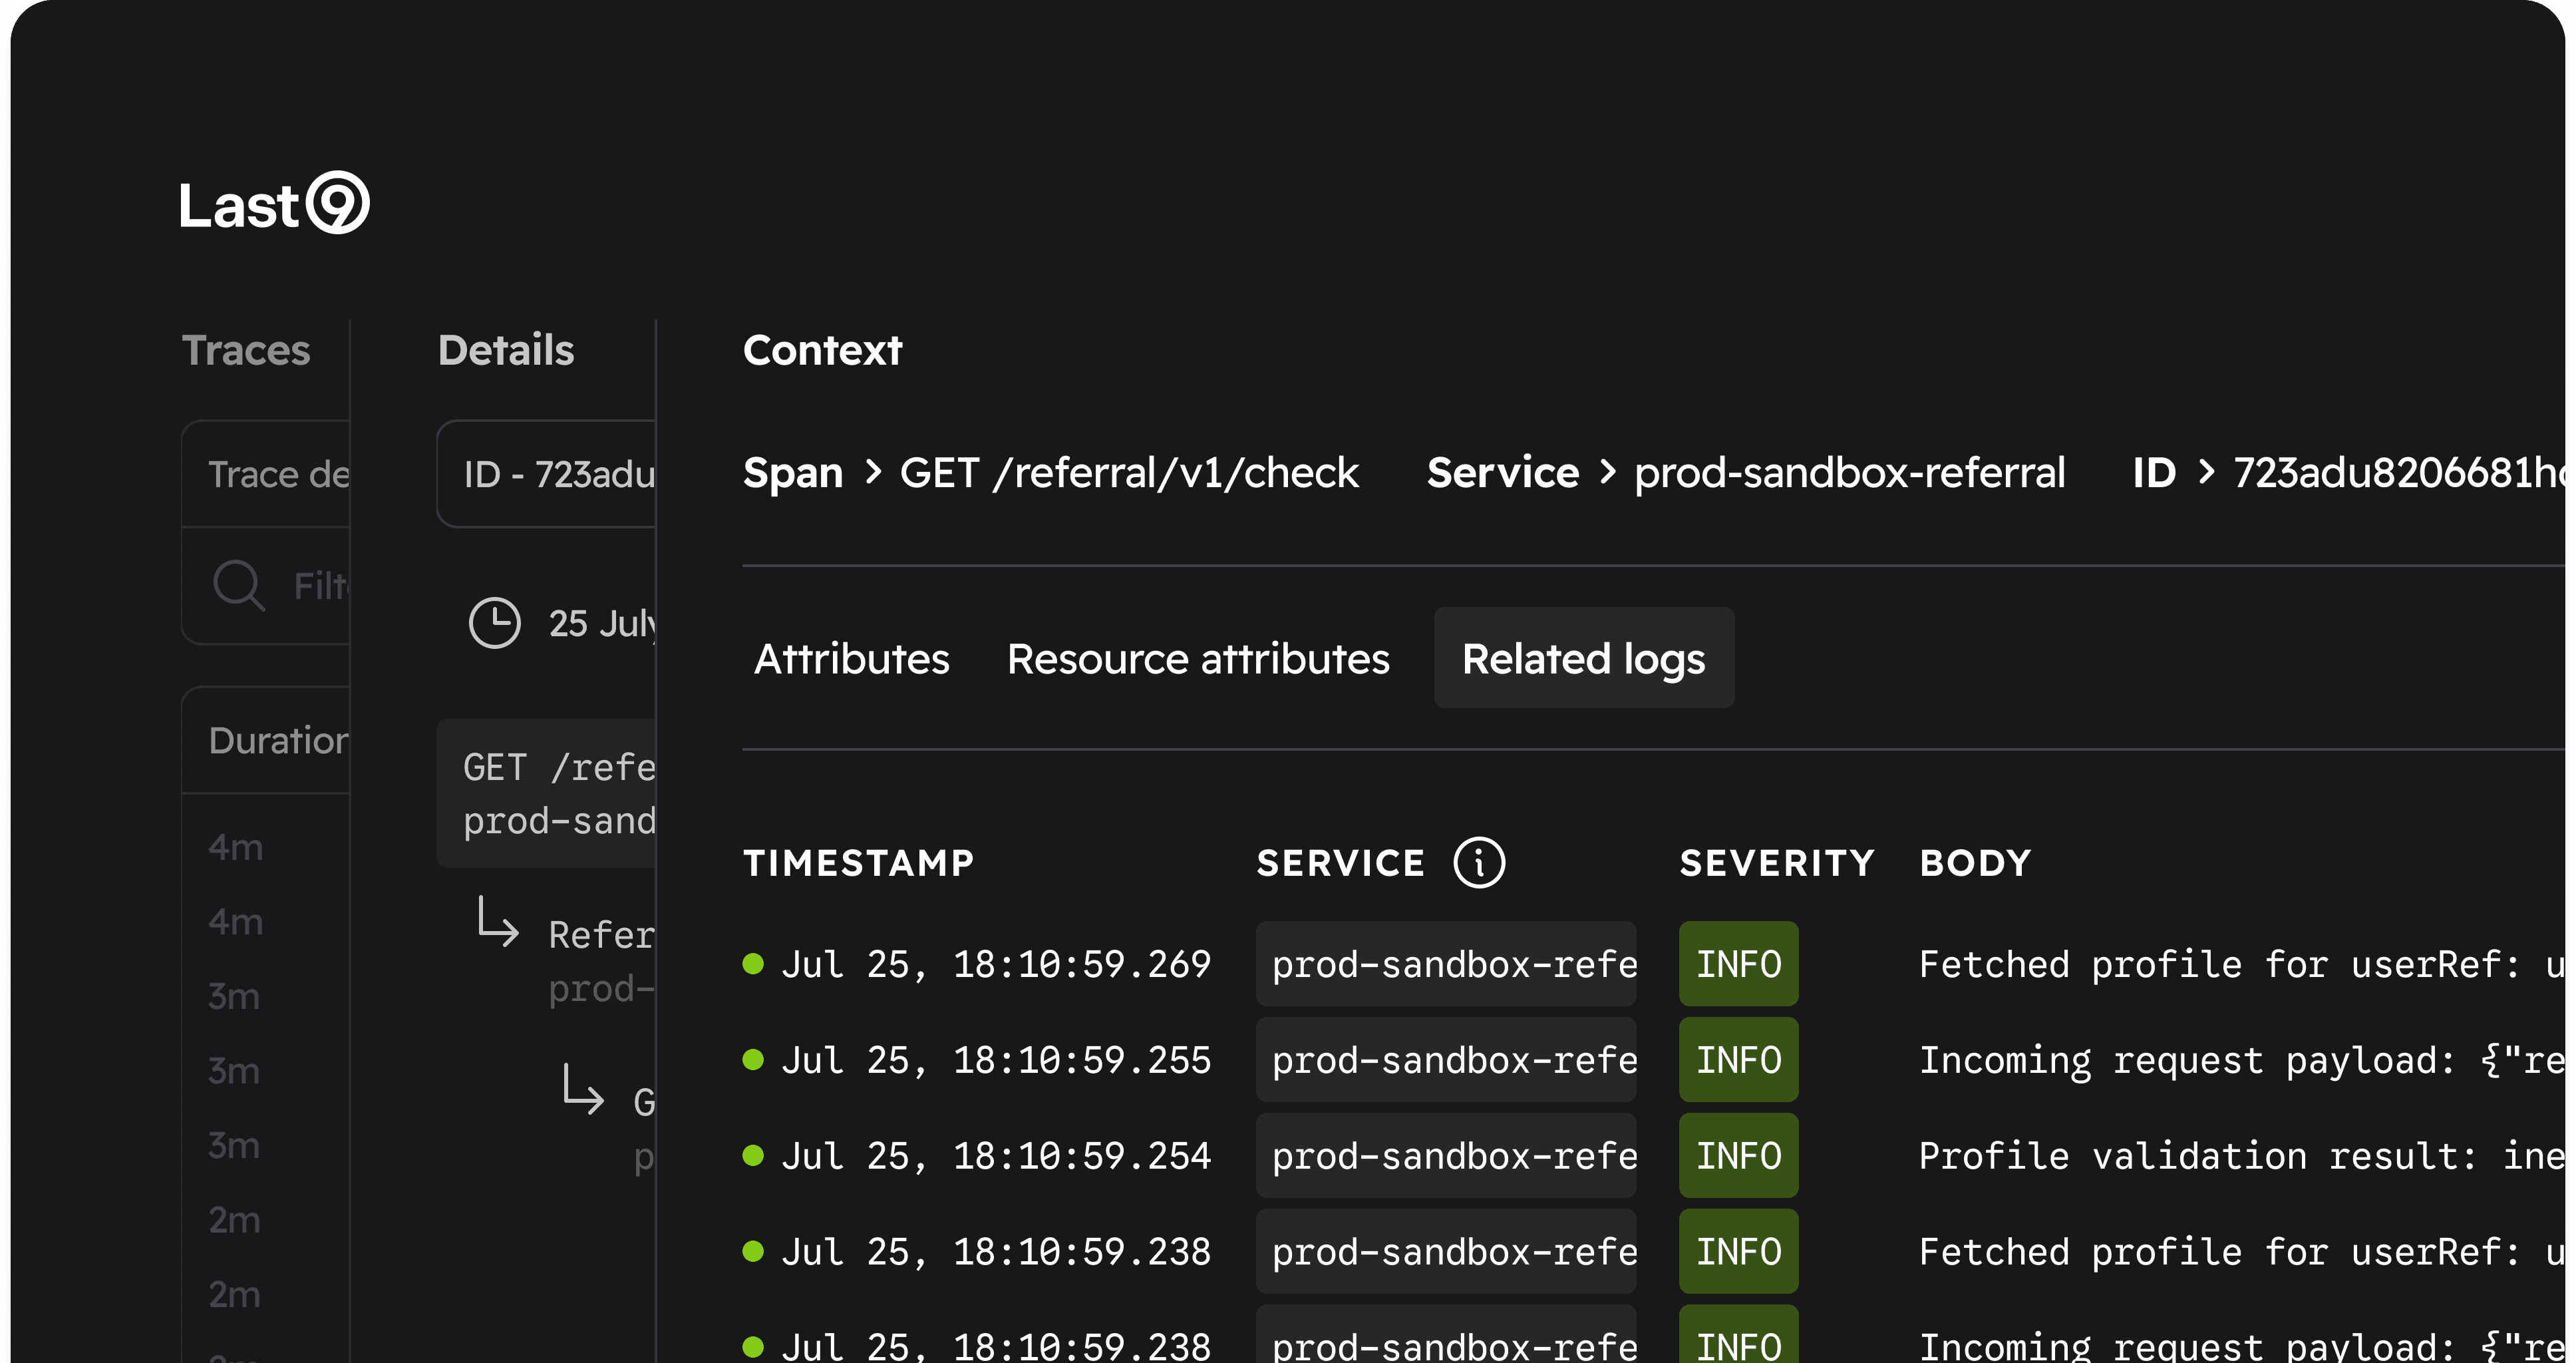
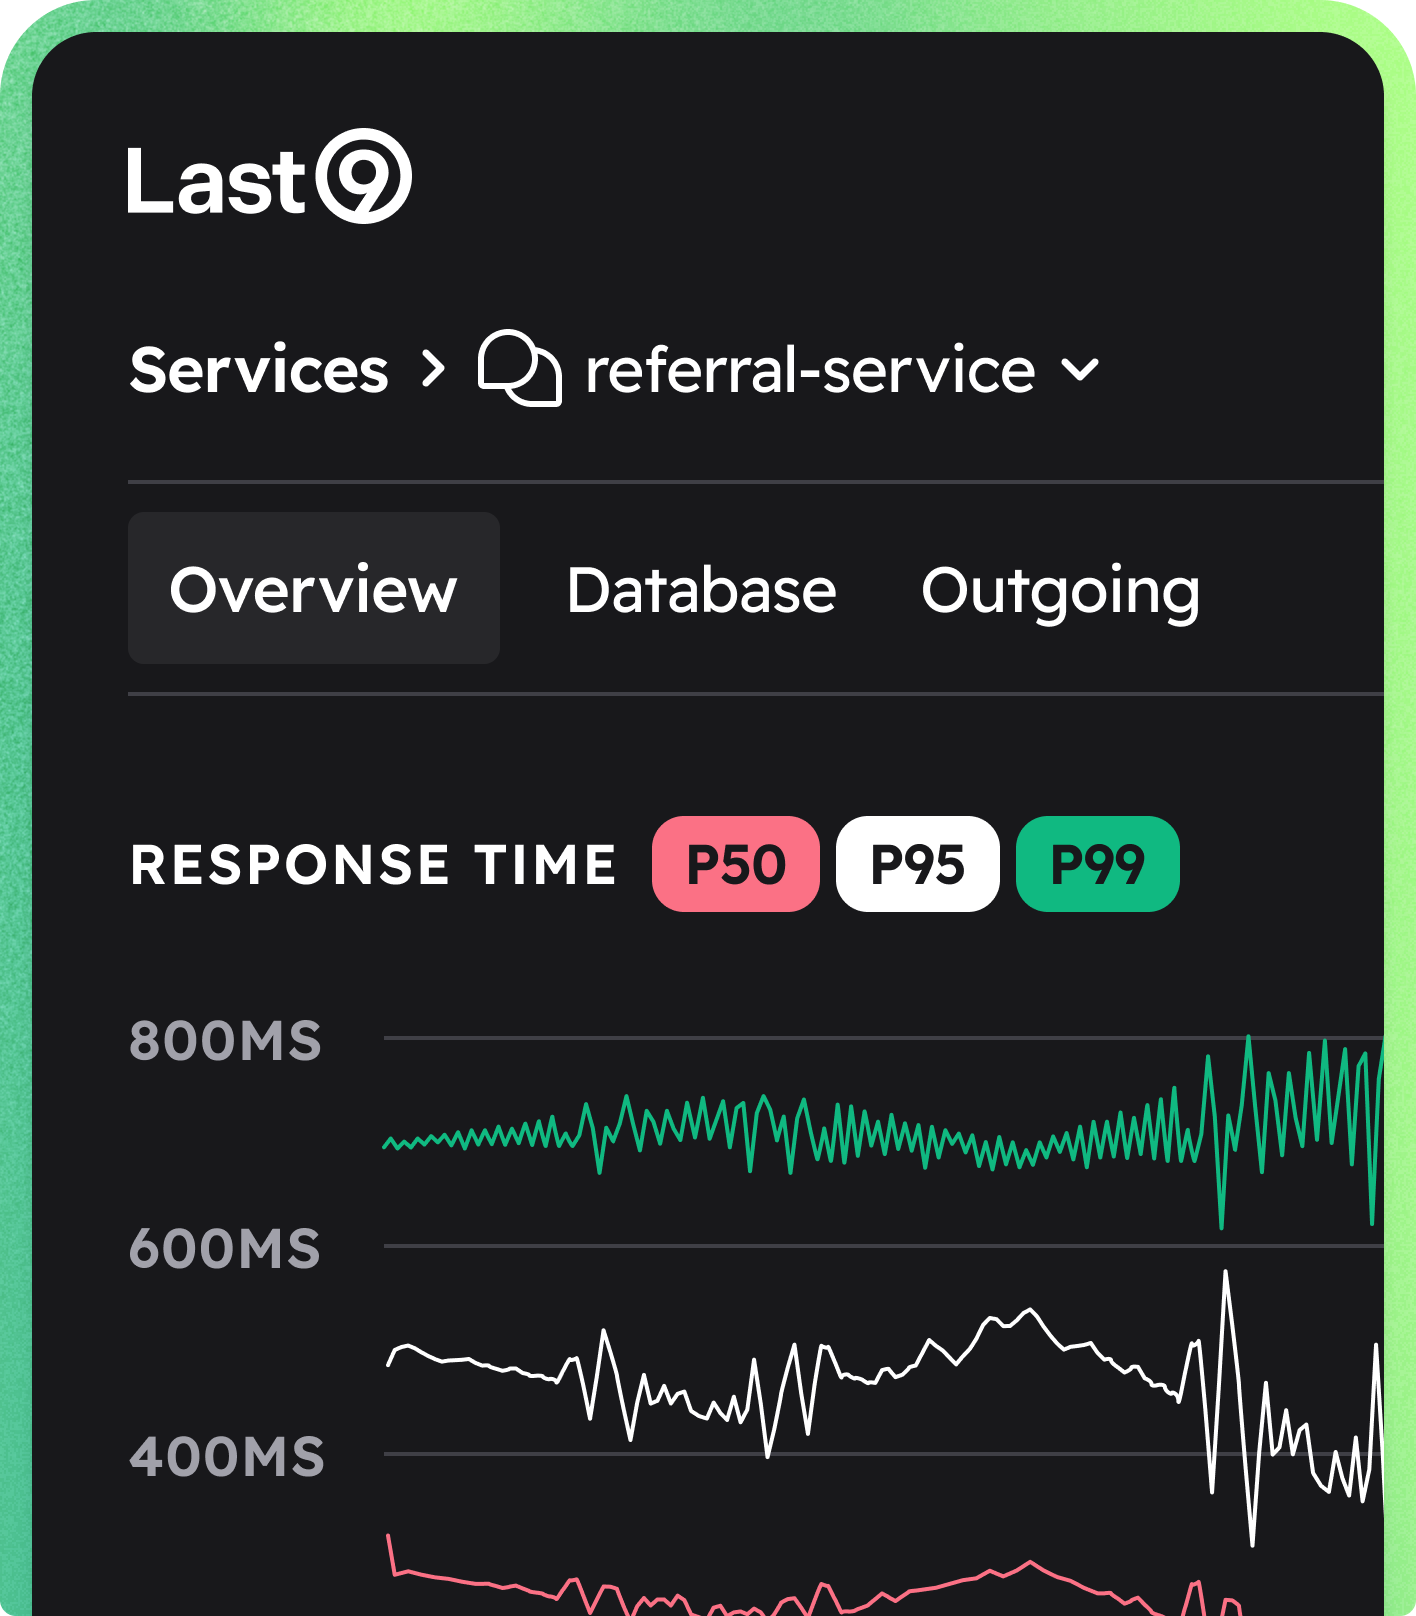
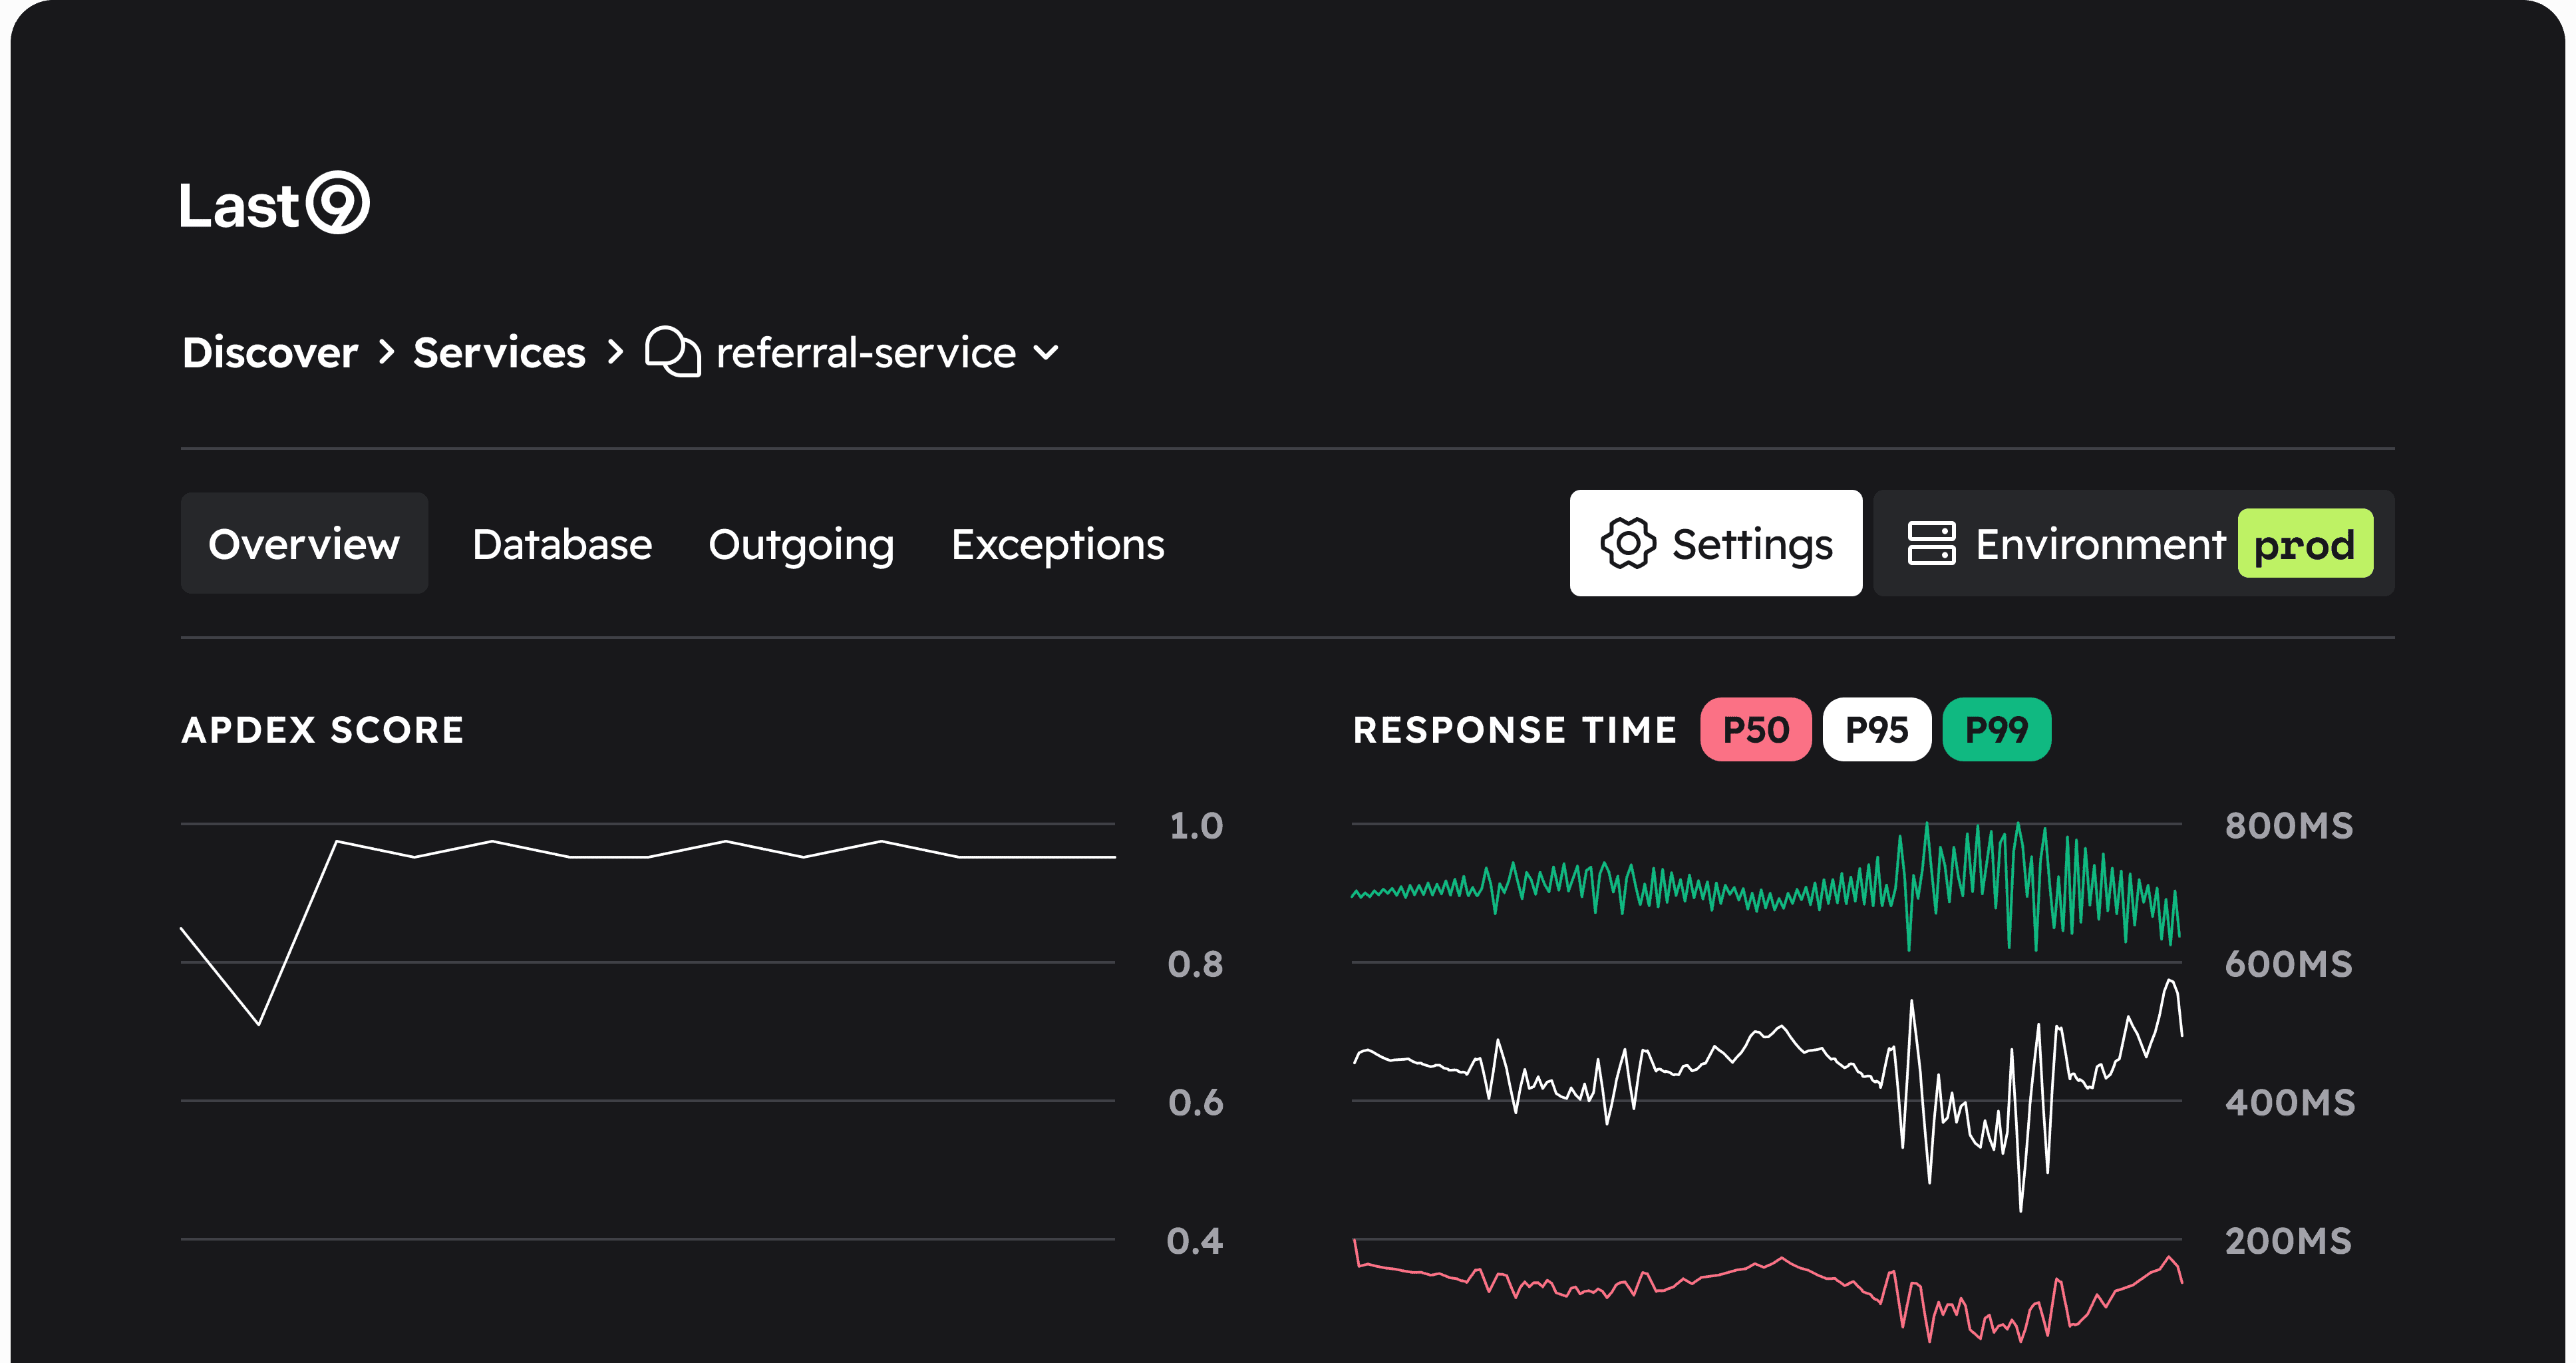
Correlated logs and distributed traces with full OpenTelemetry support — jump from a slow span to the exact log lines that explain it, with no sampling on errors.
High-cardinality dashboards backed by a Prometheus-compatible query engine — slice by any label without pre-aggregation, and share views across teams.
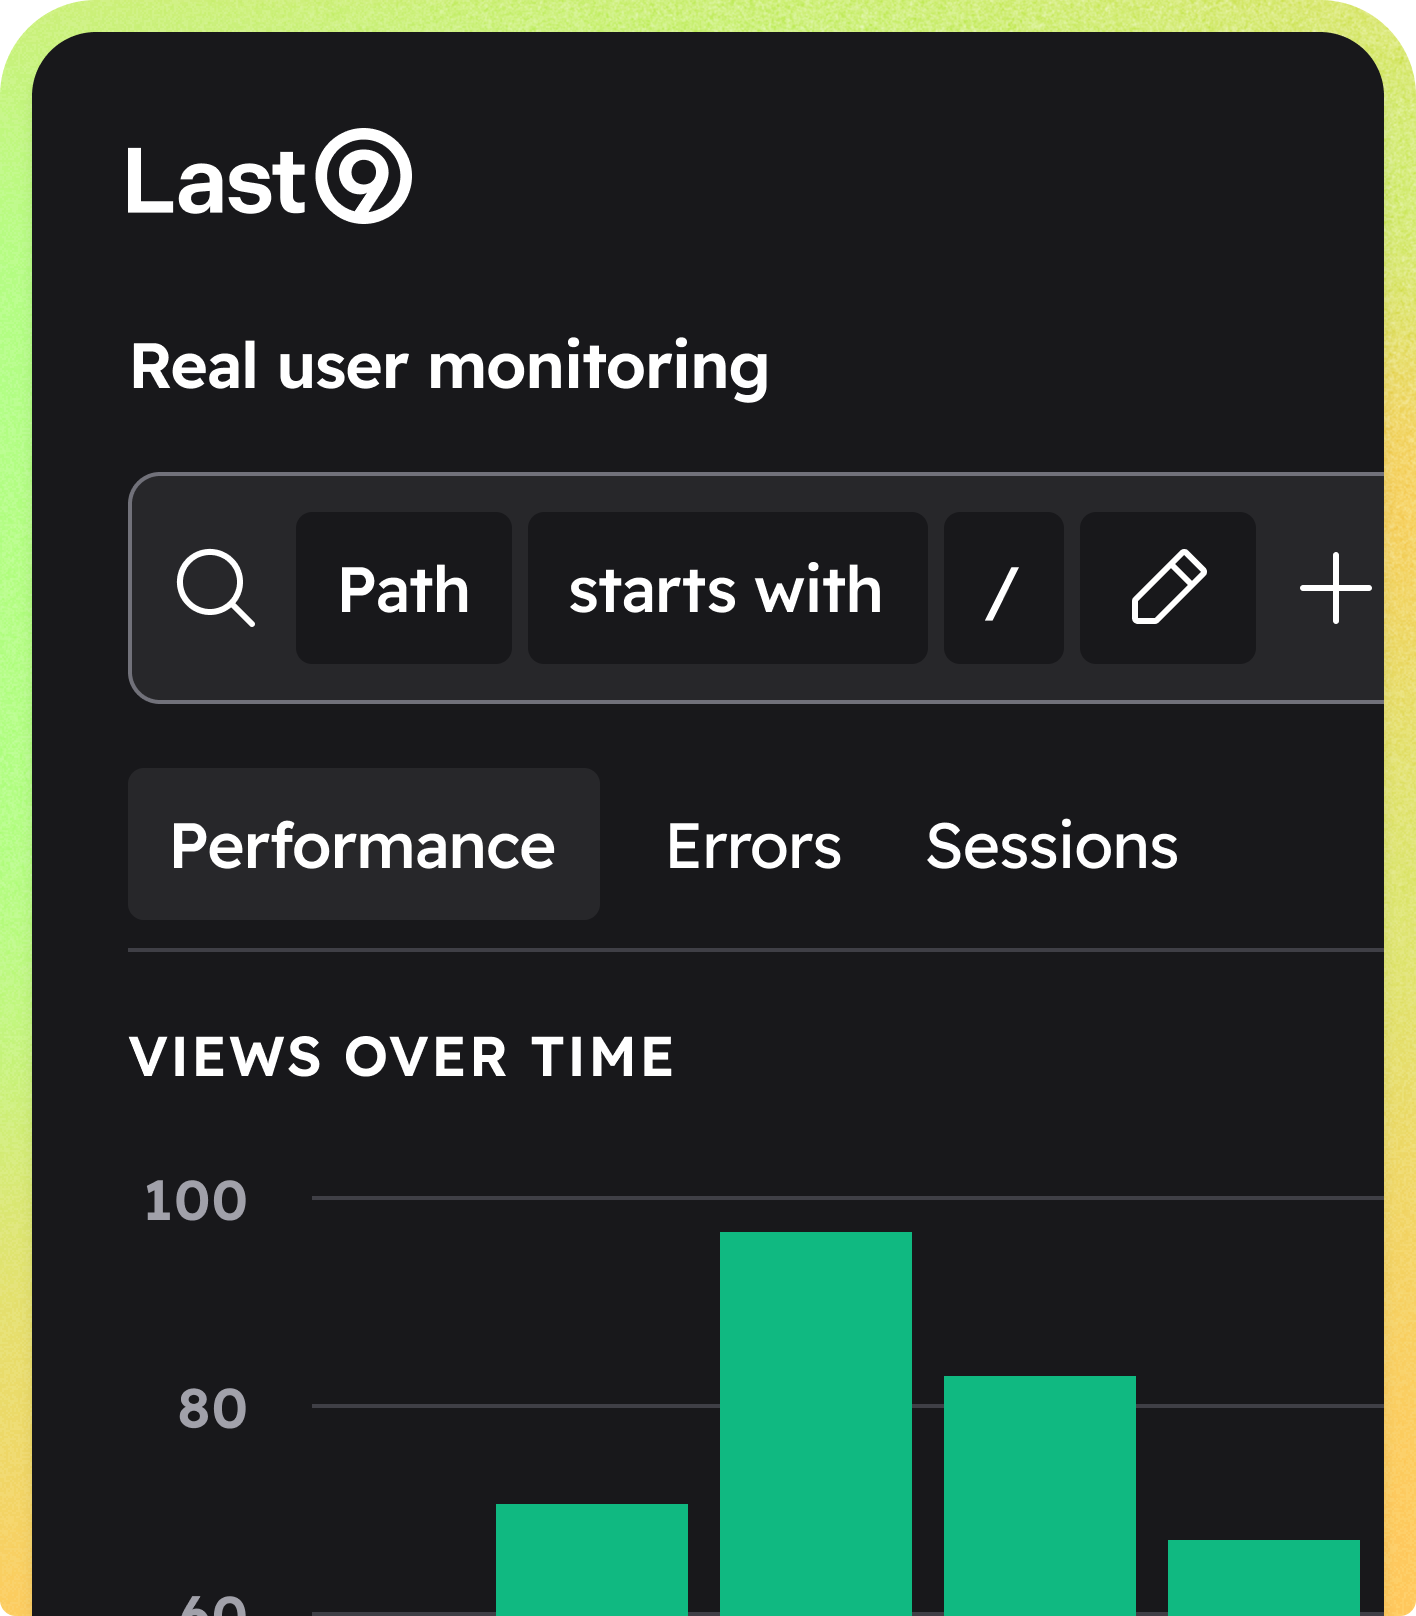
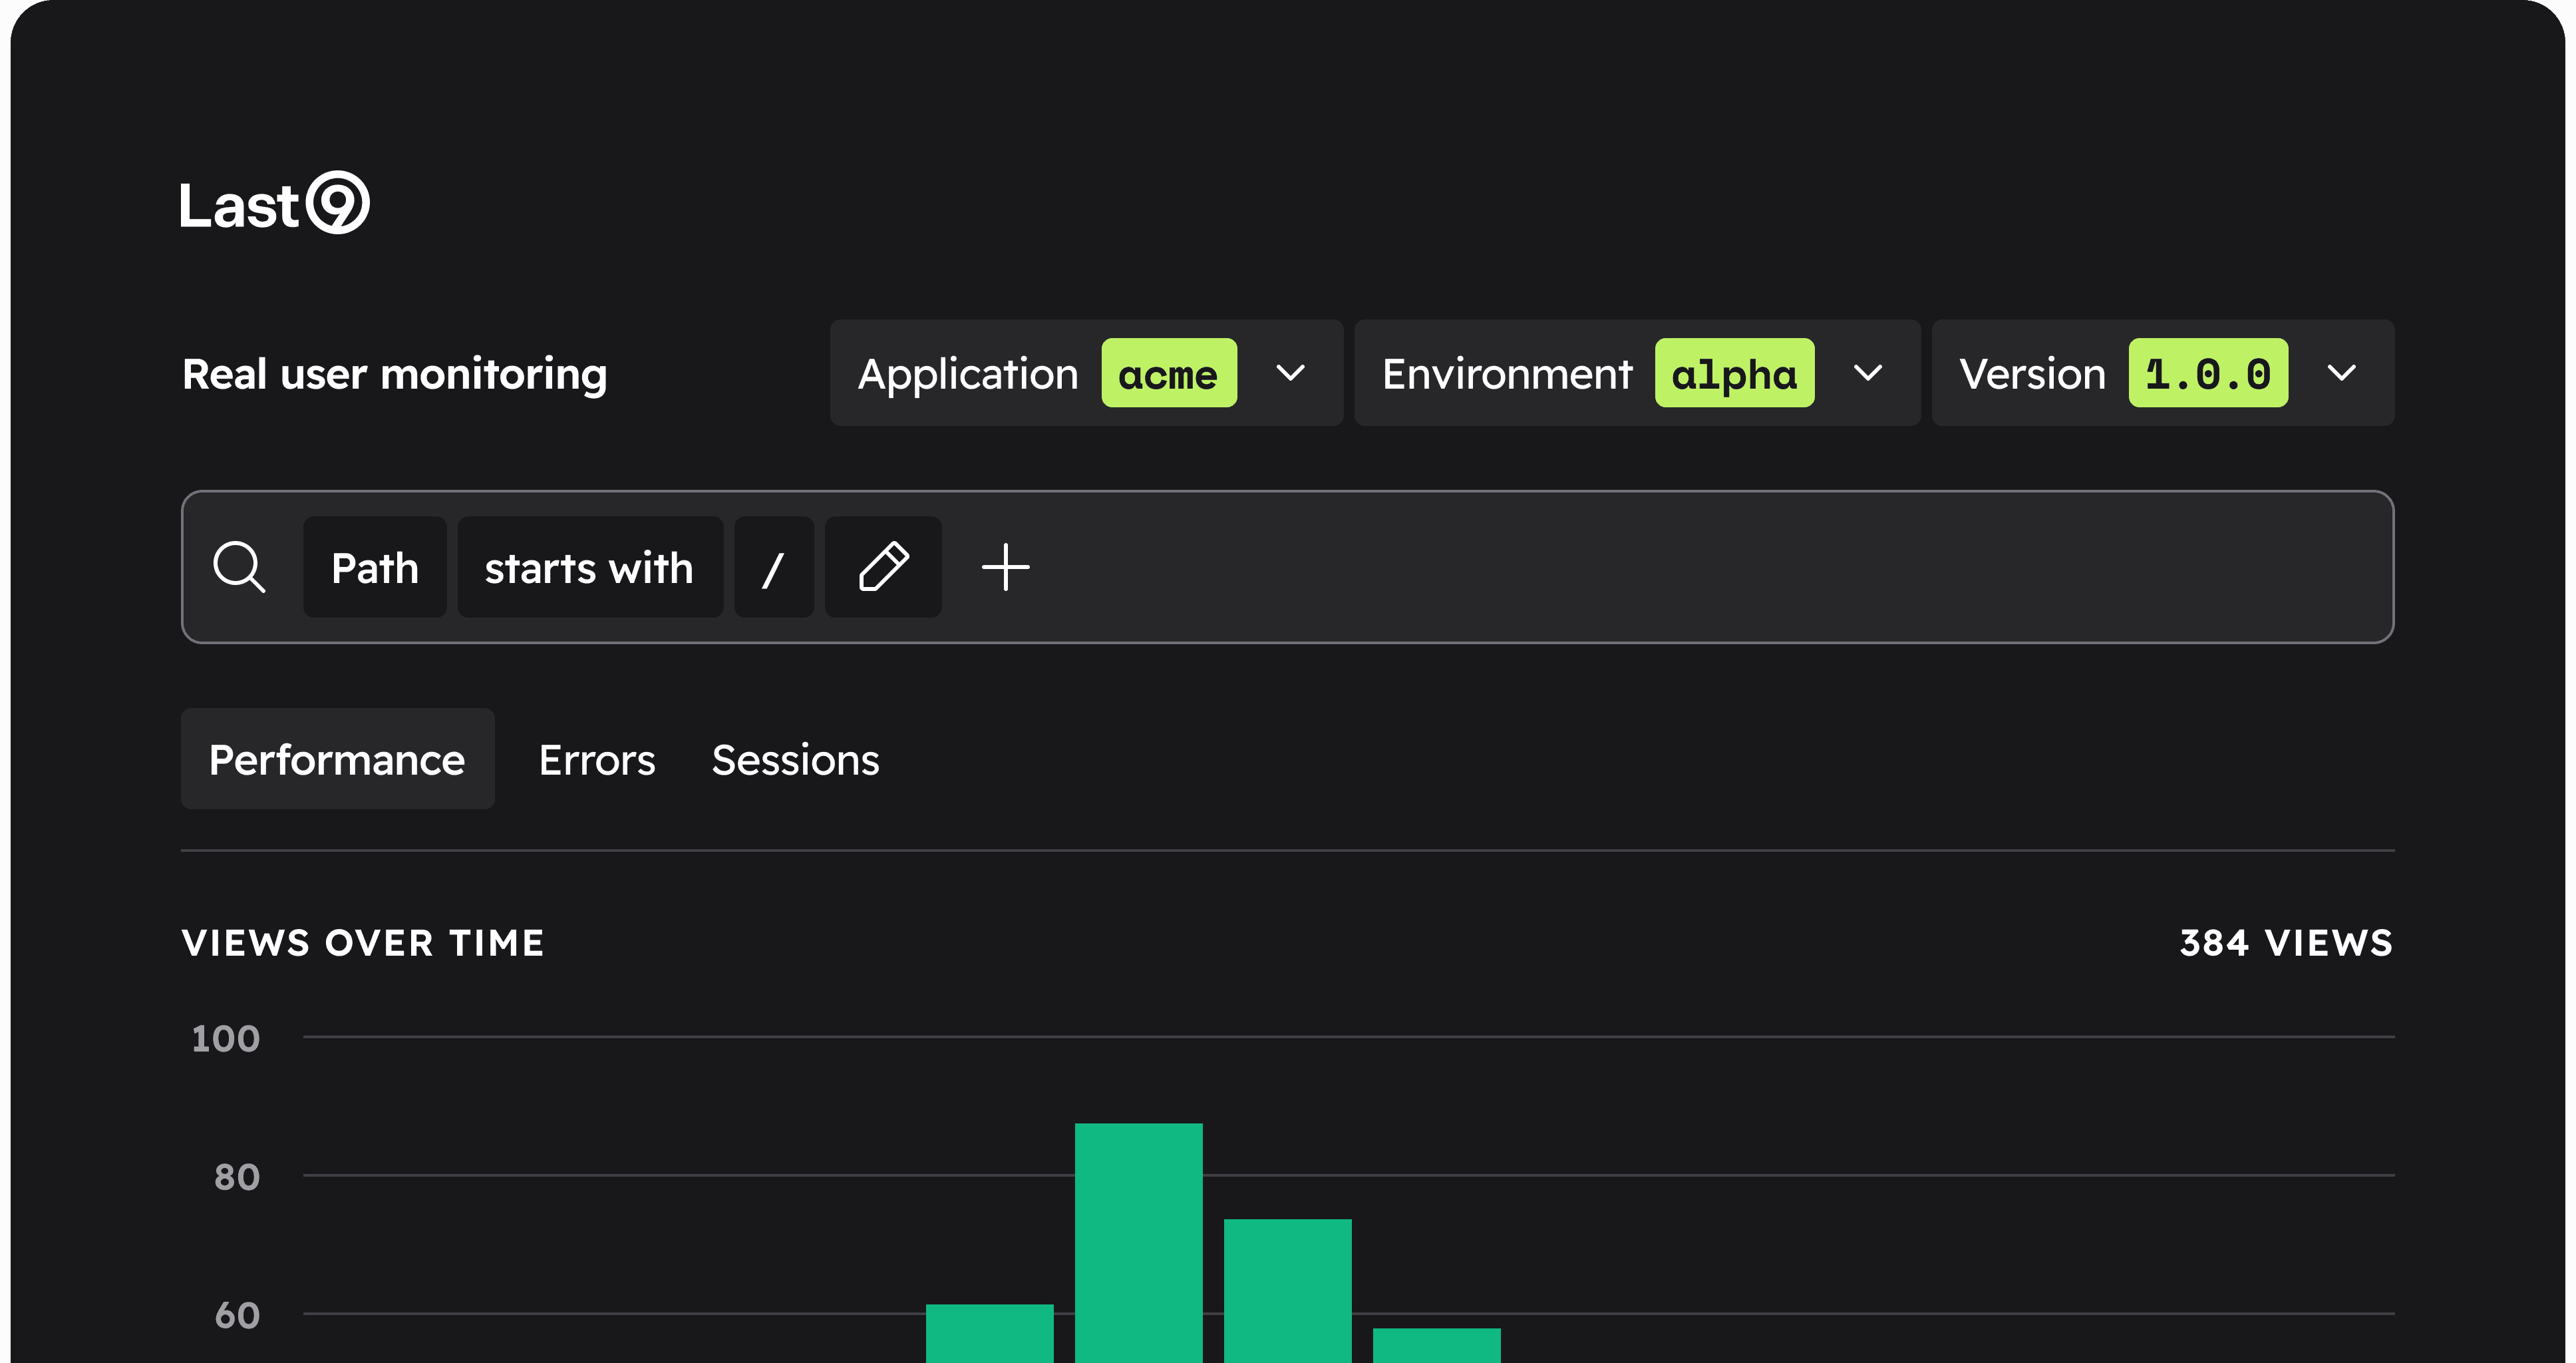
Real user monitoring (RUM) for web and mobile — capture Core Web Vitals, session replays, and frontend errors, then correlate them with backend traces.
Real-time alerting with deduplication, routing, and on-call integrations — define rules in PromQL or our UI and send to Slack, PagerDuty, OpsGenie, and more.
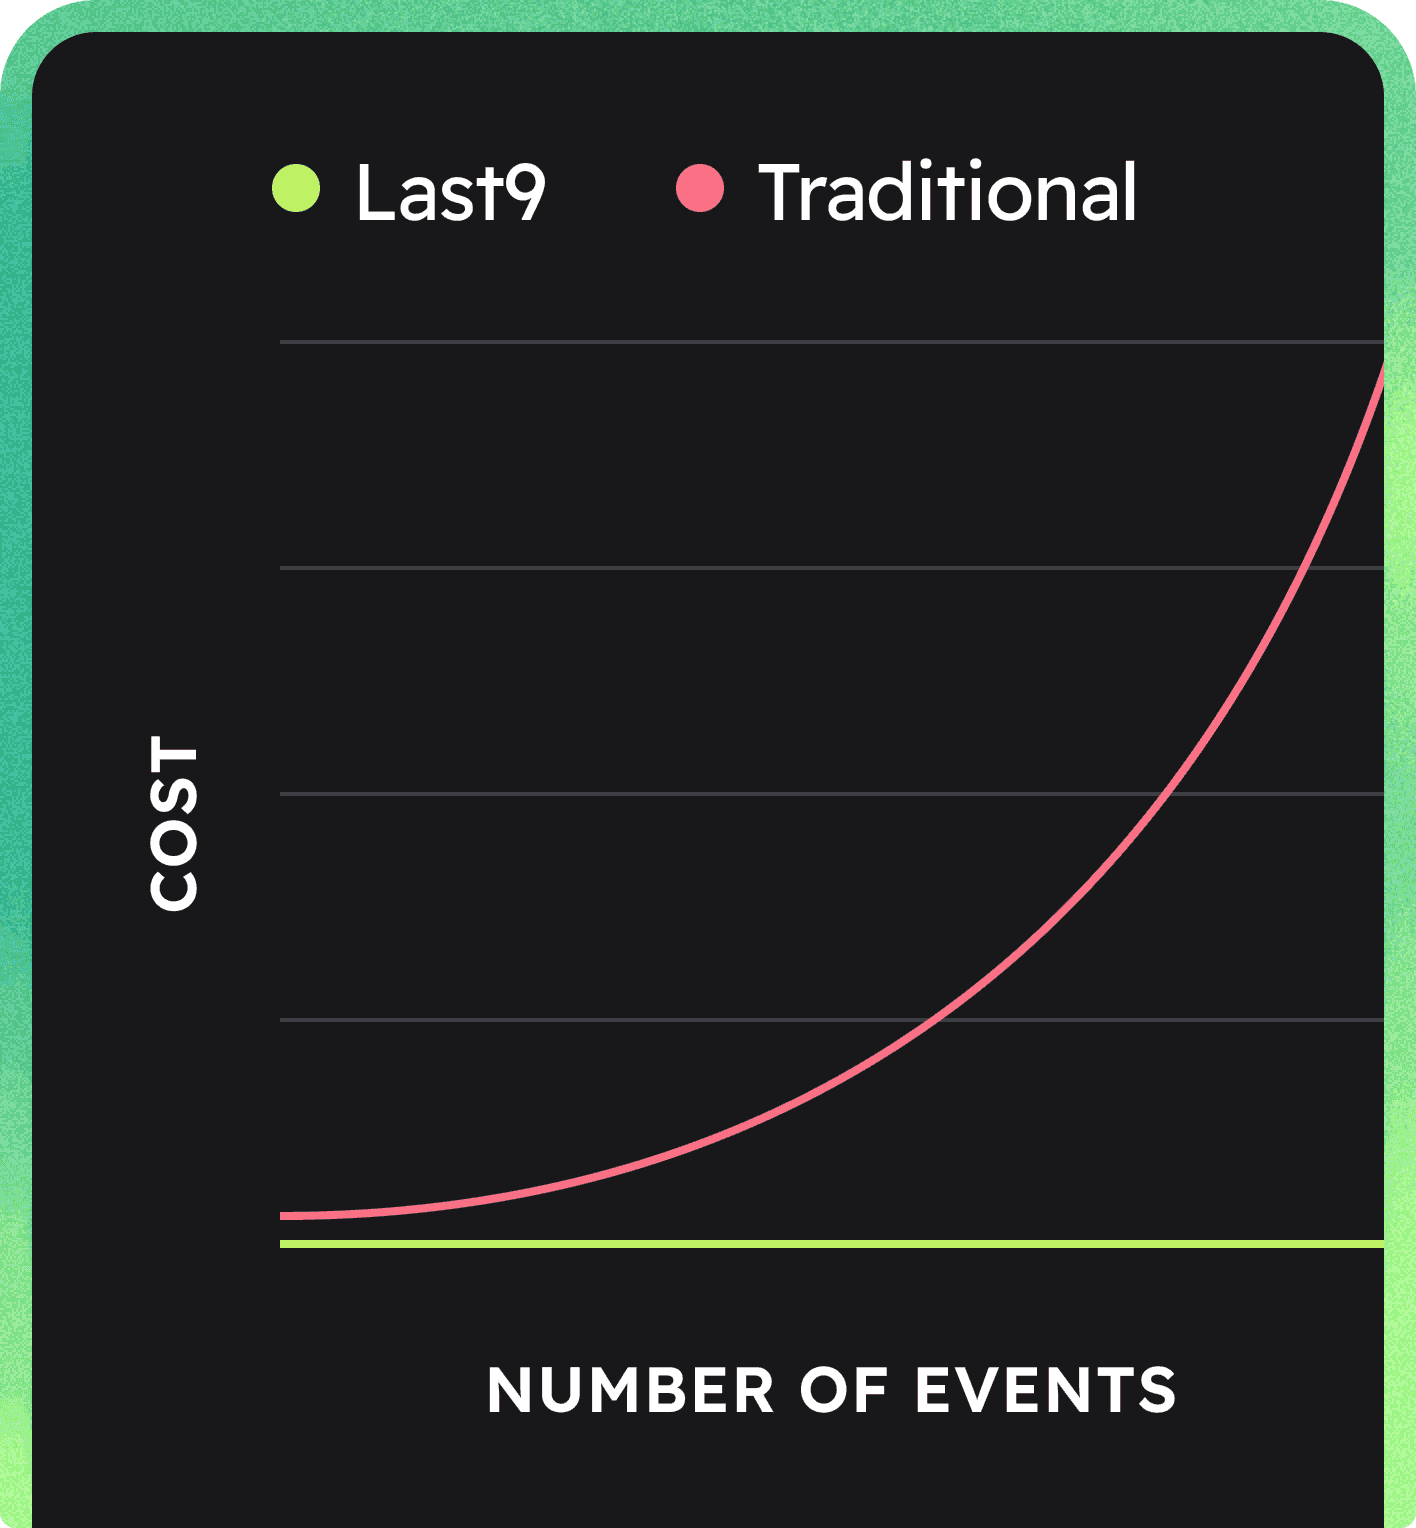
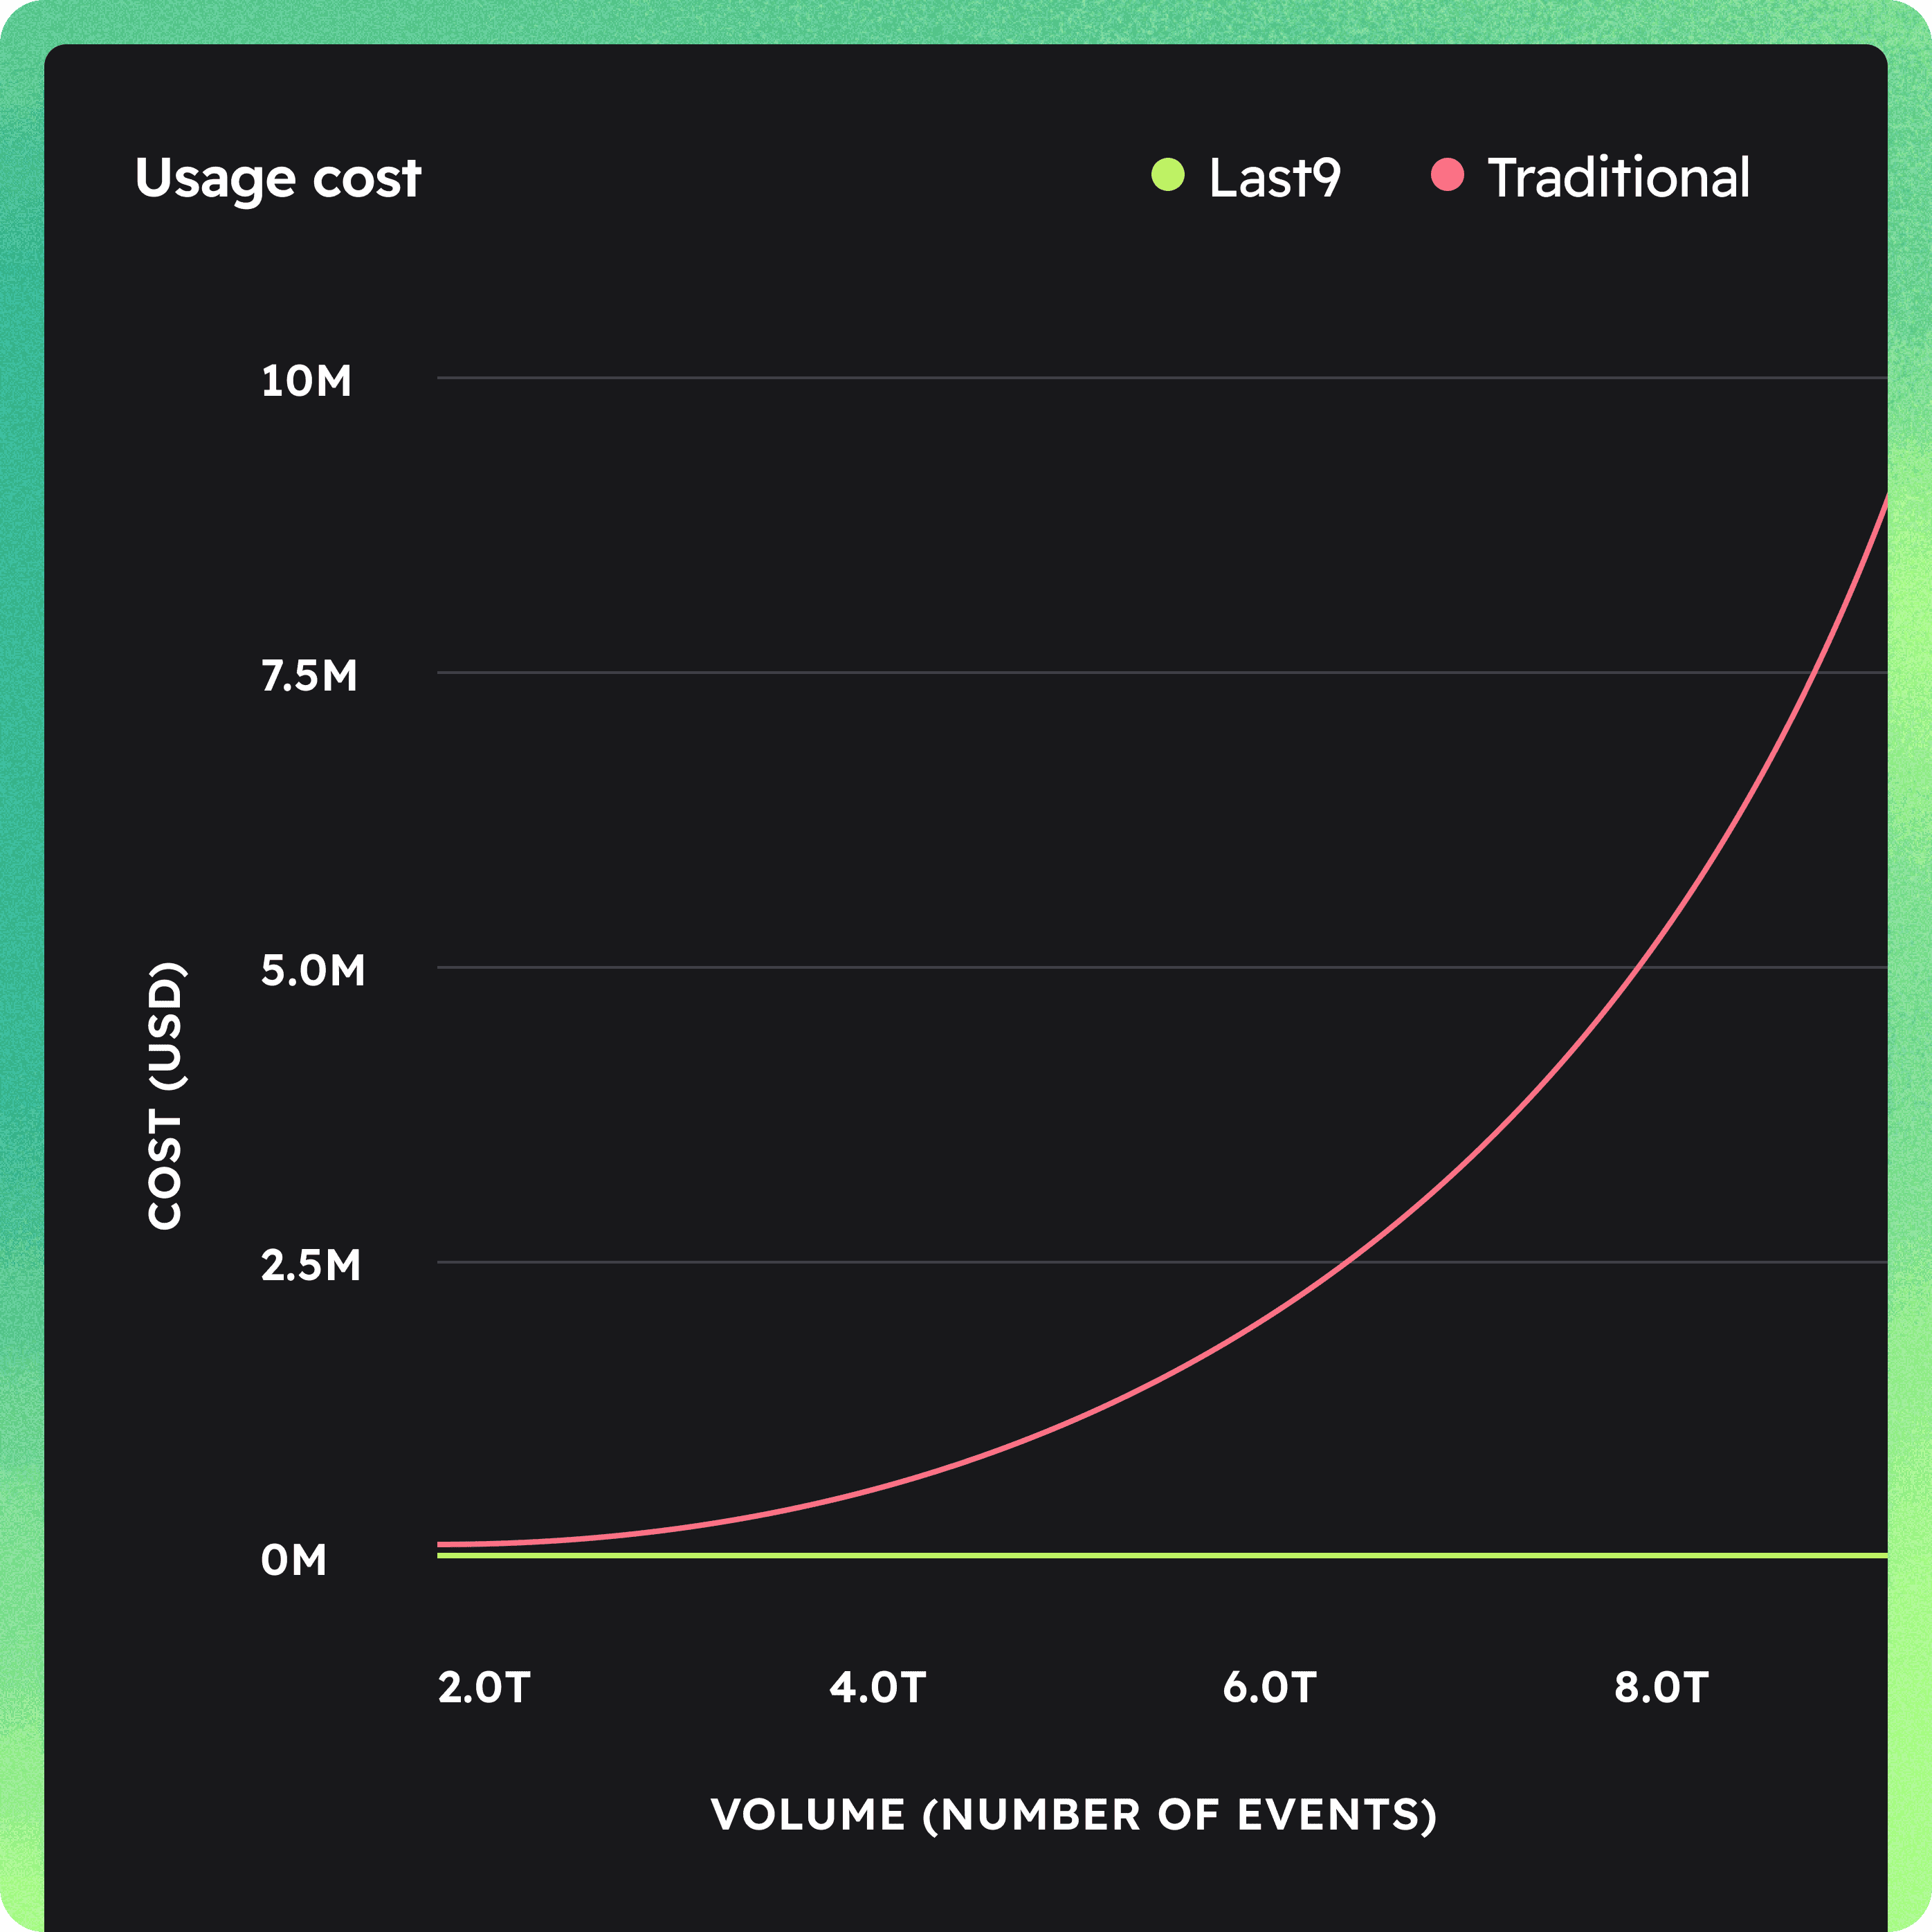
High cardinality data optimized for AI. Complete control over costs. Last9 adapts to the way you work—it's the only observability solution you'll ever need.
Customer storiesWith Last9, we just eliminated the toil. No more worrying about failing dashboards or alerts — we can finally use our metrics. It just works.
Last9 helped us forget all the different observability tools and consolidate every dashboard into one single place.
With Last9, we just eliminated the toil. No more worrying about failing dashboards or alerts — we can finally use our metrics. It just works.
Last9 helped us forget all the different observability tools and consolidate every dashboard into one single place.
Using Last9's high cardinality workflows, we measured SLAs accurately, extracted system insights, and tracked customer impact proactively.
Last9 removed the toil of setting up scalable, high cardinality monitoring— letting us focus on serving our users, not our dashboards.
No lock-in. No guesswork. Last9 natively integrates with common open standards across apps, infra, CDNs and cloud.
All integrationsLast9 natively integrates with common observability tools, cloud providers, and data sources, including:
It's all correlated and queryable. Switch between logs, traces and metrics in one click. Query however you prefer—you're in control.
Track database calls, deployments and user flows in real time. Even at 20M+ cardinality per metric.
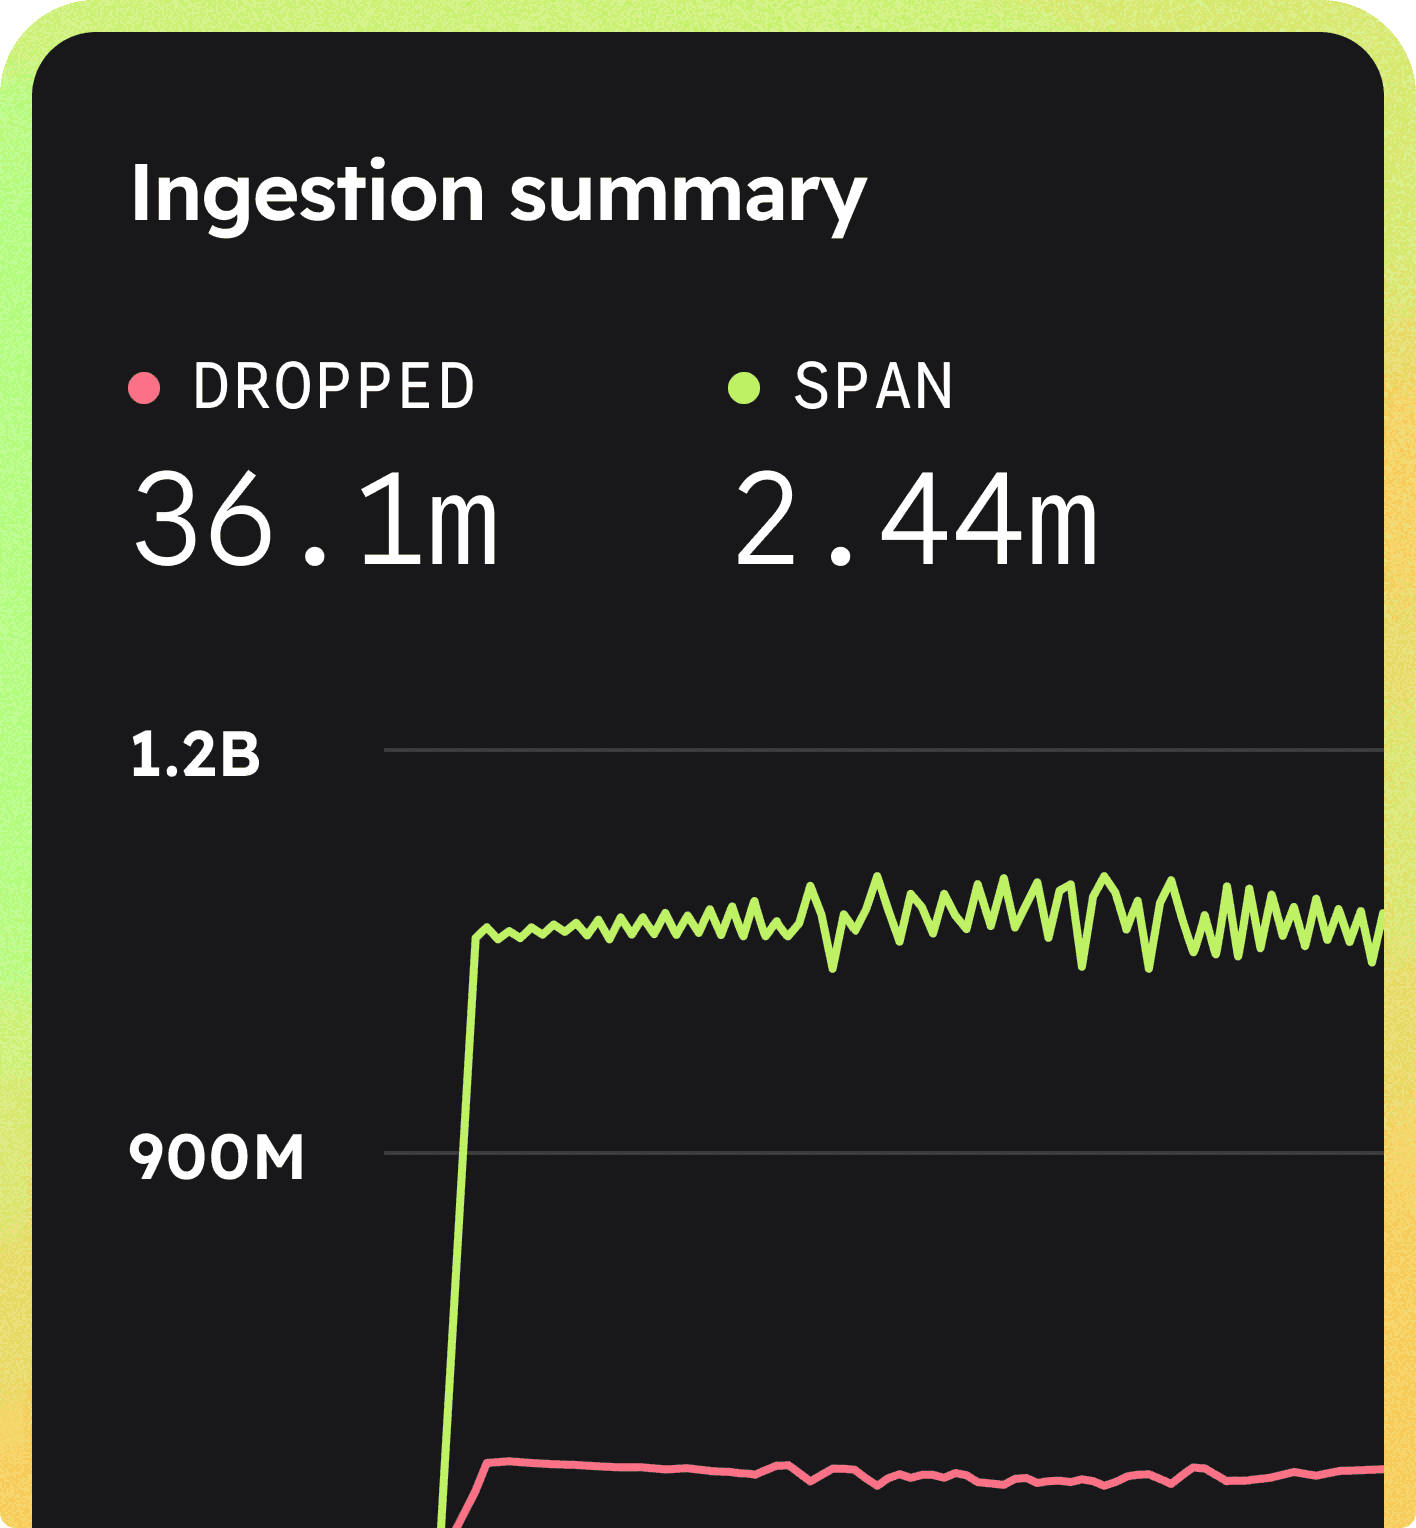
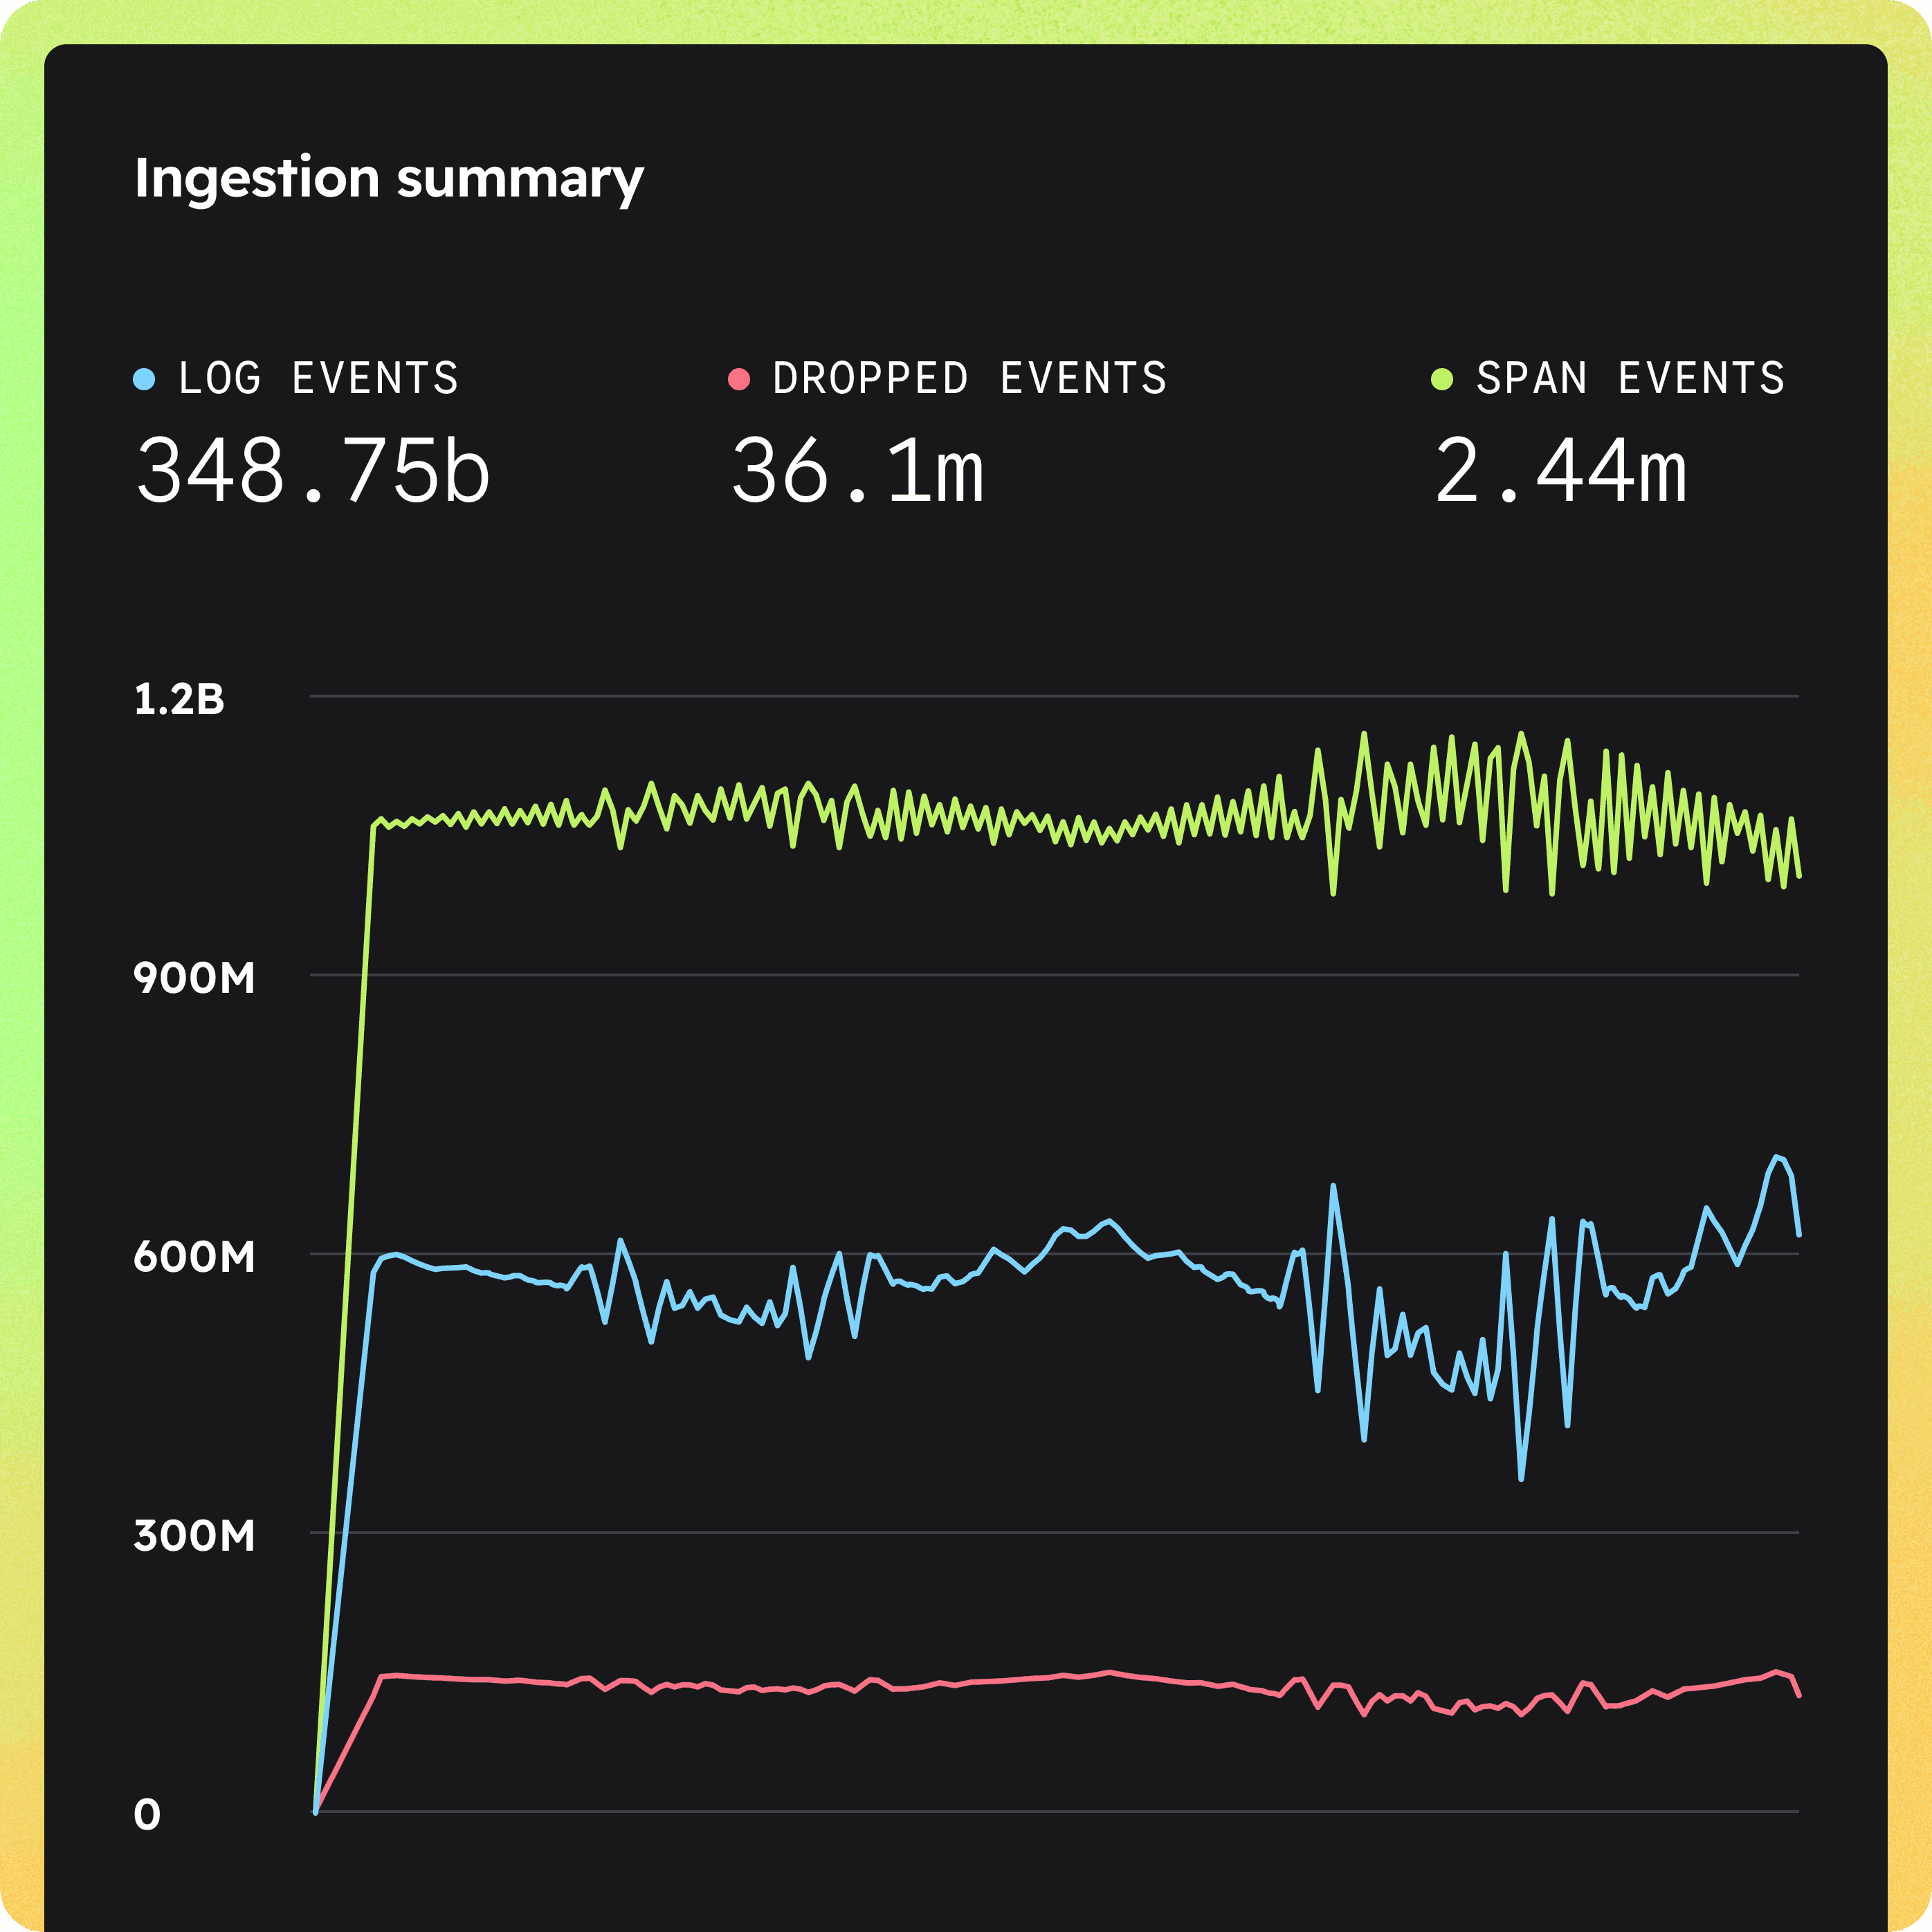
Drop noise, route critical signals, and monitor costs in real time without black boxes.
It's embarrassingly simple to get actionable insights from your data. Just plug in existing sources to get alerts and see correlated metrics, logs and traces on a single pane.
Last9 ingests every telemetry signal — metrics, logs, traces, and profiles — and routes them through an AI Control Plane, Context Store, and Unified Telemetry layer to power three outputs: dashboards, alerts, and AI agents.
Plug in to Claude, Cursor or Slack and let AI co-pilots explain alerts, errors and traces.
No agents. No rip-and-replace. Just point your existing telemetry sources to Last9.
Monitor every request, tenant and user in full fidelity. Never drop labels or sample data again.
Start with one config. Last9 auto-detects services and instantly generates dashboards.
When millions tune in at once, we keep the lights on—helping teams of all sizes do more with their telemetry data.
Book demoCNCF
Silver Member
AWS Partner
Qualified S/W
All data encrypted in transit and at rest using industry standards. Private by design.
Enterprise SSO integration, along with advanced MFA requirements for all access.
Granular permissions and audit trails for complete access control and compliance.
Every request verified and authenticated with no implicit trust assumptions.

Just update your config. Start seeing data on Last9 in seconds.
We've got you covered. Bring over your dashboards & alerts in one click.
100+ integrations. OTel native, works with your existing stack.