

Last9 Named a Gartner® Cool Vendor in AI for SRE and Observability
Gartner recognizes Last9 in their latest Cool Vendor report for unified telemetry and agentic SDK—moving teams from reactive monitoring to proactive ops.
Nishant Modak
Better Together: Last9 + Altinity
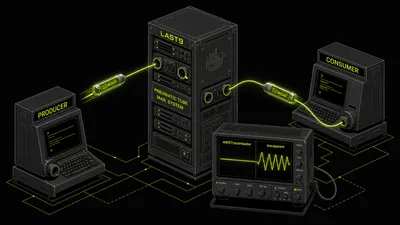
Last9 and Altinity now run observability entirely in your own cloud, metrics, logs, traces, and profiles on an open-source ClickHouse stack, priced on capacity instead of ingestion, with Altinity operating the database so your team doesn't have to.
Last9

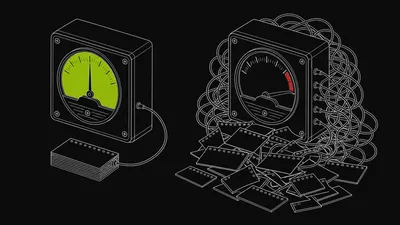
High Cardinality in ClickHouse at Scale: What Actually Breaks
ClickHouse swallows high-cardinality telemetry at ingest, then breaks at query time weeks later. Here is what fails, and how we keep it fast in production.
Prathamesh Sonpatki
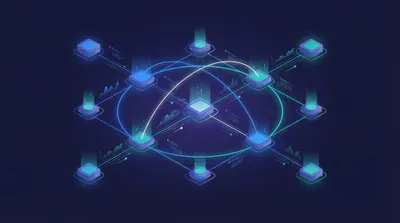
ClickHouse LowCardinality: When It Helps and When It Hurts
ClickHouse LowCardinality cuts storage and speeds up queries on low-cardinality columns, but backfires on trace IDs. How to tell the difference.
Prathamesh Sonpatki

Zero-Code OpenTelemetry for Vert.x
Drop a JAR on the JVM. Get distributed tracing, RxJava context propagation, log-trace correlation, and Vert.x internal metrics. No code changes. No Maven dependency. Java 8–21. Inside the design of last9/vertx-opentelemetry v2.3.4.
Prathamesh Sonpatki
Kubernetes Monitoring Tools: What Actually Works at Scale
What actually works for Kubernetes monitoring at scale — not what looks good in a vendor demo with a five-pod cluster.
Faiz Shaikh

Stop ECS Containers From Collapsing Into One Service in OpenTelemetry
Why ECS containers collapse under service.name = aws_ecs and how to fix it for both EC2 launch type and Fargate, including the resource-vs-log-record pitfall that quietly breaks log filtering.
Prathamesh Sonpatki
How to Test SQS Workflows Locally with LocalStack and OpenTelemetry
LocalStack lets you run SQS, Lambda, and S3 locally in Docker — but there's a hidden trap: OpenTelemetry's default AWS propagator doesn't work with free LocalStack. Here's how to set up end-to-end local testing with working trace propagation.
Prathamesh Sonpatki

End-to-End Trace Propagation Across SQS and Lambda with OpenTelemetry
SQS doesn't propagate trace context automatically. You instrument both sides, deploy, and get two disconnected traces. This post shows how to wire them into one waterfall — and the ESM format gotcha that silently breaks it every time.
Prathamesh Sonpatki
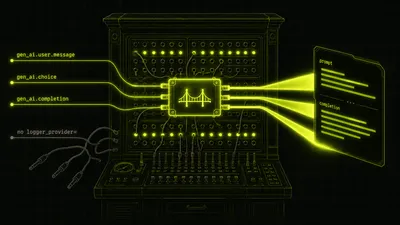
last9-genai: Closing the Conversation Gap in LLM Observability
OpenTelemetry's GenAI instrumentation gives you spans and token counts. It does not give you conversations, workflow cost rollups, or prompts visible in your dashboard. last9-genai is an OTel extension that fills those three gaps — without replacing your existing observability stack.
Prathamesh Sonpatki