

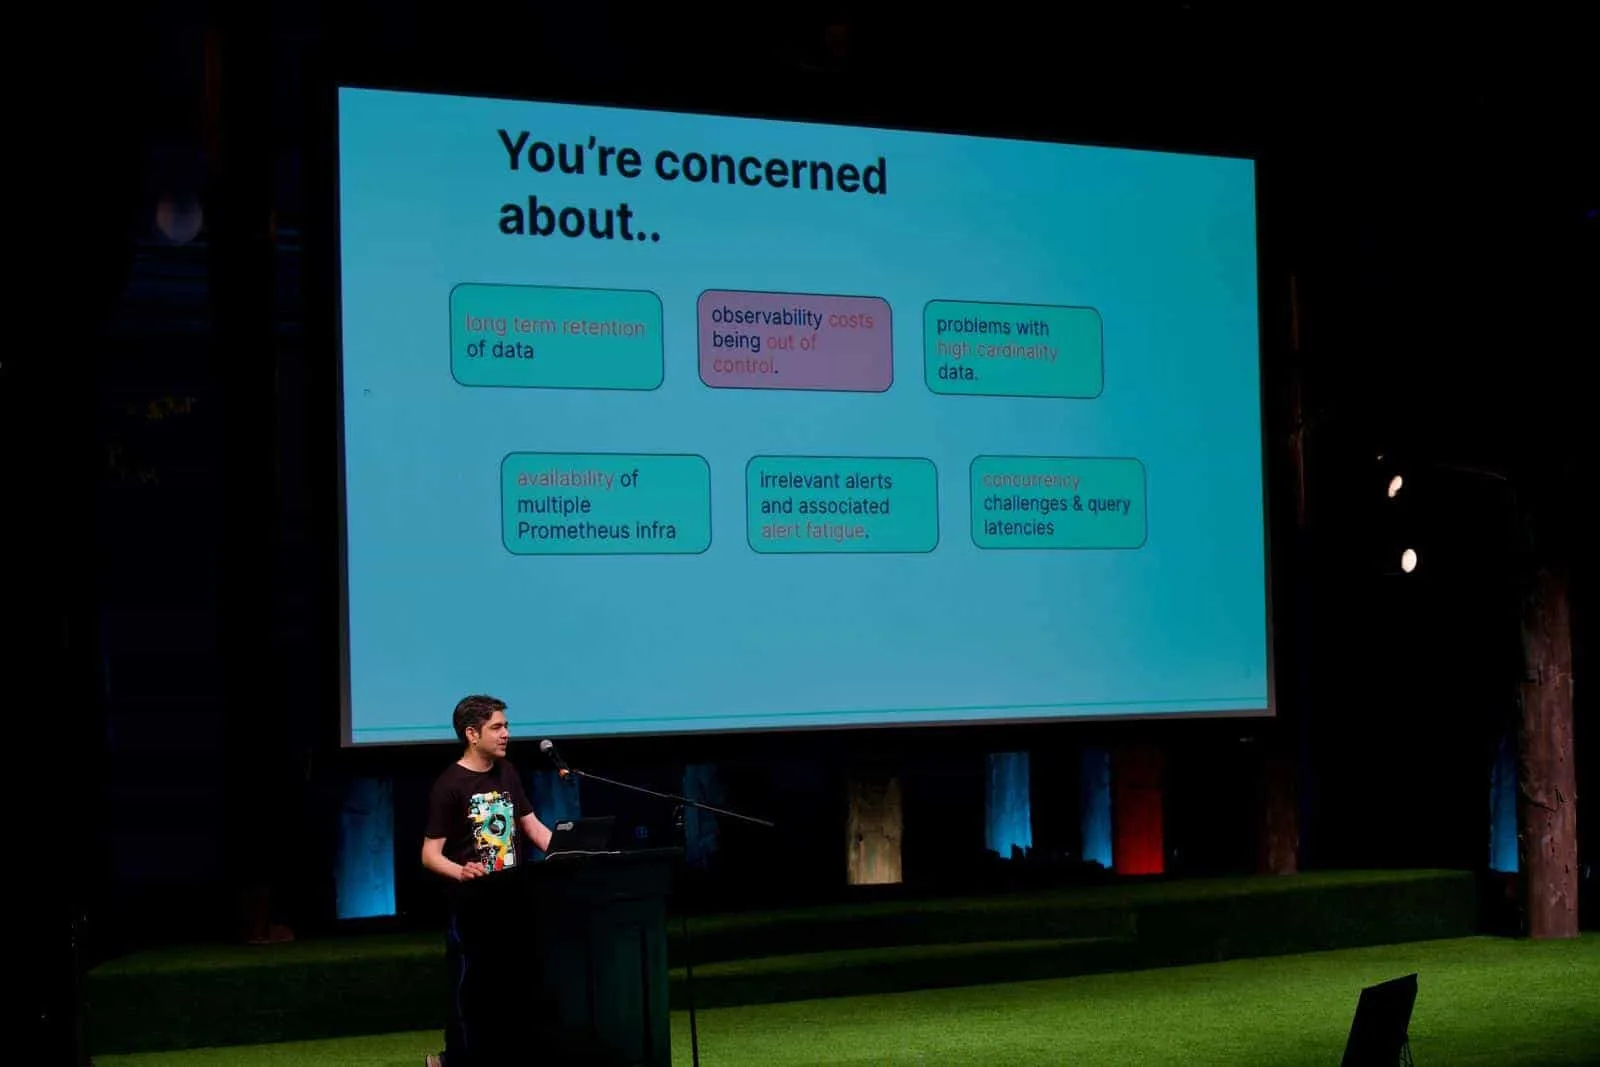
This post is based on my lightning talk at Monitorama 2023 where Last9 was a Platinum sponsor.
Today’s Monitoring Challenges
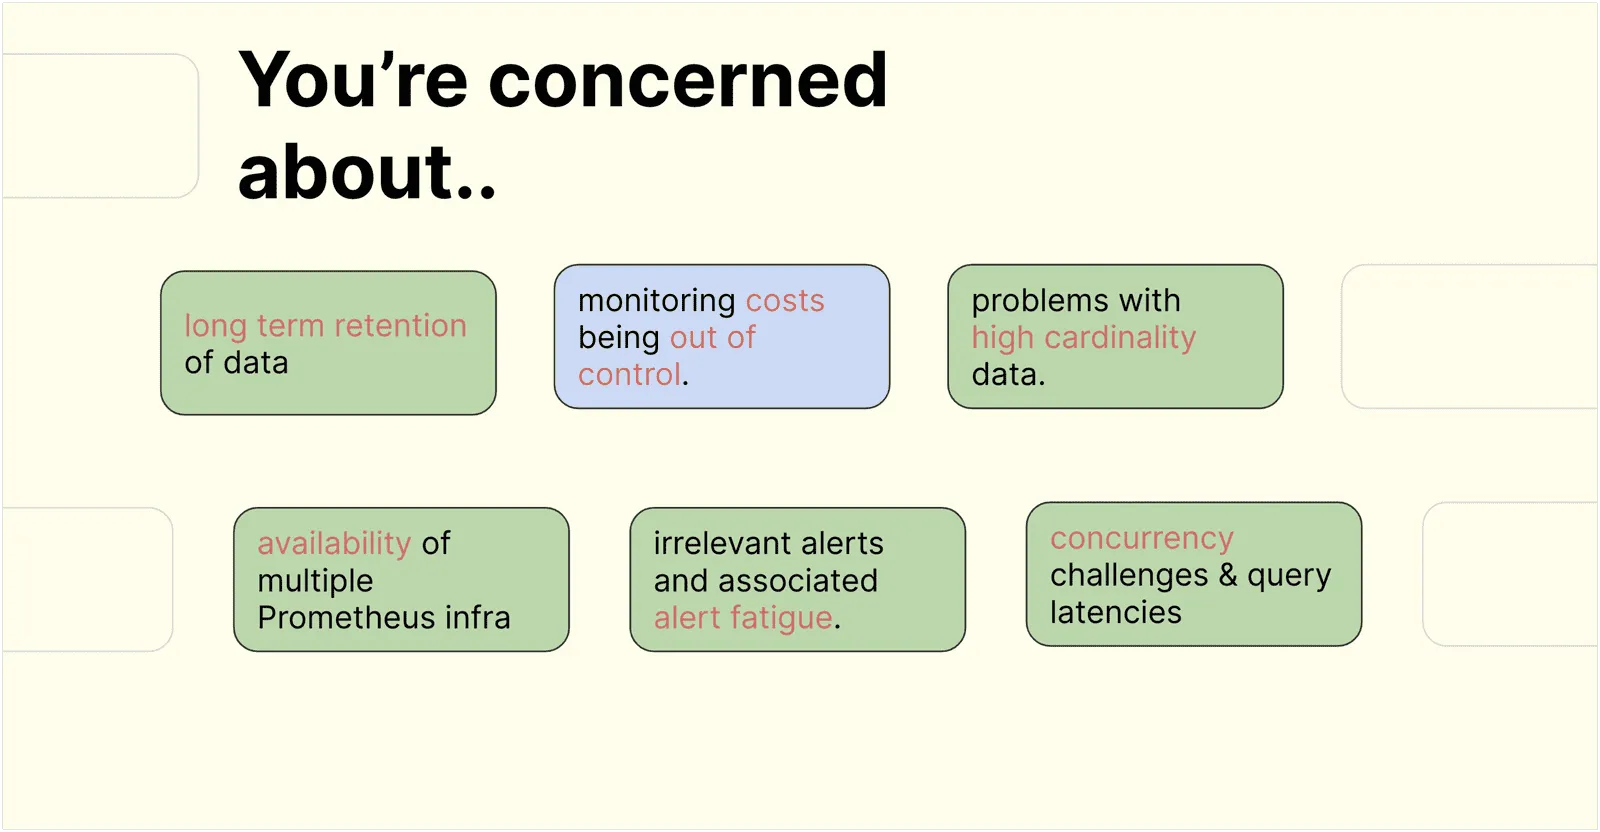
The challenges in the monitoring world are known widely. We all know about these problems, know what they are, and why they are important.
We don’t need to talk about high cardinality suddenly making the entire monitoring system unavailable. Or the inability to track down the app or the team that caused it. Availability & uptime of the complex Rube Goldberg of Metrics setup or the long term storage needs for compliance and seasonality comparison without losing granularity of data.
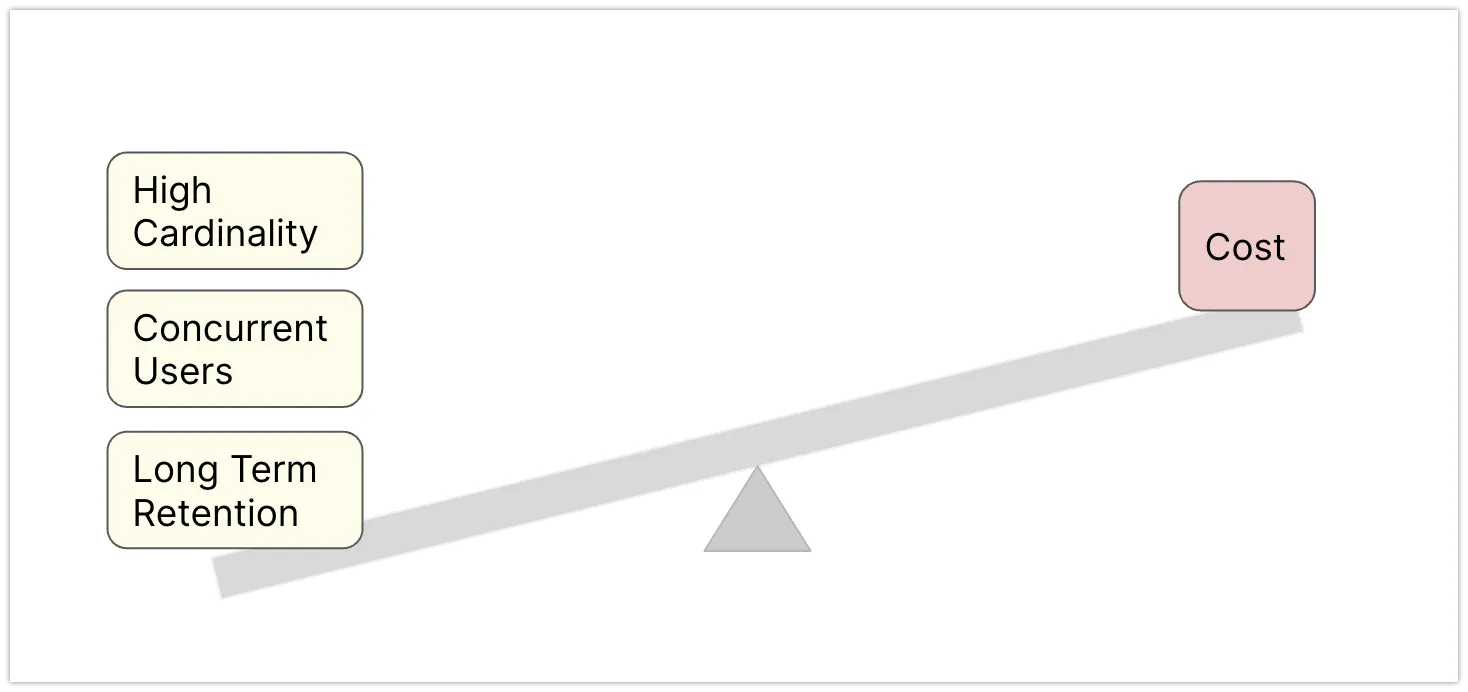
While each one of the problems has its own solution, it all boils down to one thing – COST. How do we balance the tradeoffs without worrying about the huge costs associated with solving these challenges?
Lack of Controls
You understand your metrics best and understand the tradeoffs of how the metrics can be best utilized. But unfortunately have no control levers to manage them most efficiently. Or if you had, they had to be built with engineering toil.
Assembling and putting all of this together feels like assembling an Ikea wardrobe with 150+ blocks in a 7 feet tall box. Why do we always optimize costs later without having clear visibility when utilizing these solutions? What if we had to solve this? What could we do without getting shocked about costs?
For high-precision monitoring and observability, you need efficient and high-precision control levers.
Control Levers for Monitoring
There are five stages involved in any monitoring system.
- Instrumentation
- Ingestion
- Storage
- Query
- Alerting
We provide control levers for each stage of monitoring so you can take full charge of the monitoring solution based on your unique needs and address the challenges of monitoring without getting a cost shock.
Instrumentation Control
Re-instrumentation is not an option.
We could always ask developers to optimize their labels and put restrictions. But no matter what, there will always be some rogue script or app that will throw an unprecedented amount of data at our monitoring infrastructure. It sounds counterproductive that we will limit what needs to be monitored and to what granularity.
“With more answers, you only have more questions” - Piyush Verma.
And that means the monitoring tools should not put limits on instrumentation; it is the wrong place to solve the problem.
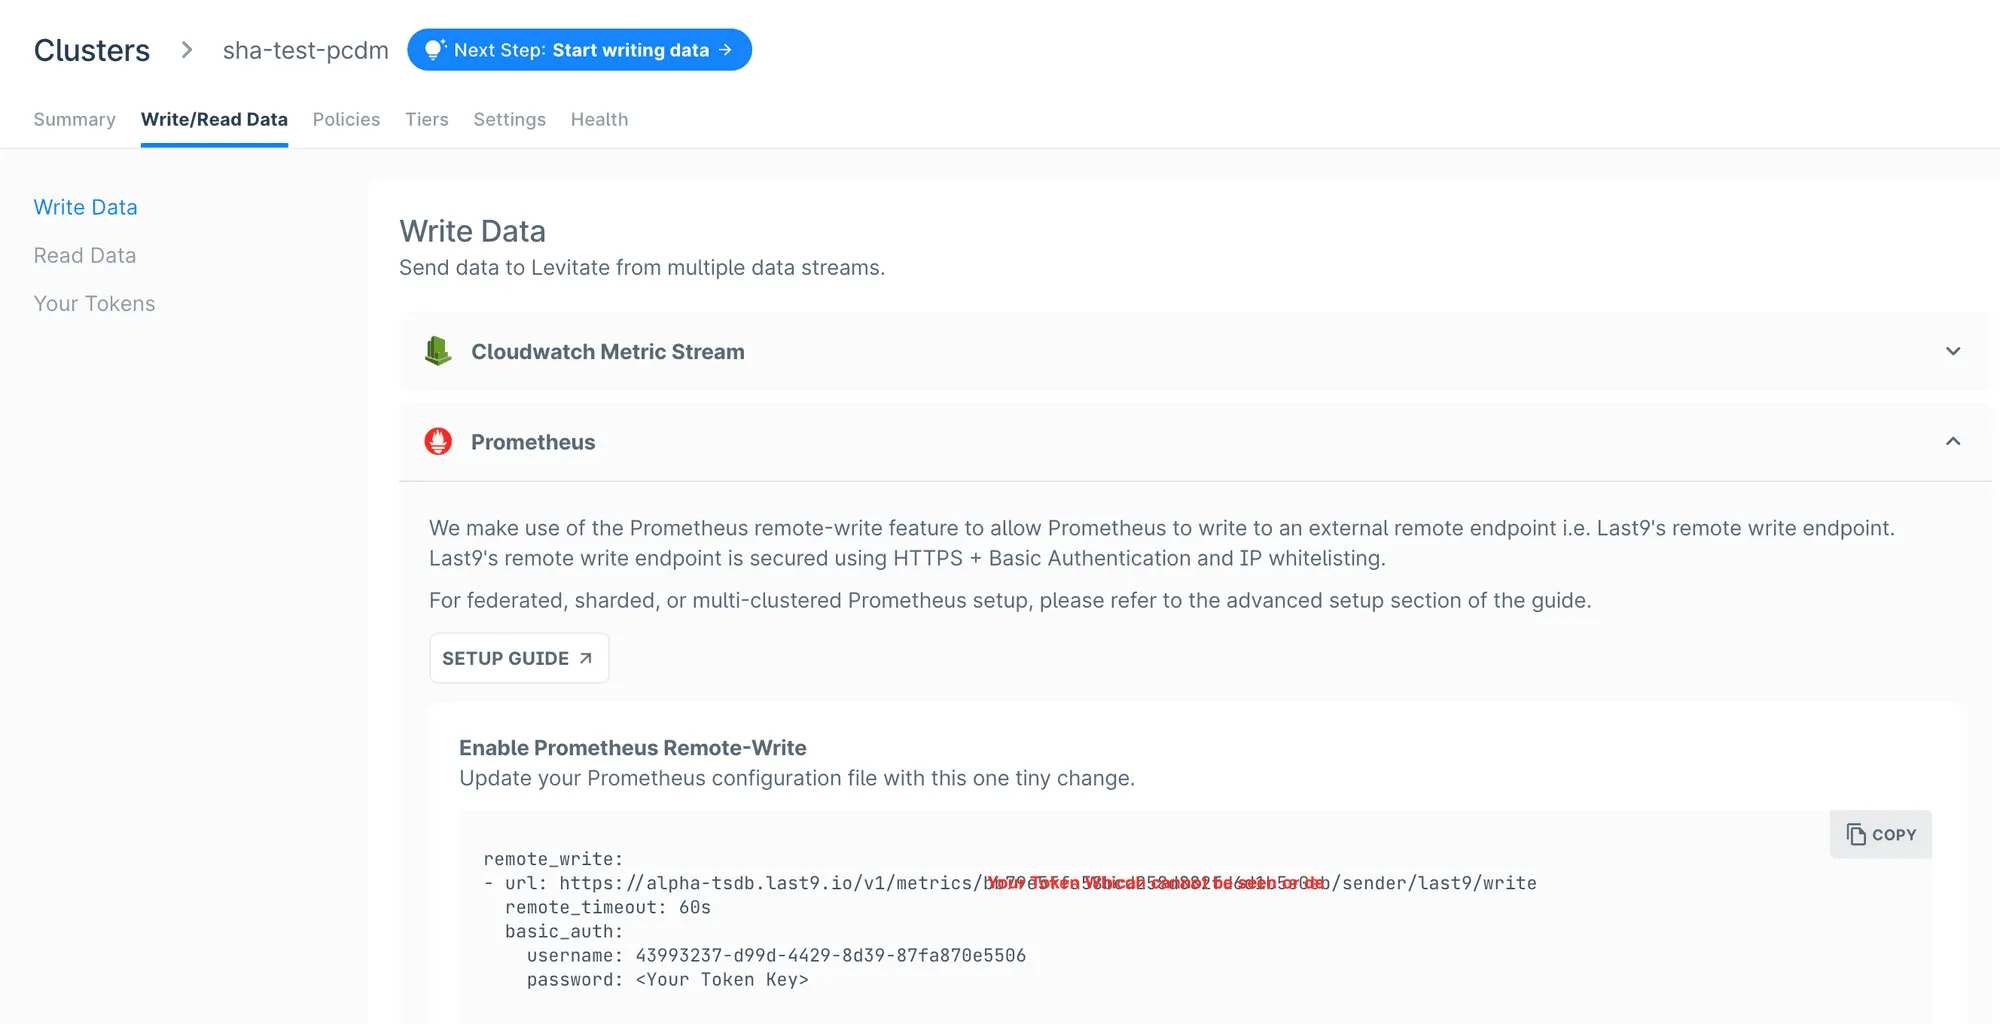
Open Standards FTW
If the instrumentation is based on open standards such as OpenMetrics and OpenTelemetry, it becomes effortless to move existing workloads. All our products are based on open standards, which helps teams plug in their existing telemetry and send data to us with minimal changes, making the integration seamless and fast. We are Prometheus API compatible, so existing Grafana dashboards and alert manager rules will continue to work.
Ingestion Control
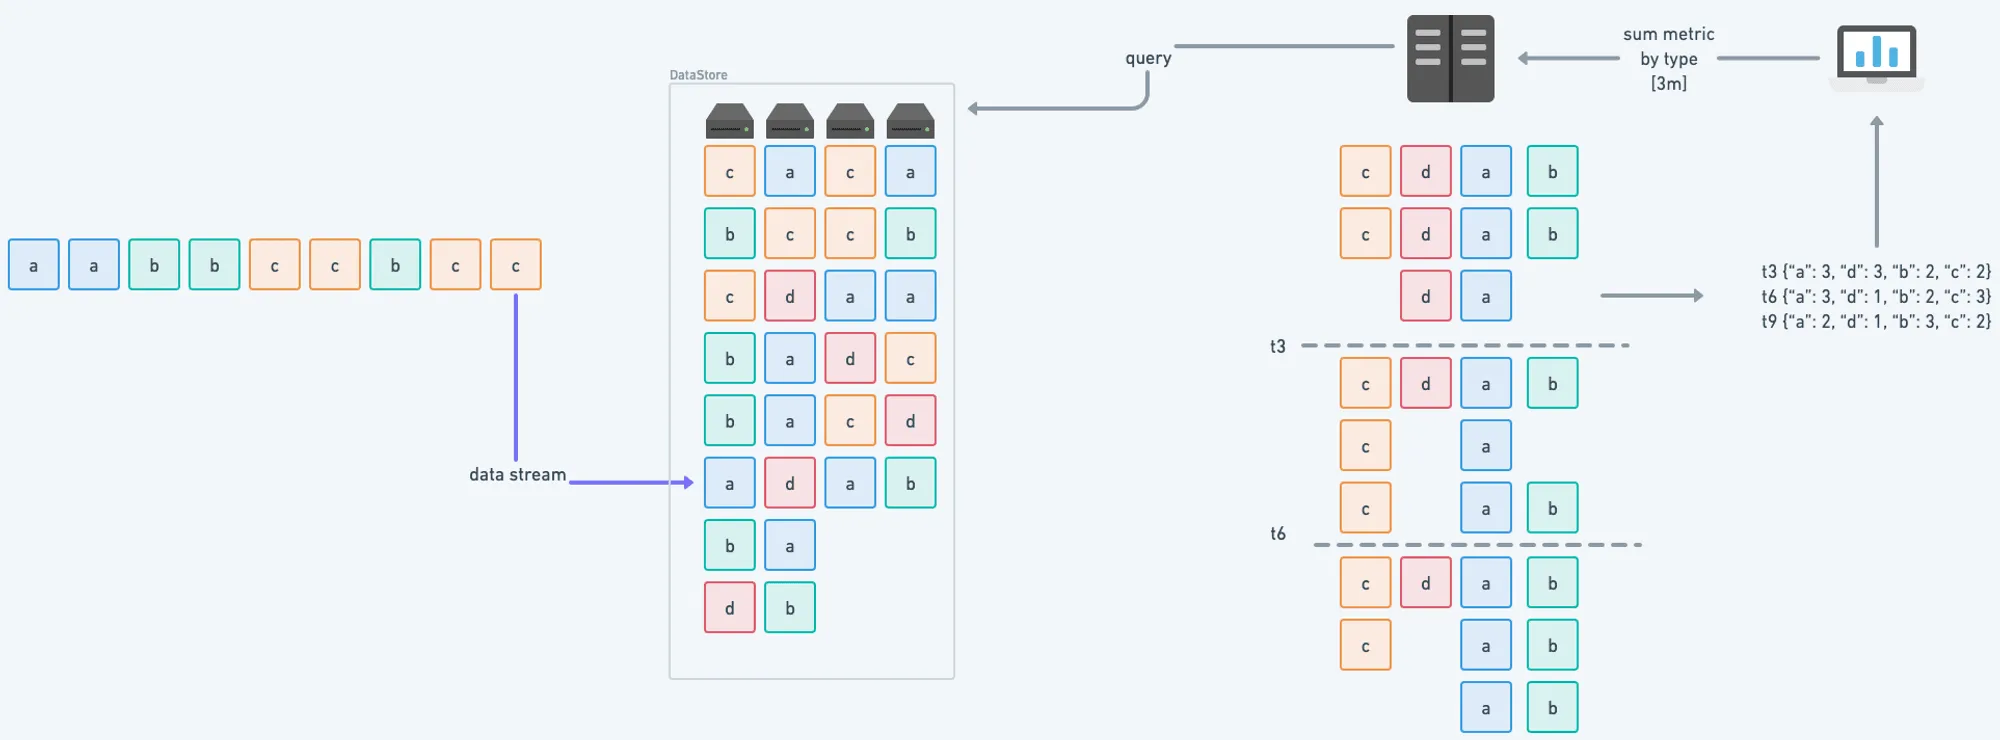
Use streaming aggregations to reduce high cardinality metrics. The process is easy to run as you can define the aggregation rules via PromQL, in the platform itself, or use a simple GitOps workflow. All of this happens pre-ingestion, so there is no performance penalty.
Difference between streaming aggregation vs recording rules.
Isolate which teams or services are breaking the cardinality quota and get cardinality alerts before the limits are hit.

Storage Control
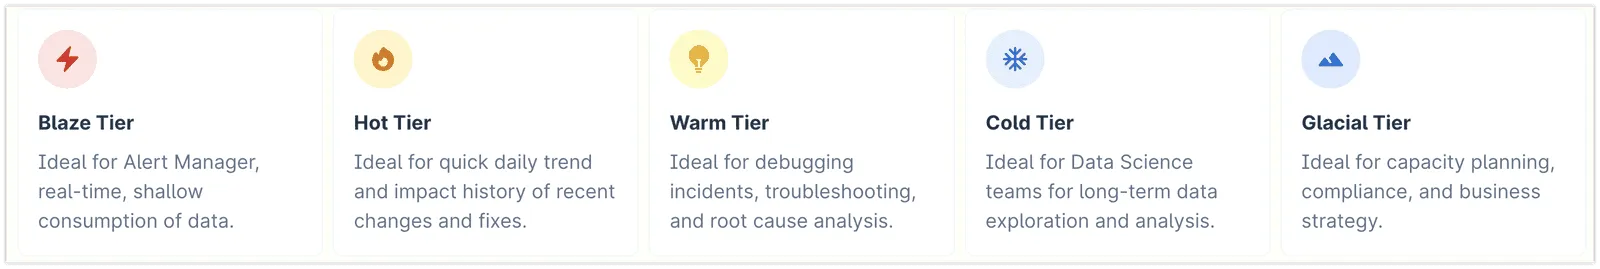
Not all metrics are the same. We already know that. Certain metrics are important for alerting, few are useful for exploration, and some are only stored for compliance.
80% of the metrics are unused, but we still pay for the metrics that we don’t use!
You need alerts, SLOs, compliance, or that one misbehaving Java heap memory metric that you will need only at 3 AM on a Black Friday event. And the only way to store these today is by scaling linearly or paying for it all. Why?
Store two hours of data in a highly accelerated Blaze tier, one month of exploratory data in a Hot tier, and long-term storage in the Cold tier. We have consistently seen that customers have saved about 60% of monitoring TCO by just being more aware of this and setting appropriate retention policies.
We provide one year of long term metric storage by default without rollups.
- Retention Limit: Limit the available data in the tier i.e., x months/days/hours.
- Concurrency Control: Limit the active number of queries the tier can handle simultaneously. This is the most trustworthy indicator of the Performance of a time series database.
- Range Control: Limit the number of days of data allowed to be looked up in a single query. It directly impacts the number of data points or series loaded into the memory.
- Overflow Lakes: Store the high cardinality data that overflows the cardinality limits where you can take action to either reduce cardinality or drop labels.
Query Control
Client Separation & Concurrency
Leverage automatic data retention by creating access tokens specific to client workloads and tiers. Route the queries from alerting workload to the Blaze tier and exploratory workload to the Hot tier. You can effectively achieve traffic shaping of the time series data by using access policies. This also solves the concurrency challenges as different workloads get routed to different tiers based on their importance and specific requirements.
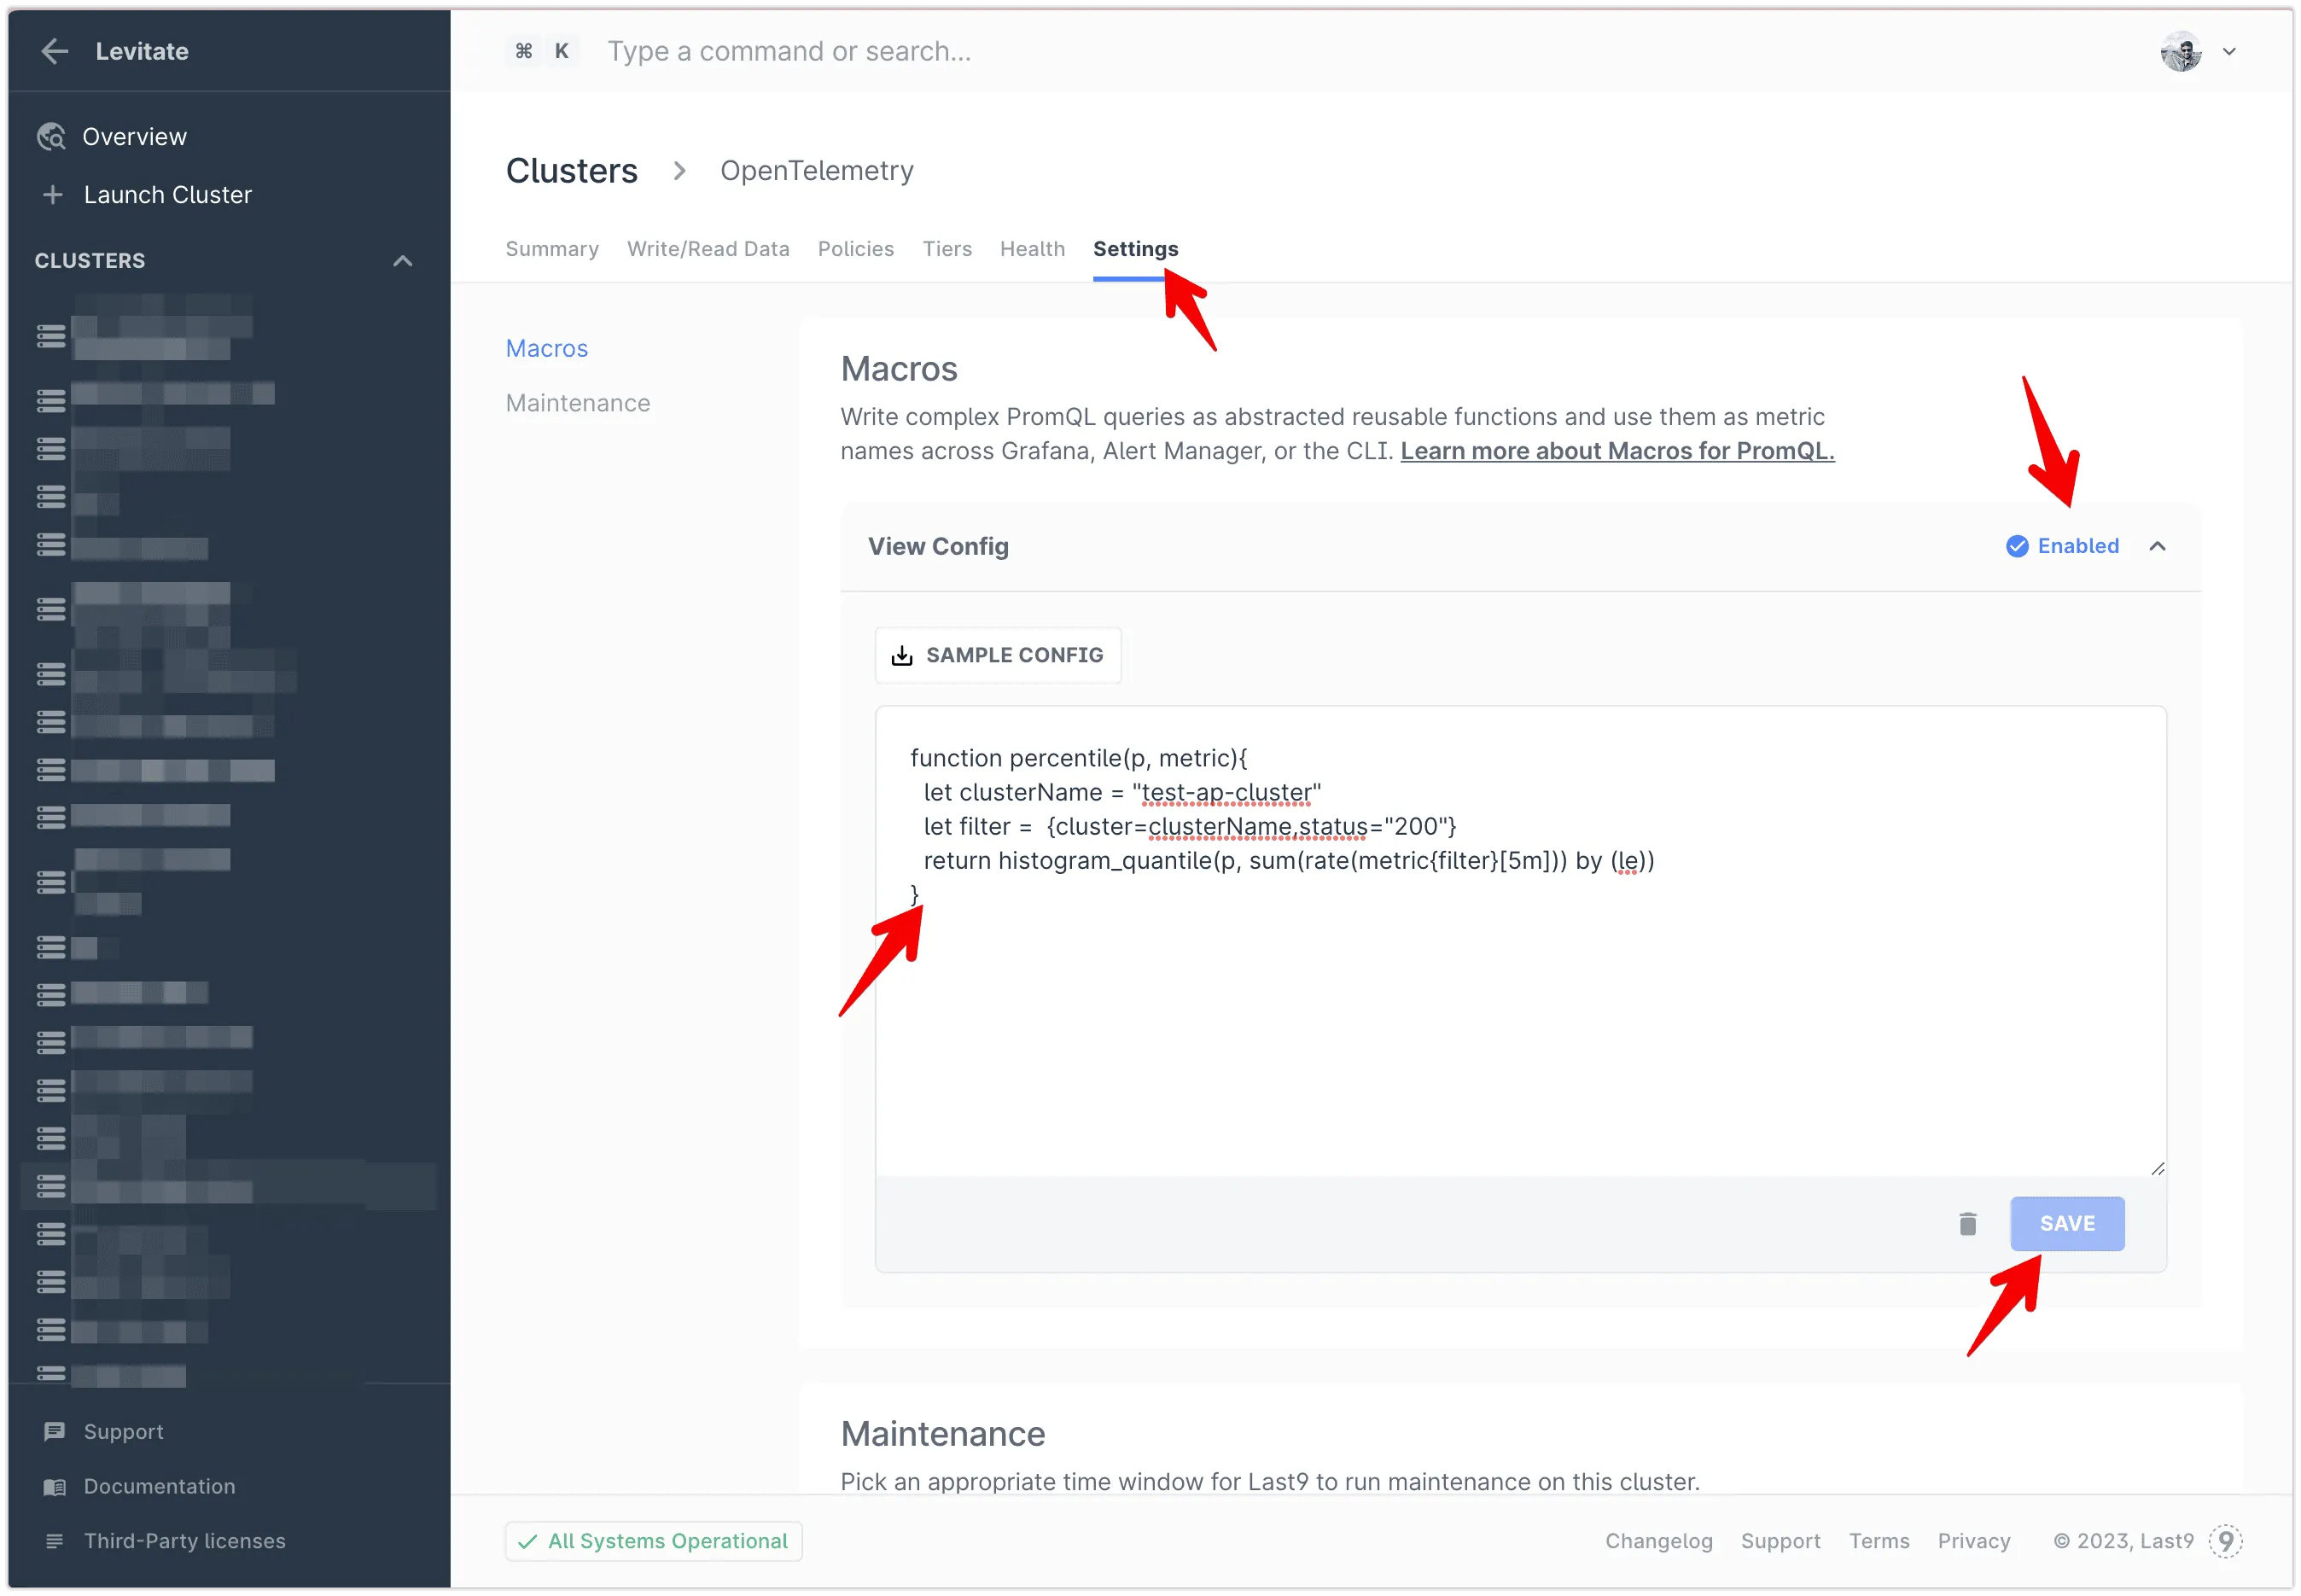
PromQL based Macros
Want stored procedures or named functions but in PromQL? Define them in our Macro Editor.
You want to calculate the percentile of a metric; no need to repeat the PromQL repeatedly in every Grafana dashboard; define a Macro using ES6-like syntax, which returns a PromQL as a result.
function percentile(p, metric) { let service = "this is my service" let filter = {servicename=service,status="200"} return histogram_quantile(p, sum(rate(metric{filter}[5m])) by (le))}You can use the Macros in Grafana dashboards and alert manager queries directly.
Events and Metrics Together
Combine Real-time events and metrics, and get more contextual alerts and powerful insights. Run aggregations on top of high cardinality events using the same streaming aggregation pipeline that works seamlessly with metrics.
Alerting
Alerting designed to reduce fatigue, based on PromQL, so you can move existing workloads or define alerts using Last9’s alert manager. Get actionable alerts with the ability to co-relate events and metrics.
Levitate. Reduce TCO by 60%
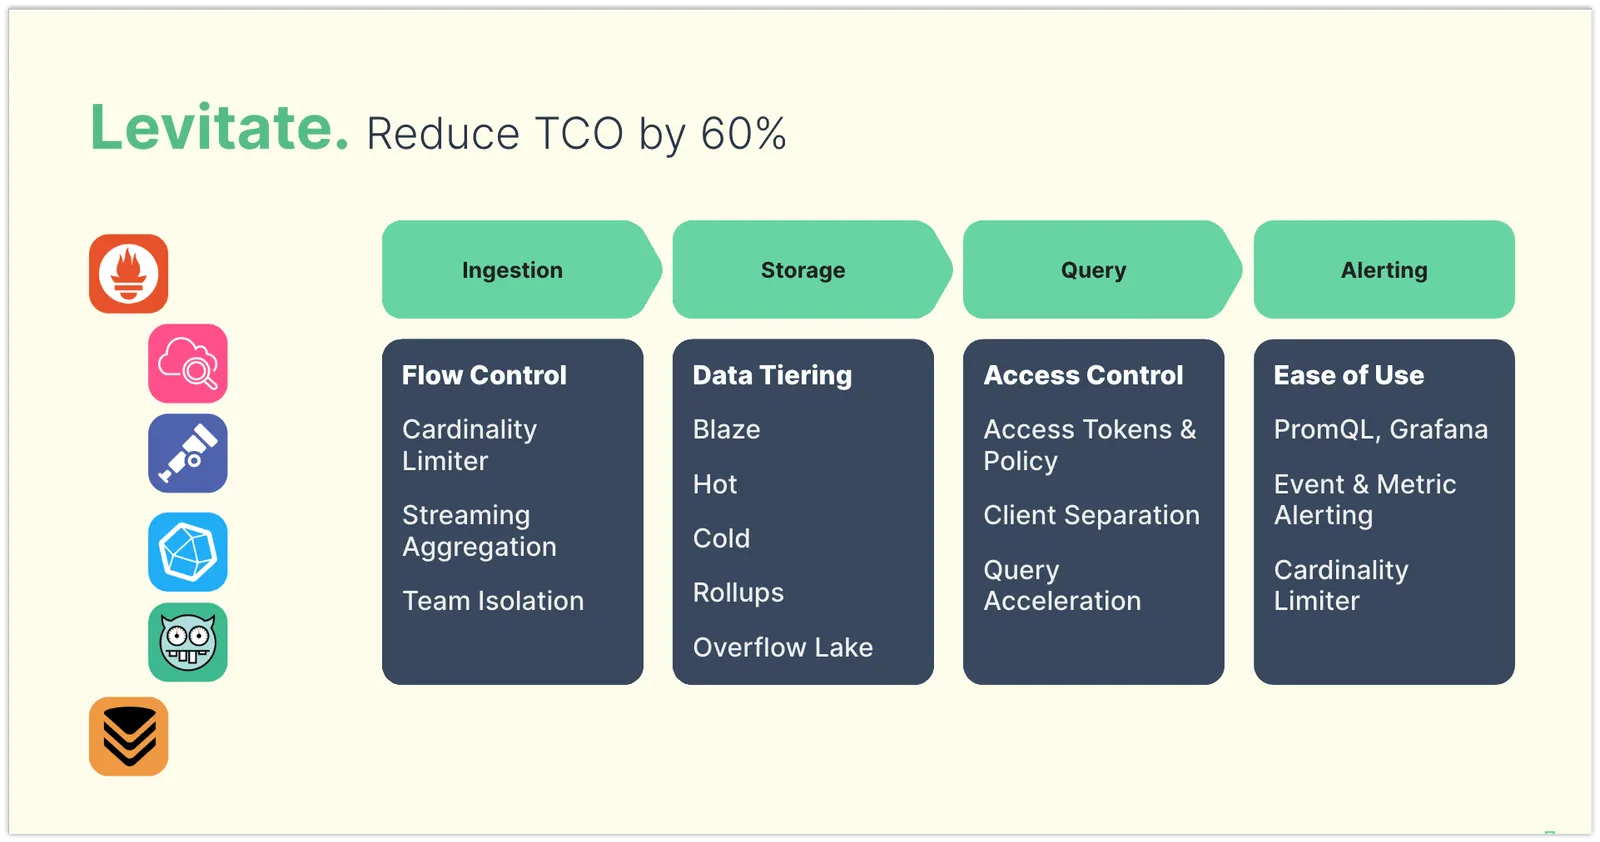
Efficient by design
Levitate - our managed time series data warehouse is equipped with all of the control levers I discussed. It makes it efficient to operate monitoring systems by removing the toil of maintaining a time series database away from engineering and SRE teams.
Bring your own cloud
All of these control levers are available as “Bring Your Own Cloud” model, which allows us to slash hidden egress costs, data transfer costs, compliance, and security constraints by deploying Levitate in your cloud.
Engineering teams worldwide have consistently been able to reduce their monitoring TCO by up to 60% by using Levitate.
Take back control of your monitoring system with Levitate. Schedule Demo to learn more or get started right away.

