

An observability migration moves your telemetry, dashboards, alerts and access from one vendor to another without a gap in coverage. Two questions decide whether a team gets to run a proof of concept at all: will the new platform cost less once everything is counted, and how much work is the move?
This guide answers both. You will build a TCO comparison from the meters on your own bill, scope the real migration work (instrumentation, dashboards, alerts, access), and run both vendors side by side with exit criteria set in advance. It also lists what does not import cleanly, so the estimate you take to your manager has no surprises in it.
Why migrate to a new observability platform?
Teams rarely switch because of a feature list. They switch because a line on the bill moved, or because a gap showed up during an incident. Tie each trigger to the meter that caused it:
- A custom-metrics line that keeps growing. Datadog bills each tag combination as a custom metric above 100 per host, so every new label value adds cost. Grafana Cloud bills active series, and a shorter scrape interval multiplies them. Our Grafana Cloud pricing breakdown shows the same metric costing roughly 4x more at a 15-second scrape than at 60 seconds.
- Several meters moving independently. Hosts, ingested GB, indexed events, users and AI usage each have their own line, so a cut on one rarely shows up in the total.
- Labels you removed to save money. If
customer_idortenantcame off a metric to keep the bill down, you gave up the query you needed during the next incident. - Data residency or deployment rules that the current vendor’s regions cannot meet.
- Tool sprawl. Metrics in one tool, logs in a second and traces in a third, with three sets of alerts to maintain.
Last9 is built for the first three: it is one licence, the infrastructure runs on your own cloud bill at your negotiated rates, and there is no meter per active series or per GB. Labels like customer_id or tenant stay on the metric, with no charge per label or metric name.
If none of these shows up in an invoice or an incident review, a migration is hard to justify. Start by finding which one does.
Build the TCO comparison before the POC
A TCO comparison is a worksheet with one row per meter on your current bill and one column per vendor. Build it from invoices, not from list prices, and build it before the proof of concept so the POC tests the numbers instead of producing them.
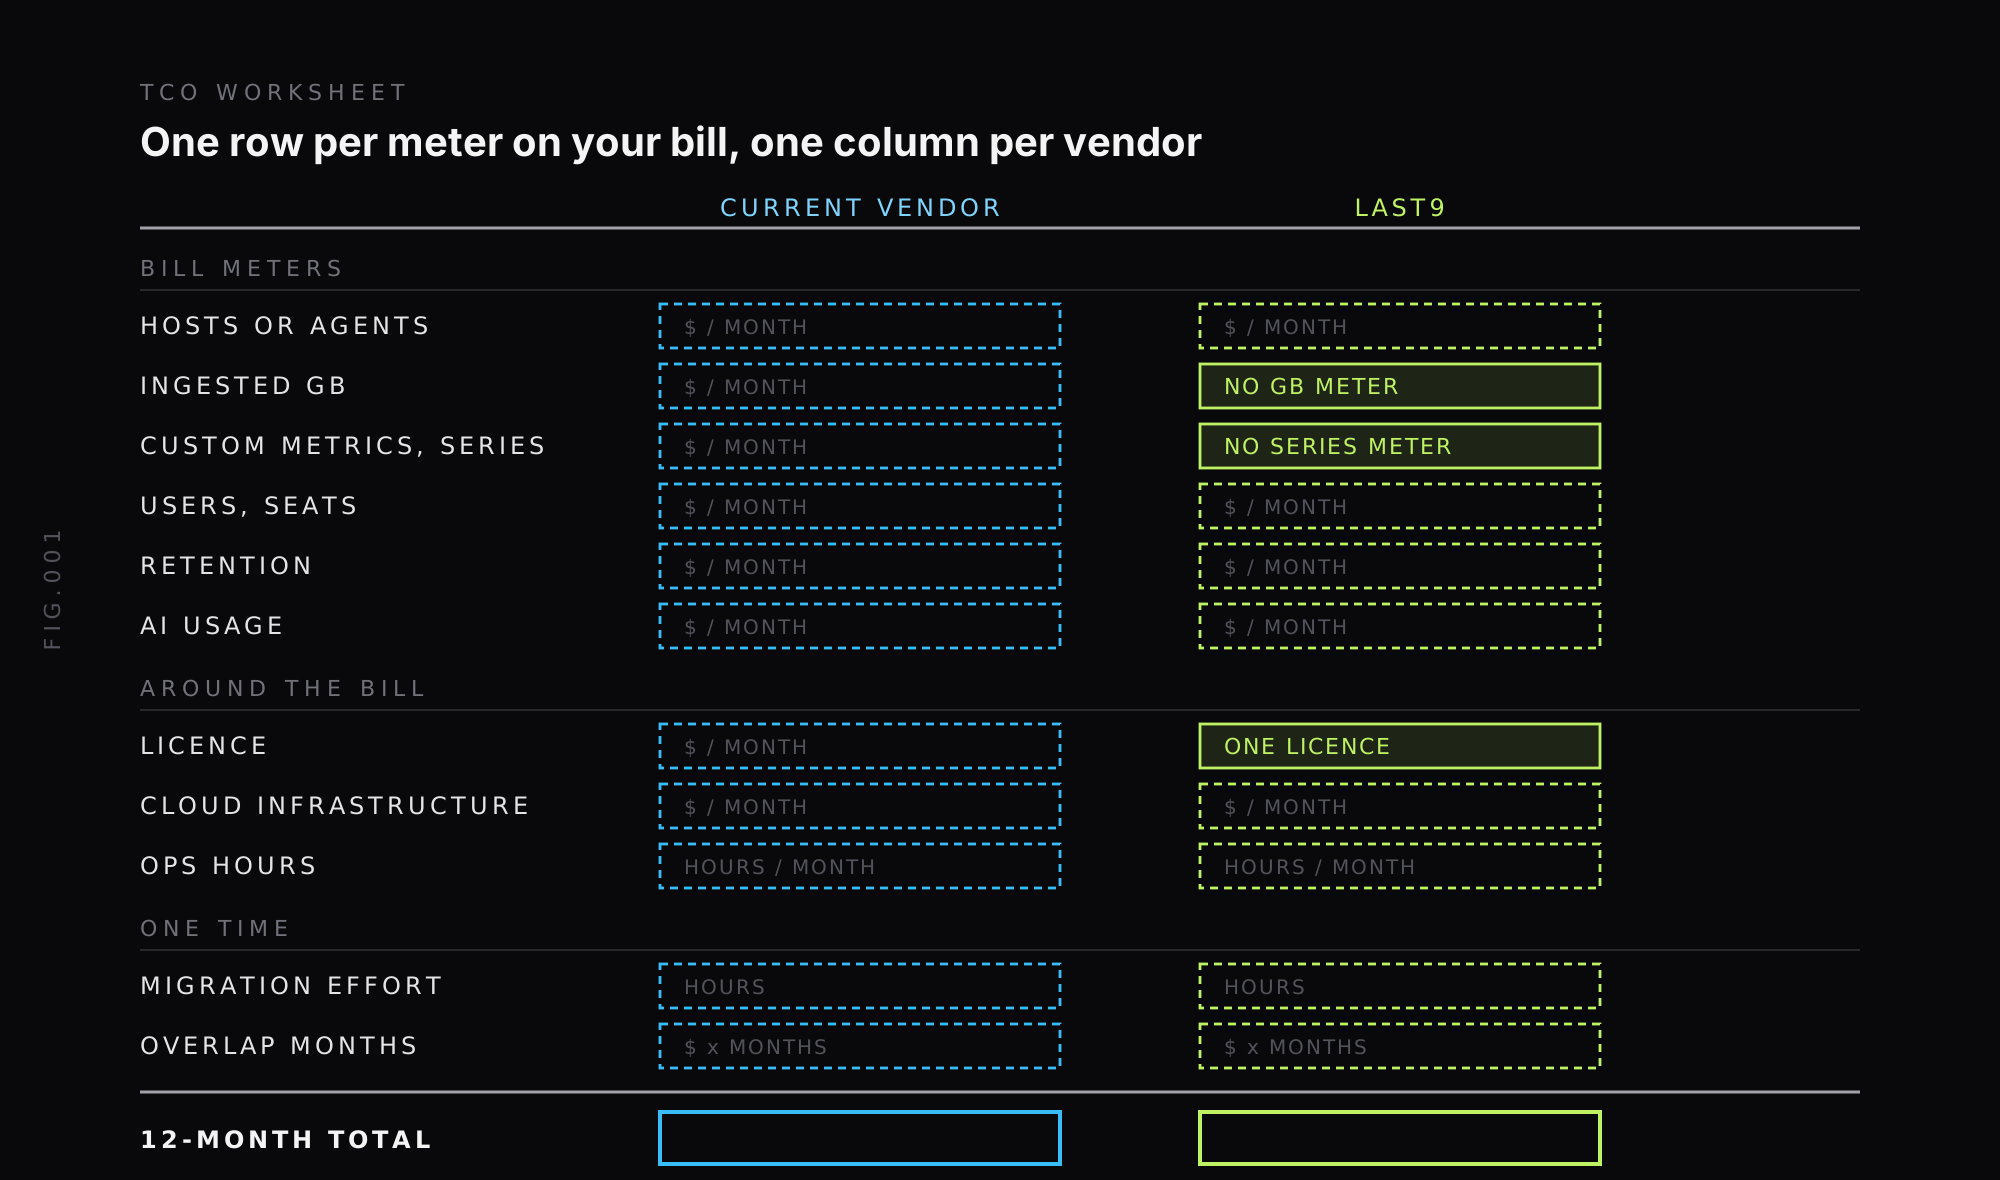
Fill the current vendor column first. Take the last three invoices and list every line item, including the small ones. A missing line is how a worksheet ends up flattering the new vendor. Use the monthly average, and flag any month that spiked from an incident or a launch.
Add the costs that never appear on an invoice. Ops hours spent on the old stack (upgrades, quota requests, tag cleanups), egress between your cloud and the vendor, and the months where you pay for both. Overlap is a real cost, so it gets its own row.
Get the other column in writing. Last9 is one licence, and the infrastructure runs on your own cloud bill at your negotiated rates. There is no meter per active series or per GB, so those two rows read “no meter” and the work is in the licence and cloud rows. Ask every vendor on your list for a written quote against the same inputs. This post does not quote Last9 prices, so that column comes from a quote, not from a guess.
Divide to find break-even. Add the one-time rows (migration hours at your loaded rate, plus the overlap bill), then divide by the monthly saving. With round, made-up numbers: if the current stack costs 1,000 a month, the new one costs 700, and the one-time cost is 1,500, the saving is 300 a month and break-even is month five. If break-even lands beyond your contract horizon, the migration does not pay for itself on cost alone, and the case has to rest on something else, such as retained labels or data residency.
Rerun the worksheet with your highest-volume month, not the average. Metered bills grow with spikes, so that month shows the widest gap between a metered vendor and one without those meters.
What an observability migration involves
A migration has four workstreams. Scope each one before you quote an effort number.
Instrumentation. If your services emit OpenTelemetry or Prometheus, this is an endpoint and credentials change. Last9 ingests OpenTelemetry and Prometheus, plus dual-shipped Datadog Agent data, so nothing needs re-instrumenting to start. Our docs cover the OpenTelemetry Collector and Prometheus remote write setups. Vendor-specific SDKs and custom agent checks are the exceptions, so list them up front. For the long-term case for staying portable, see OpenTelemetry vs traditional APM tools.
Dashboards and monitors. Datadog dashboards and monitors import into Last9 in one click, and Grafana dashboards and alerts import into Last9’s embedded Grafana, where you can convert them to native Last9 dashboards when you are ready. Plan the gaps: saved views, notebooks and Datadog-specific queries need rework. A Last9 engineer scopes that rework with you before you sign. Test your ten most important dashboards in a trial before you commit to an effort estimate, because that is where unsupported widgets and query functions show up.
Alerts as code. If your alerts live in Prometheus alertmanager YAML, Last9 converts them through an HTTP endpoint:
curl -XPOST https://app.last9.io/api/v4/organizations/{org_slug}/entities/migrate/alertmanager \ --data-binary @sample.yaml \ -H "X-LAST9-API-TOKEN: Bearer $TOKEN"The response is Last9-compatible YAML. The token goes in the X-LAST9-API-TOKEN header with the Bearer prefix, and the standard Authorization header is rejected. See the alertmanager migration docs. If you want alerts under version control afterwards, the Terraform provider manages alert groups, threshold alerts, log-based alerts and notification channels.
Access and ownership. Decide who can edit what, set up SSO, and map teams to the services they own. Last9 offers SSO and access controls. Do this before cutover, because the first question after a cutover is who owns the alert that just fired.
Run both vendors in parallel
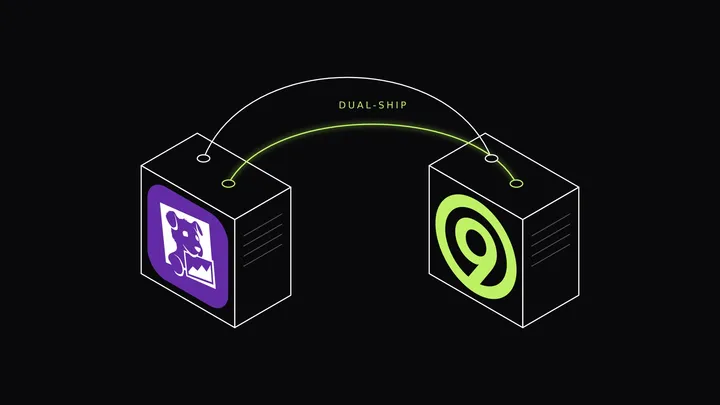
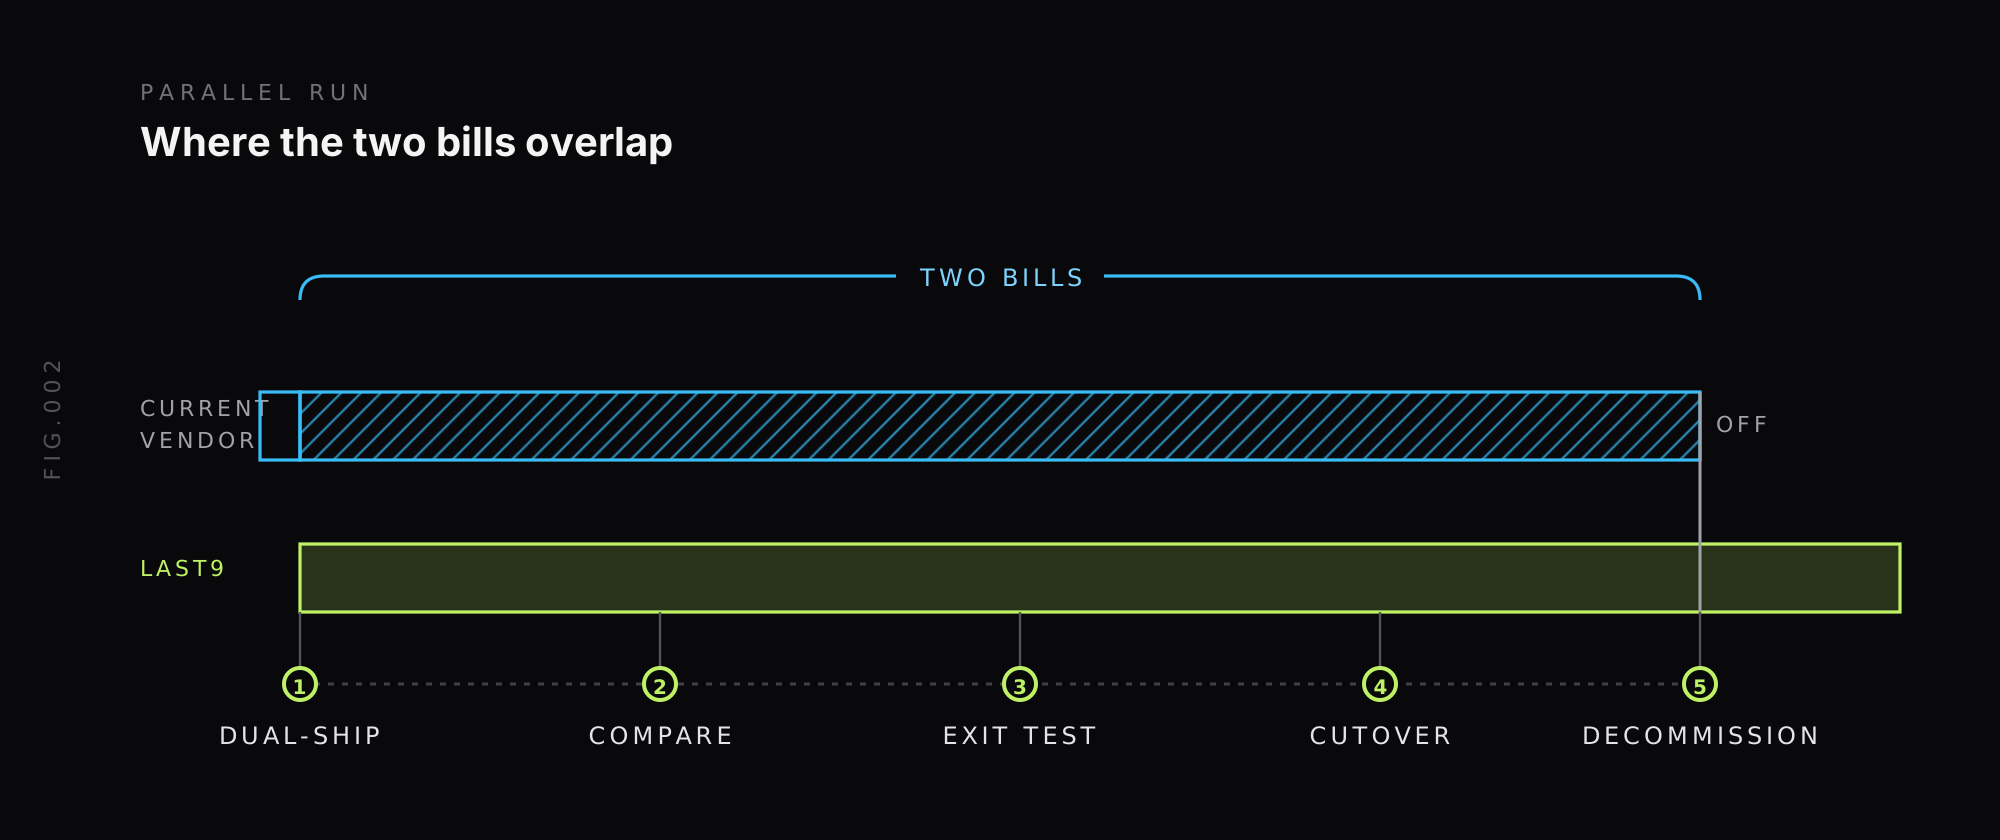
The lowest-risk way to move is to send the same telemetry to both vendors for a few weeks and compare them on real incidents. You validate against production data, and you can back out with no disruption if the new platform falls short. The cost is a temporary double bill, which is why the worksheet has an overlap row.
How to dual-ship:
- Datadog Agent. Add Last9 as an additional endpoint for metrics and traces, so the Agent dual-ships the same data to both. The setup is in our Datadog Agent docs, and the core of it is:
api_key: <DD_API_KEY>
# Metricsadditional_endpoints:  "https://{$last9_username}:{$last9_password}@{$last9_otlp_endpoint}/datadog":    - "<random_key>"
# Tracesapm_config: enabled: true additional_endpoints: "https://{$last9_username}:{$last9_password}@{$last9_otlp_endpoint}": - <random_key>- Prometheus. Add a second
remote_writeblock that points at Last9’s endpoint and keep the existing one. The Prometheus docs have the block. - OpenTelemetry Collector. Add a second exporter to the same pipeline. The Collector configuration reference covers multiple exporters per pipeline.
Write the exit criteria first. Before any data flows, agree on what “good enough to cut over” means, for example: every alert that fired on the old vendor in the window also fired on the new one, the on-call team resolved at least one real incident from the new tool, and the ten most-used dashboards match the old numbers within a tolerance you chose. Without written criteria, the parallel run drifts and the overlap bill grows.
Cut over in order. Move alert routing first, once the new alerts have matched for a full window. Move dashboards second. Switch the old vendor off last, and set the date in the contract before you start the run.
Observability migration checklist
Use this as the plan for the whole move. It merges the usual assess, plan, validate steps into one list:
- Inventory what you use. Pull the list of dashboards, monitors and saved views opened in the last 90 days. Everything else is a candidate to leave behind.
- Clean up tags and labels first. Inconsistent
service,envandteamlabels turn into broken dashboard variables on the other side. Standardize them on the old vendor before you move anything. - Check data compatibility. Confirm the new platform accepts your formats (OpenTelemetry, Prometheus remote write, vendor agent data) and your retention needs.
- Pick the platform against your requirements. Score integrations, query languages, deployment model and cost against the requirements you gathered, not against a feature checklist.
- Plan the parallel run with the exit criteria above.
- Train the on-call team on the new query language and alert flow before cutover, with real incidents, not slides.
- Validate after cutover. Re-check data accuracy and alert routing, and confirm every service still reports.
For ongoing practice after the move, see our observability best practices and the anatomy of a modern observability system.
Why observability migrations fail
Most stalled migrations trace back to process, not technology. Plan against these five:
- Hidden double billing. The overlap runs long because nobody set an end date, and the saving in the worksheet is eaten by two bills.
- Dashboards nobody opens. Teams copy hundreds of dashboards and alerts across, then maintain them forever. Migrate only what people used.
- Underestimating data and format differences. Metric names, label conventions and query semantics differ between vendors. Test your real queries early.
- Skipping validation. A migration that looks fine on a quiet week fails on the first incident. Compare the two tools on real incidents, and include a noisy one.
- Leaving service owners out. If the people who carry the pager learn about the change at cutover, they will route around it.
Why avoid a lift-and-shift migration?
A lift and shift copies every dashboard, alert and integration to the new platform exactly as it is. It is fast to start and expensive to keep, because you also copy every problem the old setup had.
Move only what is in active use. Rebuild noisy alerts instead of copying them: if an alert fired fifty times last month and nobody acted on it, a faithful copy fires fifty times on the new platform too. Use the move to retire dashboards that duplicate each other and to fix label names. Where the new platform has a better primitive for the job (say, ingest-time rules to drop a noisy source instead of paying to store it), use it.
Last9’s Control Plane drops, remaps, redacts, forwards and aggregates telemetry at ingest, before storage, and previews every rule against live data before you save it. That gives you a place to reshape data during the move instead of after it.
Requirement gathering and developer buy-in
Requirement gathering is how you find out what each team needs from the platform before you pick one. It also serves as your buy-in plan, because a team that wrote down its own requirements is far more likely to approve the result.
Collect requirements in one table, one row per team:
| Team | What they use it for | Must not break | Needs from the new tool |
|---|---|---|---|
| Backend engineers | Trace and log search during incidents | Existing trace queries, log retention | Fast query, same correlation |
| SRE and platform | Infrastructure metrics, alerting | Alert routing, SLO dashboards | Alerts as code, API access |
| Security | Audit and sensitive data handling | Redaction, access control | SSO, access controls, redaction at ingest |
| Product and business | Usage and funnel dashboards | Saved views | A plain-English or builder query path |
To win approval from service owners, keep the ask small:
- Send each owner a short list of the dashboards and alerts that will move, and ask them to strike what they no longer use.
- Name one contact for questions during the parallel run.
- Let them run their own last incident through both tools. Evidence from their own data persuades faster than a vendor demo.
- Tell them what they can stop doing, such as maintaining an old tagging scheme, as well as what changes for them.
Reviewing vendor services for an observability migration
Vendor services can make or break the move, and the extra charges are easy to miss. Ask these questions of every vendor, including us:
- Who does the dashboard and alert work? Get the split between vendor engineers and your team in writing. A Last9 forward deployed engineer runs the move with your team.
- What is the scope and timeline in writing? A timeline with no named deliverables is a hope. Compare it with the parallel-run plan above.
- What costs extra? Customization, training and post-launch support are the usual surprises.
- What does not import? A vendor that can say which parts need rework before you sign is one that has done the migration before.
- What support follows cutover? Troubleshooting and optimization in the first weeks matter more than the kickoff call.
Where to start this week
Pull your last three invoices and fill the current vendor column of the worksheet. That alone shows whether a migration is worth scoping, and it takes an afternoon.
If you run Datadog or Grafana, our comparison pages list what imports and what needs rework: Last9 vs Datadog and Last9 vs Grafana. If you are still weighing options, the Datadog alternatives guide and Datadog pricing breakdown cover the market and the meters.
To get the other column of the worksheet filled from your own volumes, schedule a demo and bring your invoices.
FAQ
How long does an observability migration usually take?
It depends on how many dashboards and alerts need rework, not on how much data you send. Last9 states that Datadog migrations land within 2 weeks, with dashboards and monitors imported in one click. Saved views, notebooks and vendor-specific queries are rebuilt by hand, so count them first. Then add a parallel run of a few weeks before cutover.
What should I watch out for when migrating observability platforms?
Plan against five things: double billing during the overlap, copying every dashboard and alert as-is, skipping validation against real incidents, ignoring tag and label hygiene, and leaving service owners out of the plan. Set exit criteria before the parallel run starts, and move only the dashboards and alerts people used in the last 90 days.
Can I migrate vendors without re-instrumenting everything?
Mostly, yes. If your services emit OpenTelemetry or Prometheus, you change an endpoint and credentials, not code. If they use a vendor agent, you can usually keep it and add a second destination. Last9 accepts dual-shipped Datadog Agent data, so nothing is re-instrumented to start. Vendor-specific SDKs and custom agent checks are the exceptions to list up front.
What is the safest way to run two observability vendors during a migration?
Dual-ship the same telemetry to both for a few weeks and compare them on real incidents. Keep the old vendor as the system of record until your exit criteria pass, then cut over alerts first and dashboards second. Budget for the overlap, because you pay both bills until the old vendor is switched off.
How do I build a business case for switching observability platforms?
Build a TCO worksheet from your own invoices: one row per meter, plus licence, cloud infrastructure, ops hours, one-time migration effort and the overlap months. Fill the current vendor column from the last three bills, get a written quote for the other column, and divide the one-time cost by the monthly saving to get a break-even point.
How do I get developers to approve an observability platform change?
Make the change small and reversible for them. Show each service owner the dashboards and alerts that move, give them a one-page checklist and a named contact, and let them compare both tools on their own last incident. Developers approve a switch when their on-call workflow keeps working, so the evidence should be their own data.


