
Prometheus is a leading open source monitoring solution. Its components include a powerful query language PromQL for interrogating metrics, integration with visualization solutions such as Grafana, and support for alerts that notify you of new problems in real time.
What is Kubernetes Operator
A Kubernetes Operator is a type of software extension for the Kubernetes system. Its job is to automate and simplify the management of other applications that are running within a Kubernetes environment. Essentially, it's a way to package, deploy, and manage a Kubernetes application.
Each Operator is designed for a specific application and comes with the knowledge needed to effectively manage that application. This includes tasks like handling updates, managing the application’s state, taking backups, and scaling. It's like having an automated systems administrator who knows exactly how to take care of your specific application, performing these tasks automatically so human administrators don't have to.
Use Cases of Kubernetes Operator
Here are some use cases where Kubernetes operators can be particularly useful:
1. Databases: Operators can help automate the deployment, scaling, backup, restoration, and update of databases. For example, the etcd Operator creates/configures/manages etcd clusters atop Kubernetes, while the PostgreSQL Operator by Zalando automates administrative tasks of a PostgreSQL cluster.
2. Message Brokers and Streams: Operators for message brokers, such as the RabbitMQ Operator or the Kafka Operator (Strimzi), can be used to manage complex, distributed streaming platforms on Kubernetes. These Operators take care of things like automatic configuration, provisioning and managing Kafka clusters, and rolling updates for changes.
3. Monitoring Tools: There are Operators like the Prometheus Operator, which simplifies the deployment and operation of Prometheus, Alertmanager, and related monitoring components.
4. Machine Learning Workflows: For machine learning workloads, there is the Kubeflow Operator that can help deploy and manage end-to-end machine learning stacks.
5. CI/CD Tools: Operators for CI/CD tools like Jenkins or Spinnaker can simplify the deployment, scaling, and management of these tools on Kubernetes.
6. Storage Systems: Rook is an open-source cloud-native storage orchestrator and its operator deploys and manages storage solutions in your Kubernetes cluster.
In all these cases, the use of Operators helps to significantly reduce the manual effort required to manage these applications and services, freeing up development and operations teams to focus more on building and improving their own software.
Prometheus Operator
The Prometheus Operator offers a seamless and automated method for deploying various components, such as the Prometheus server, Alertmanager, secrets, and configmaps, within a Kubernetes environment. This comprehensive solution enables the swift establishment of a Prometheus monitoring ecosystem, allowing users to effortlessly set up and monitor their Kubernetes clusters within a matter of minutes.
In this article, you'll learn about the advantages that the Prometheus operator provides compared to other Prometheus deployment methods for Kubernetes-based applications. You'll see how to install the operator in your cluster, define metrics, and set up alerts. This will prepare you to get your monitoring stack up and running quickly.
Kubernetes-based
Operators are application-specific Kubernetes extensions that provide custom resource definitions (CRDs) you can use to start an instance of the app. The operator is a Kubernetes controller that watches for new objects in your cluster and performs actions in response. This pattern simplifies the deployment and configuration of complex applications with many different components.
The Prometheus Operator provides the following Custom Resource Definitions (CRDs):
1. Prometheus: This CRD represents a Prometheus server instance and allows users to define the desired configuration for Prometheus.
2. Alertmanager: This CRD represents an Alertmanager instance and allows users to define the desired configuration for Alertmanager, which handles alerts generated by Prometheus.
3. ServiceMonitor: This CRD enables the discovery and monitoring of services running on a Kubernetes cluster. Users can define rules to specify which services should be monitored by Prometheus.
4. PrometheusRule: This CRD allows users to define alerting and recording rules for Prometheus. These rules provide the logic for generating alerts based on metrics collected by Prometheus.
5. PodMonitor: This CRD facilitates the monitoring of individual pods running on a Kubernetes cluster. Users can define rules to specify which pods should be monitored by Prometheus.
6. Probe: This CRD enables users to define custom health checks for Kubernetes endpoints or ingresses. Probes are used to determine the availability and readiness of services and can be integrated with Prometheus for monitoring.
These CRDs provided by the Prometheus Operator allow users to declaratively configure and manage Prometheus instance, Alertmanager, and various monitoring aspects such as Prometheus configuration within a Kubernetes environment.
The Prometheus Operator offers the following powerful features upon deployment:
1. Automation: Effortlessly launch a Prometheus instance tailored to your Kubernetes namespace, specific application, or team.
2. Service discovery: Automatically detect and monitor targets by utilizing familiar Kubernetes label queries and label selector relying on kubernetes api, eliminating the need to learn a Prometheus-specific configuration language.
3. Streamlined Configuration: Manage crucial Prometheus resources, such as versions, persistence, retention policies, and replicas, directly from a Kubernetes resource, making configuration hassle-free.
Deploying Prometheus Operator on Kubernetes
Prerequisites
You'll need access to a Kubernetes cluster before you begin. You can quickly set up a new single-node local cluster with minikube. Use the instructions in the minikube documentation to download and install the correct package for your system. Once minikube is installed, run minikube start to bring up your cluster.
minikube startAll the code examples from this post can be found here.
You'll also need kubectl to interact with Kubernetes. The standalone binary is available from the Kubernetes site, and it's also packaged within minikube as the minikube kubectl command.
Next, check whether Helm is available on your system. Install it with the following script if you don't already have the helm command:
curl -fsSL -o get_helm.sh https://raw.githubusercontent.com/helm/helm/main/scripts/get-helm-3

chmod 700 get_helm.sh

./get_helm.sh
You'll use Helm to add the Prometheus Operator to your cluster.
We will also need a web application to expose the Prometheus metrics that we will monitor.
Deploying the Prometheus Operator
The community kube-prometheus-stack Helm chart is the simplest way to launch a fully functioning Prometheus stack. It includes the following components:
- The Prometheus Operator
- The Prometheus time series database
- An Alertmanager instance for sending alerts based on changes to your metrics
- The Node Exporter to scrape metrics from your Kubernetes nodes
- kube-state-metrics to generate metrics about the objects in your Kubernetes cluster
- Grafana so you can assemble metrics into visual dashboards
To deploy the chart, first add Prometheus Community repository to your Helm repository list:
helm repo add prometheus-community https://prometheus-community.github.io/helm-chartsUpdate the repository list to discover the available charts:
helm repo updateNext, install the operator with the following command:
helm install prometheus prometheus-community/kube-prometheus-stack \
 -n prometheus \
 --create-namespace
This instructs Helm to deploy the kube-prometheus-stack chart into the prometheus namespace. The command might take a few seconds to complete.
After the release has installed, check whether everything's running by listing the pods in the prometheus namespace to find Prometheus pod, alertmanager pod, grafana pod and others:
kubectl get pods -n prometheus
NAME                                                     READY   STATUS              RESTARTS   AGE
alertmanager-prometheus-kube-prometheus-alertmanager-0   0/2     PodInitializing     0          29s
prometheus-grafana-56899d9669-c4ktg                      0/3     ContainerCreating   0          38s
prometheus-kube-prometheus-admission-patch-5g2rs         0/1     Completed           0          35s
prometheus-kube-prometheus-operator-7ff45466c4-gnhq8     1/1     Running             0          38s
prometheus-kube-state-metrics-57796b987b-8qk9h           1/1     Running             0          38s
prometheus-prometheus-kube-prometheus-prometheus-0       0/2     PodInitializing     0          29s
prometheus-prometheus-node-exporter-bml2x                1/1     Running             0          38s
It could take a few minutes for all the components to stabilize and transition to Running status. Wait a while before repeating the command if your pods aren't ready yet.
Accessing the Prometheus Web Interface
The Prometheus web interface is not exposed by default. You can access it using kubectl port forwarding. This will redirect a local port to the Prometheus service running in your cluster. The web UI listens on port 9090.
Running the following command forwards http://localhost:9090 to your Prometheus service:
kubectl port-forward -n prometheus svc/prometheus-kube-prometheus-prometheus 9090:9090

Forwarding from 127.0.0.1:9090 -> 9090

Forwarding from [::1]:9090 -> 9090
Now visit http://localhost:9090 in your web browser to access the Prometheus UI:
Next, run a simple query. In the Expression input at the top of the screen, search for the node_memory_MemFree_bytes gauge metric:
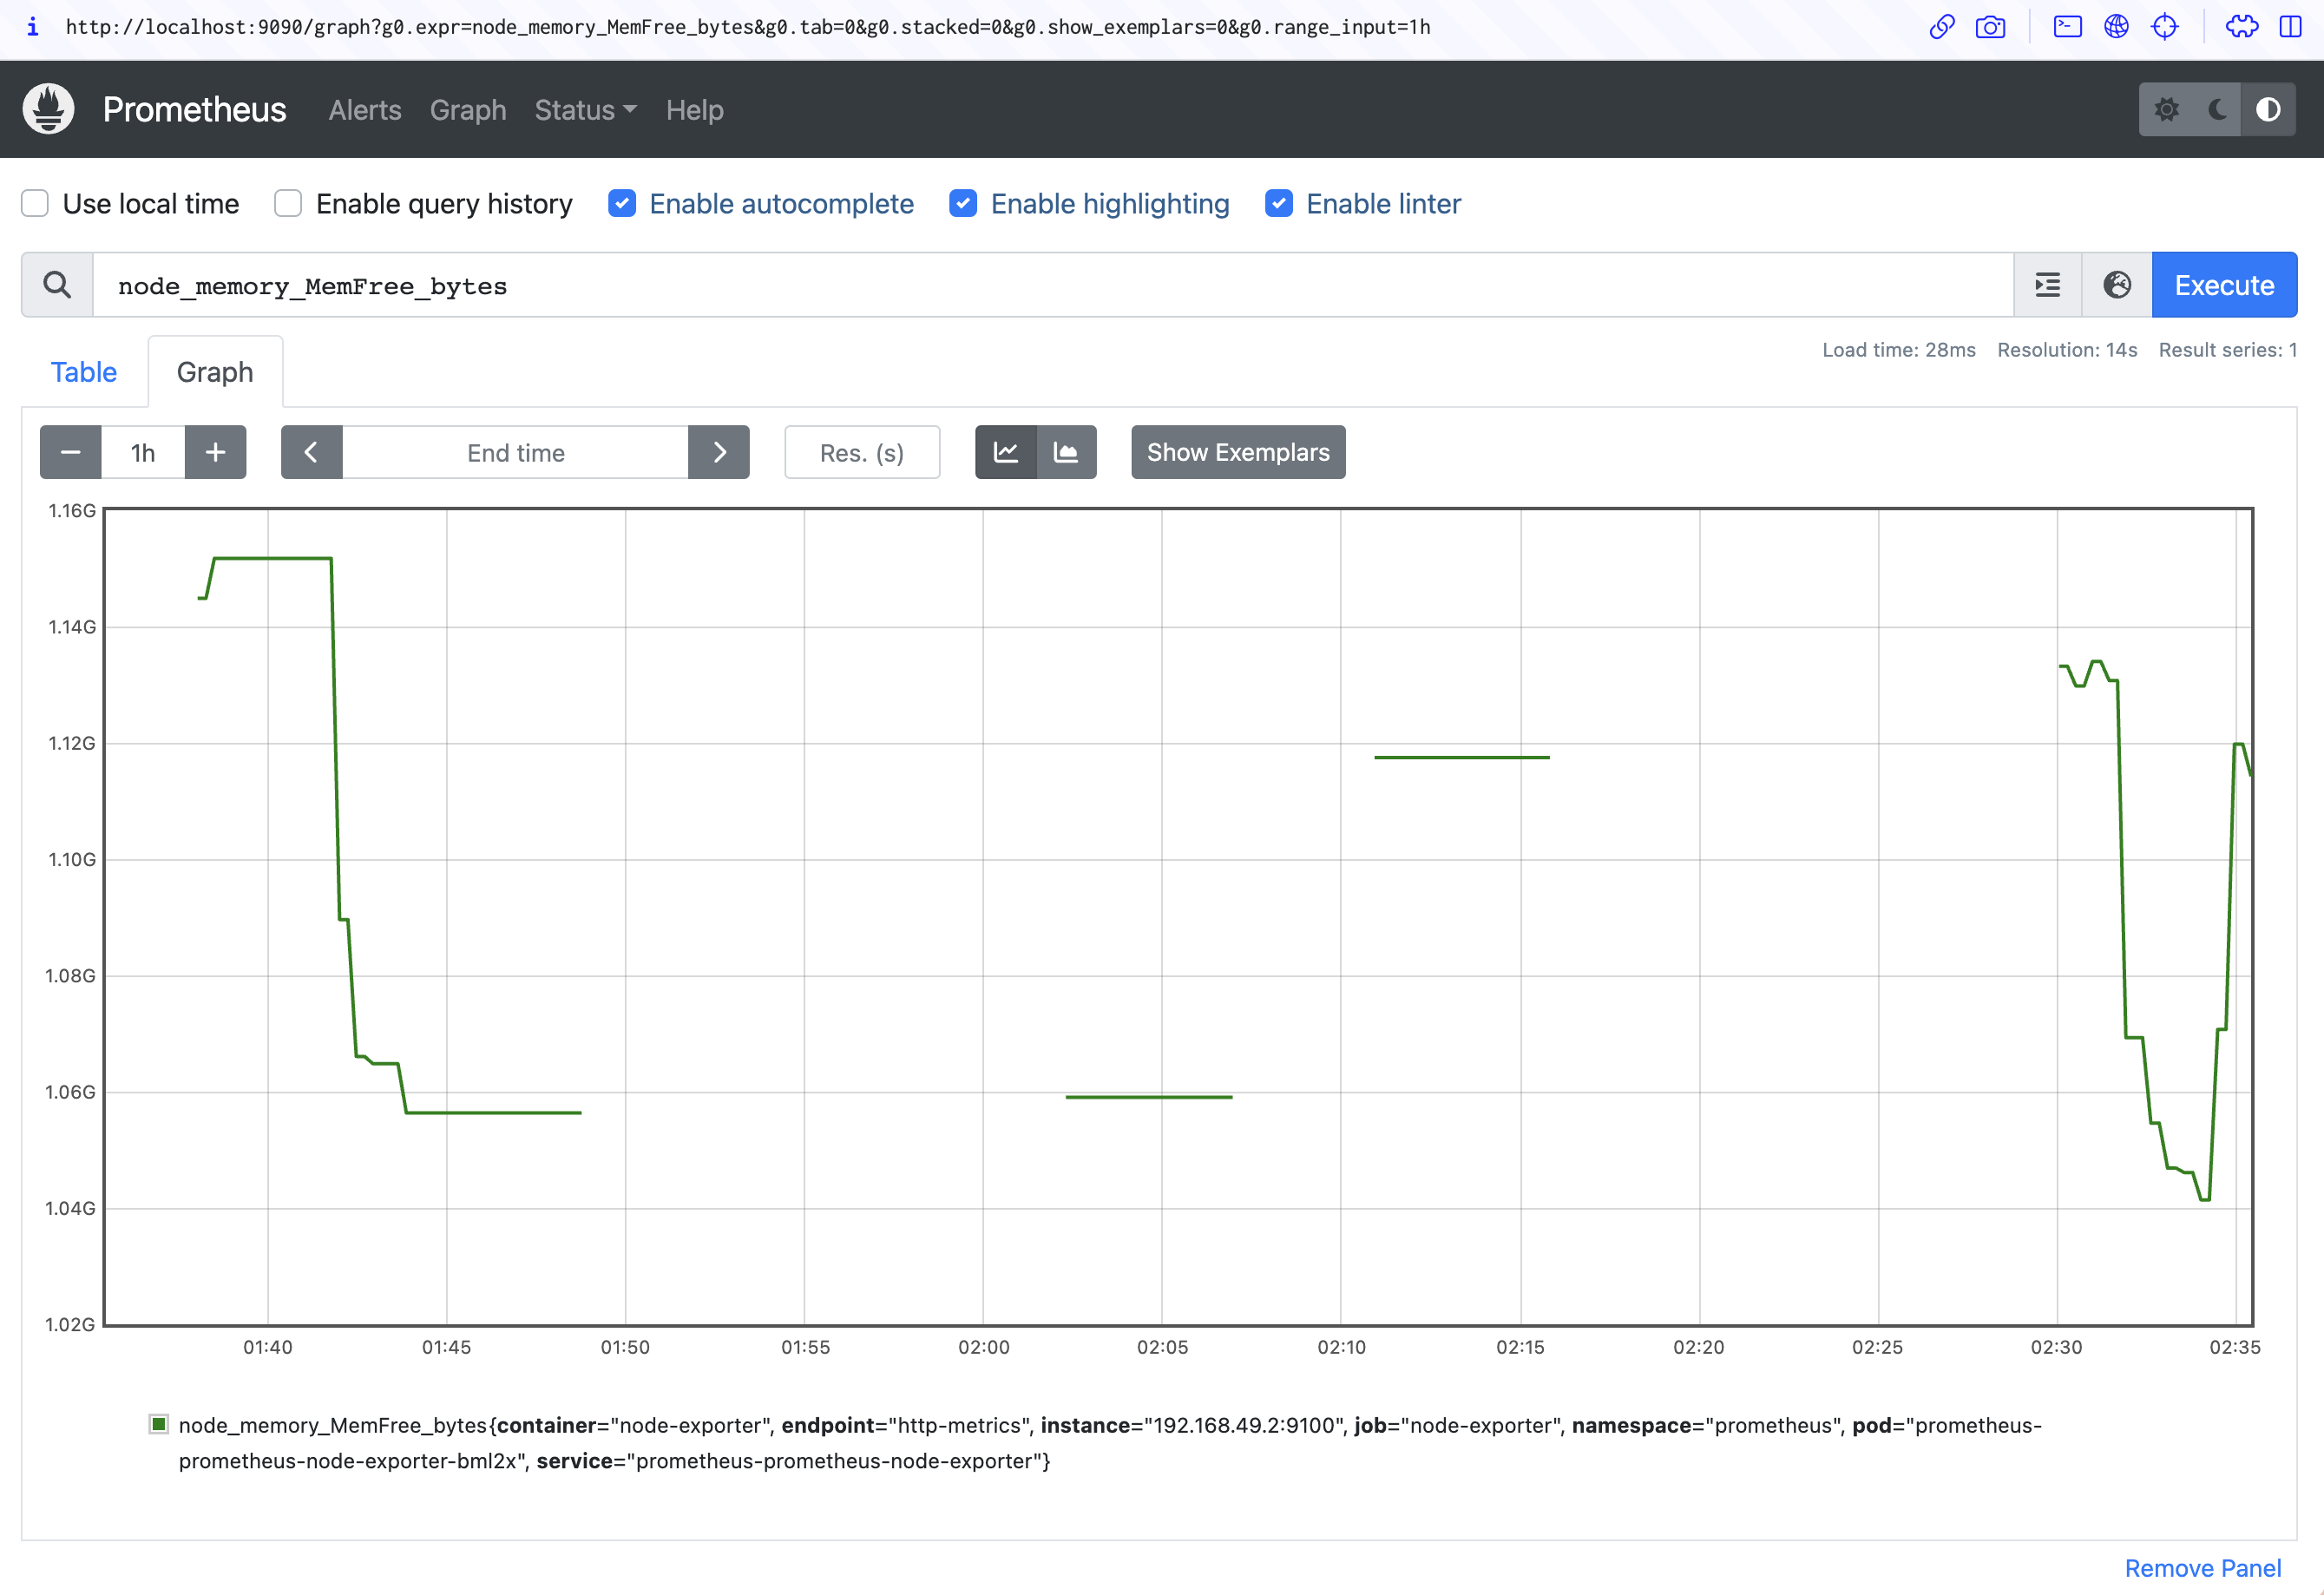
Click the Blue Execute button to the right of the screen. Switch to the Graph tab below the input to view the memory consumption of your Kubernetes node over time:
Using Grafana
Manually querying Prometheus for data in this way is inefficient and repetitive. Grafana lets you assemble Prometheus metrics into dashboards that are much more convenient to monitor. The kube-prometheus-stack chart includes a Grafana instance, and you can connect to the UI by port forwarding to port 80 of the prometheus-grafana service:
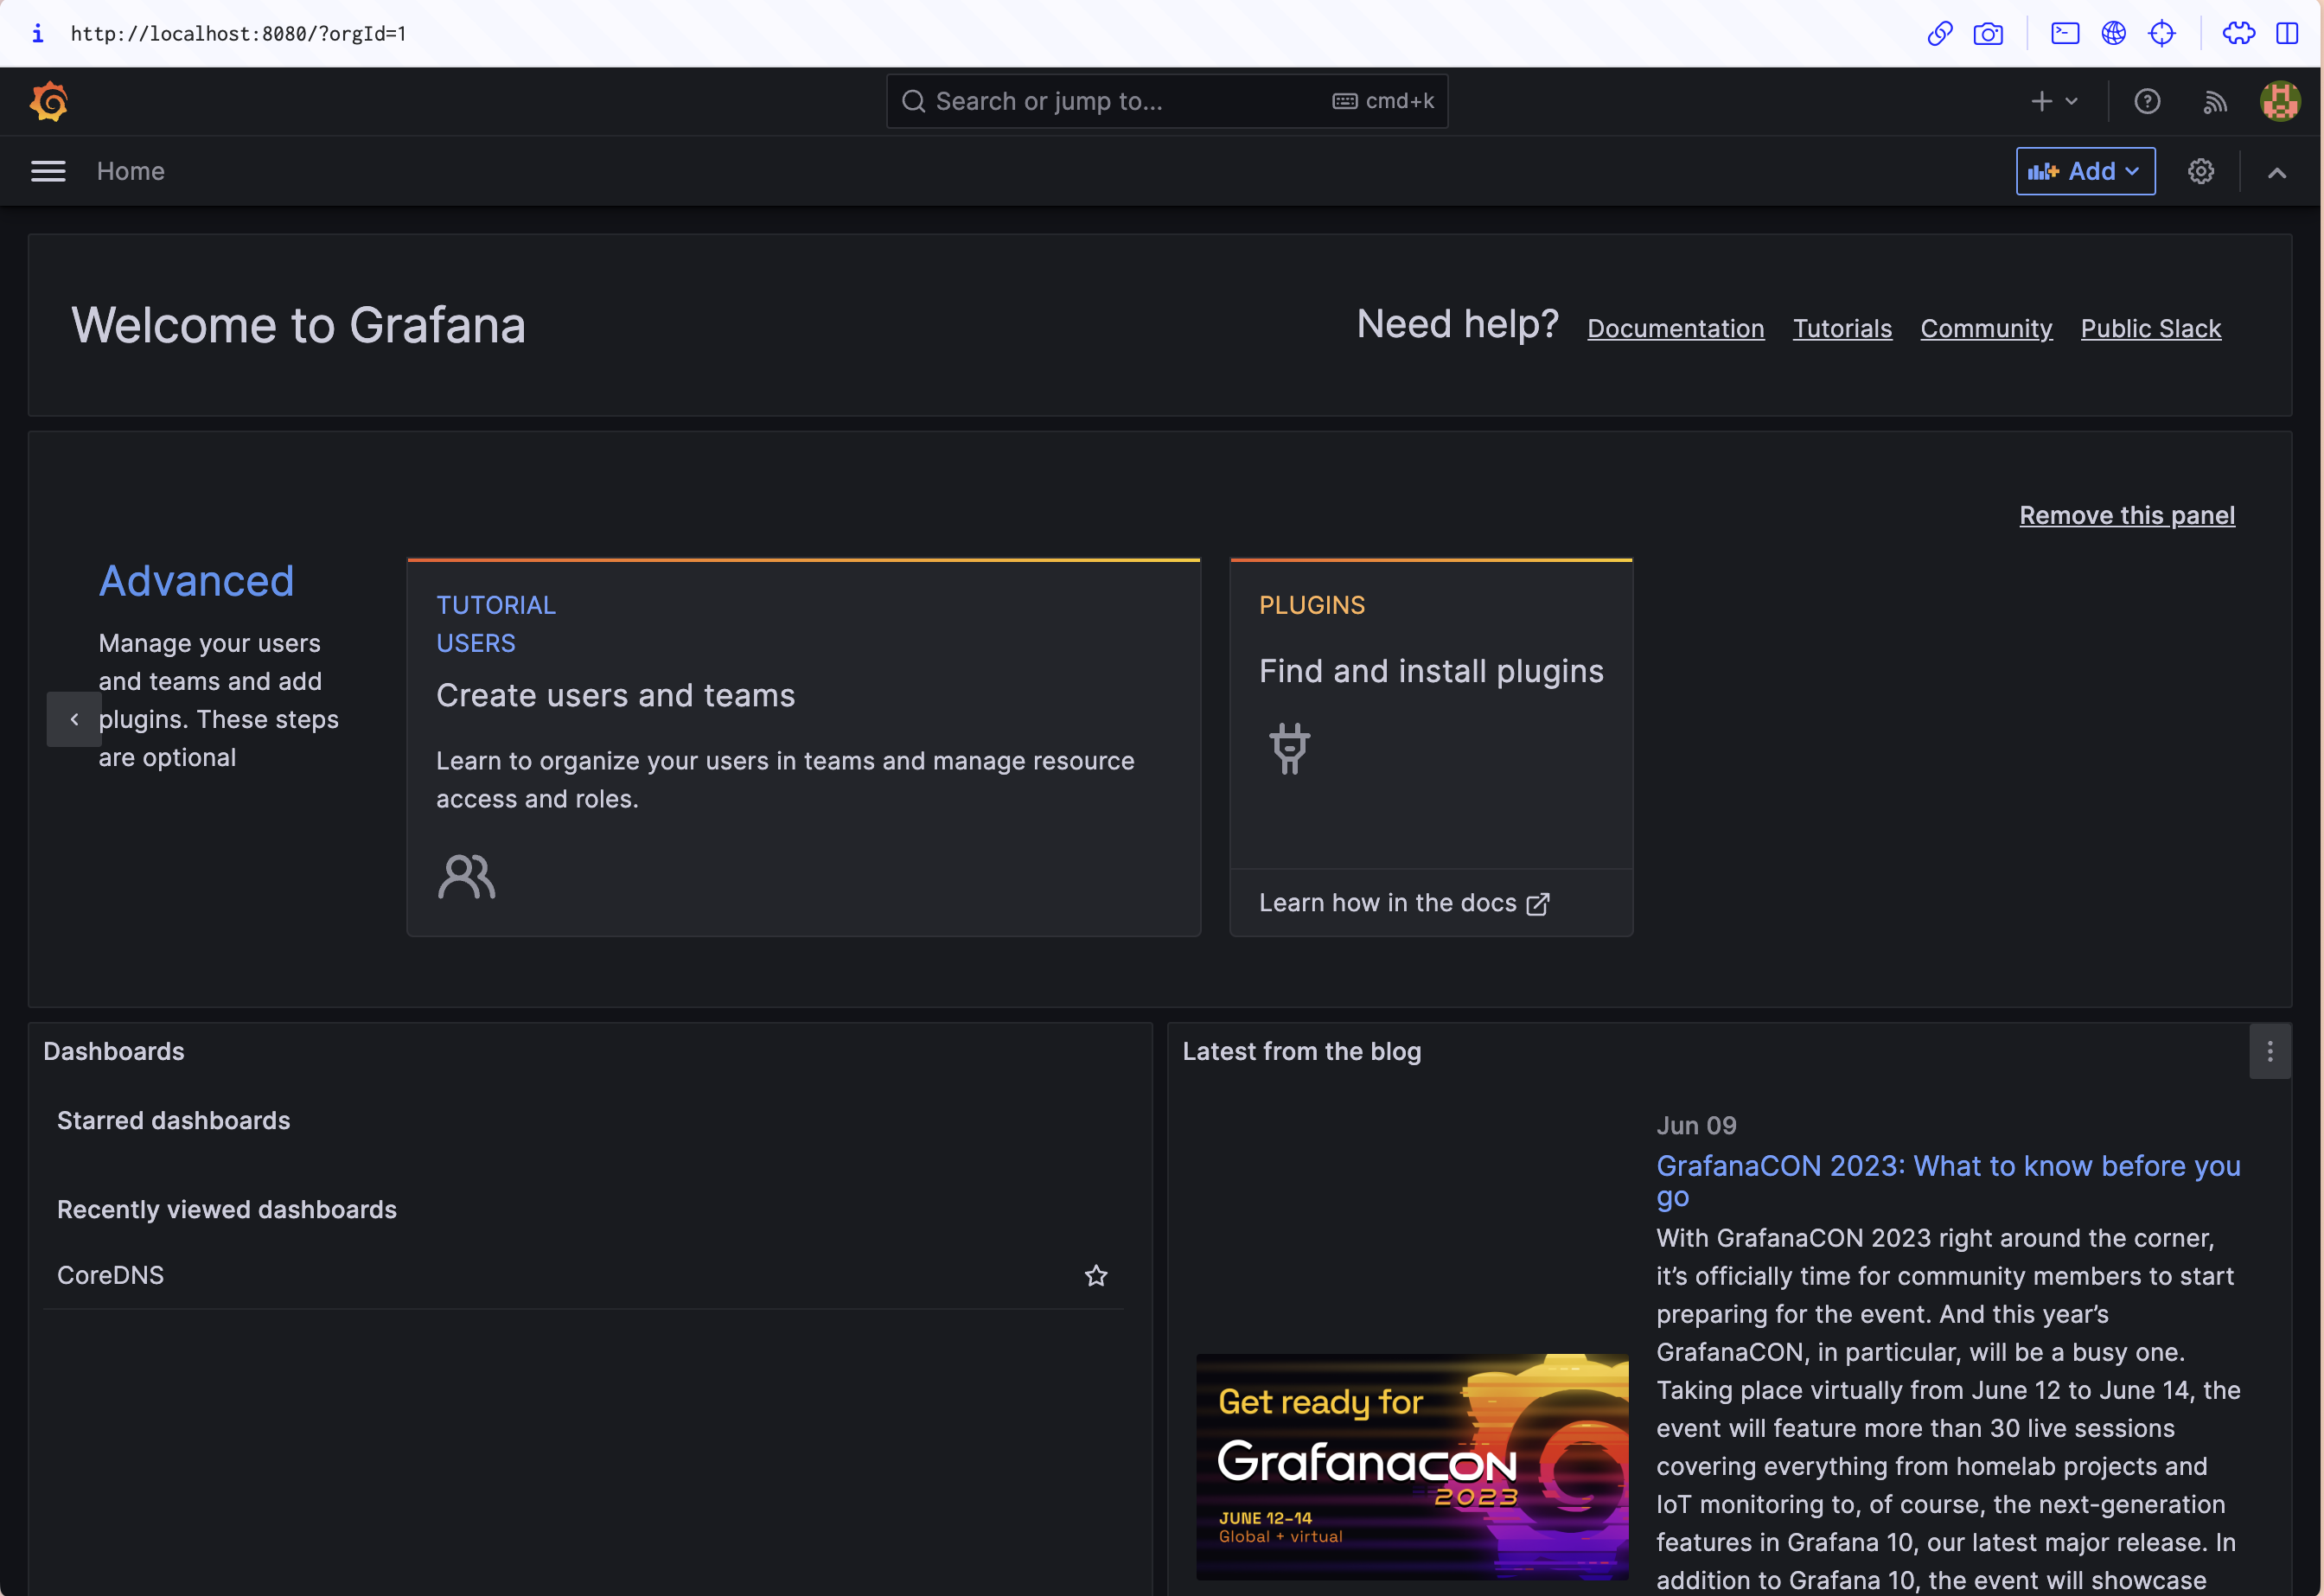
kubectl port-forward -n prometheus svc/prometheus-grafana 8080:80Visit http://localhost:8080 in your browser to access the Grafana login page. The default username is admin with a password of prom-operator.
Make sure you change these before you publicly expose the instance!
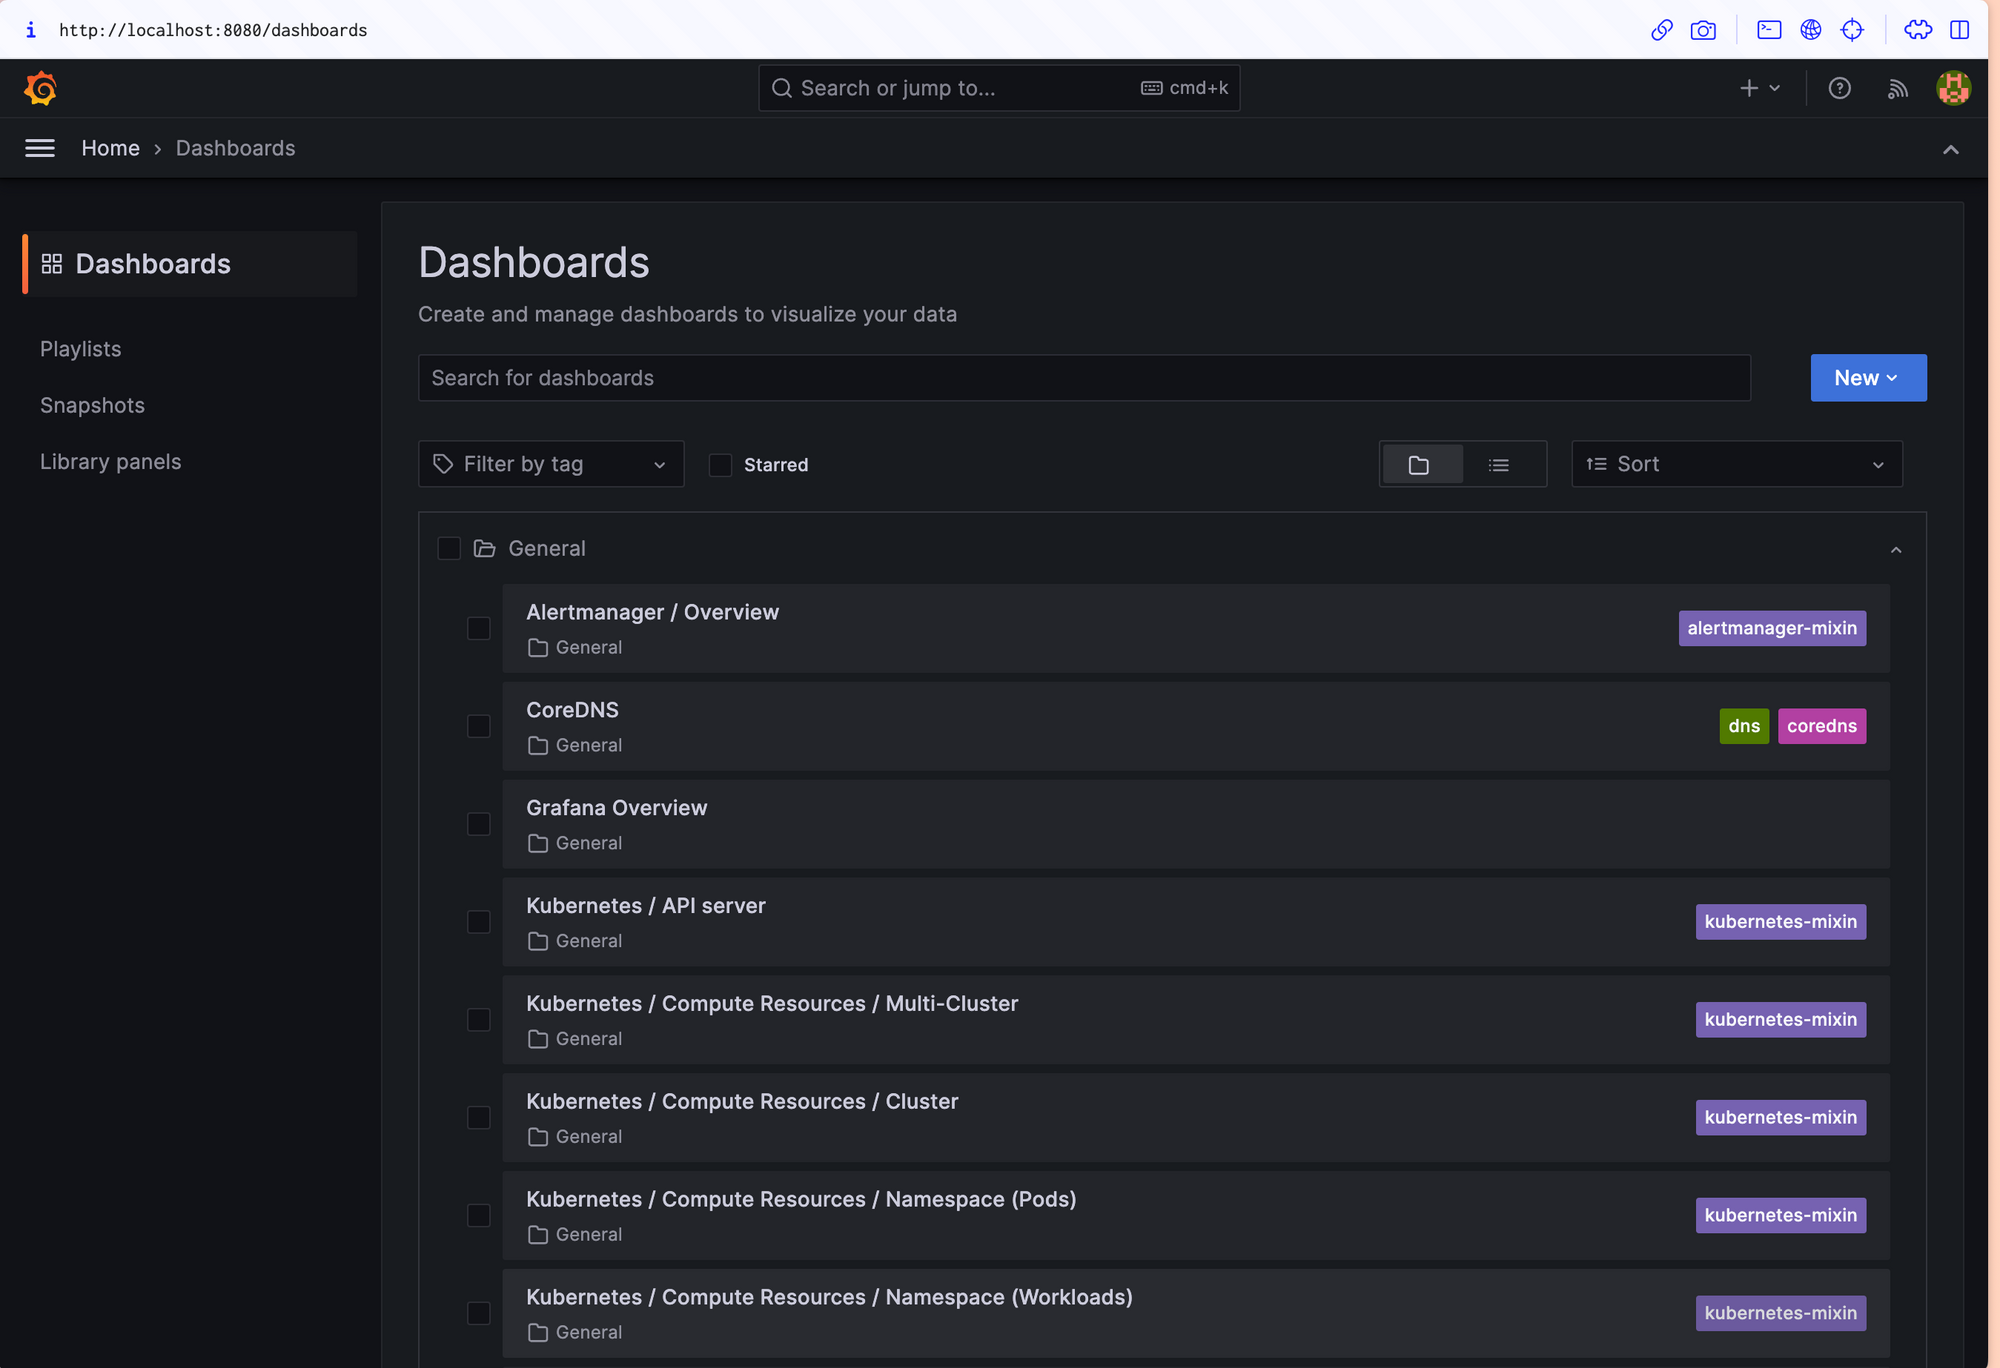
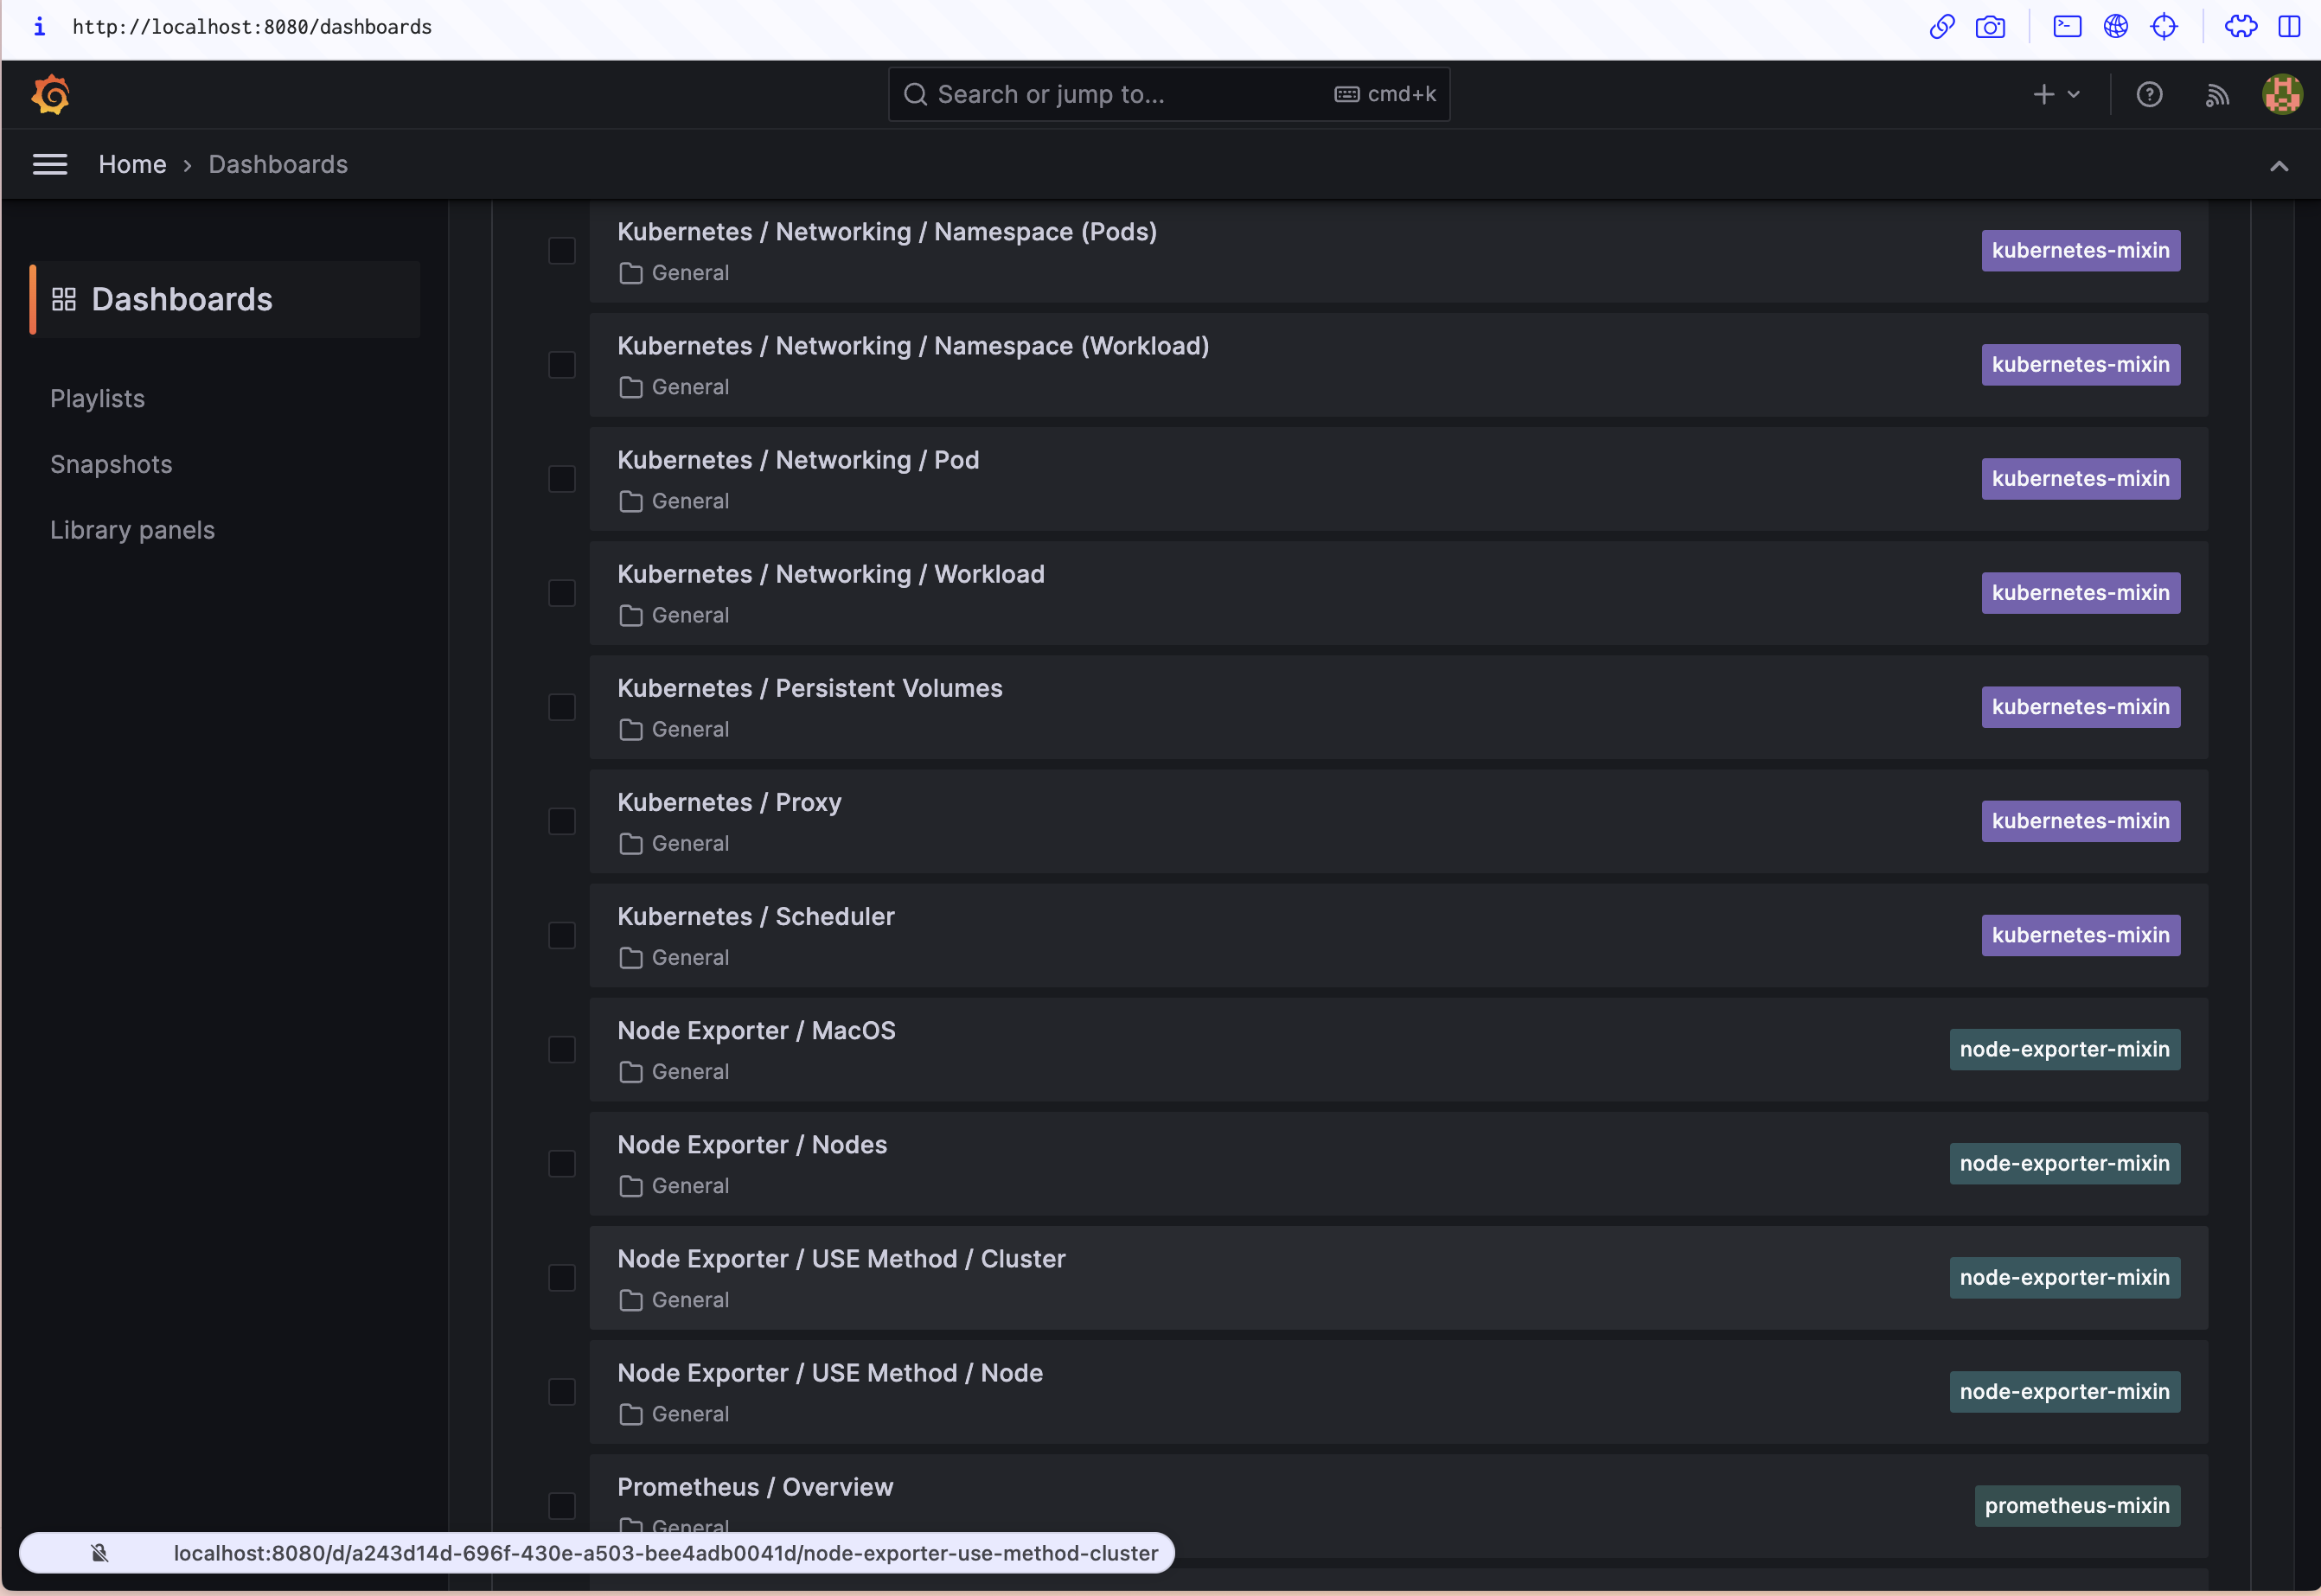
The kube-prometheus-stack project provides several prebuilt dashboards. You can find them by clicking the Dashboards icon in the left sidebar and then expanding the General folder. The dashboards cover your Kubernetes nodes, objects, API server, DNS, and Prometheus and Grafana instances.
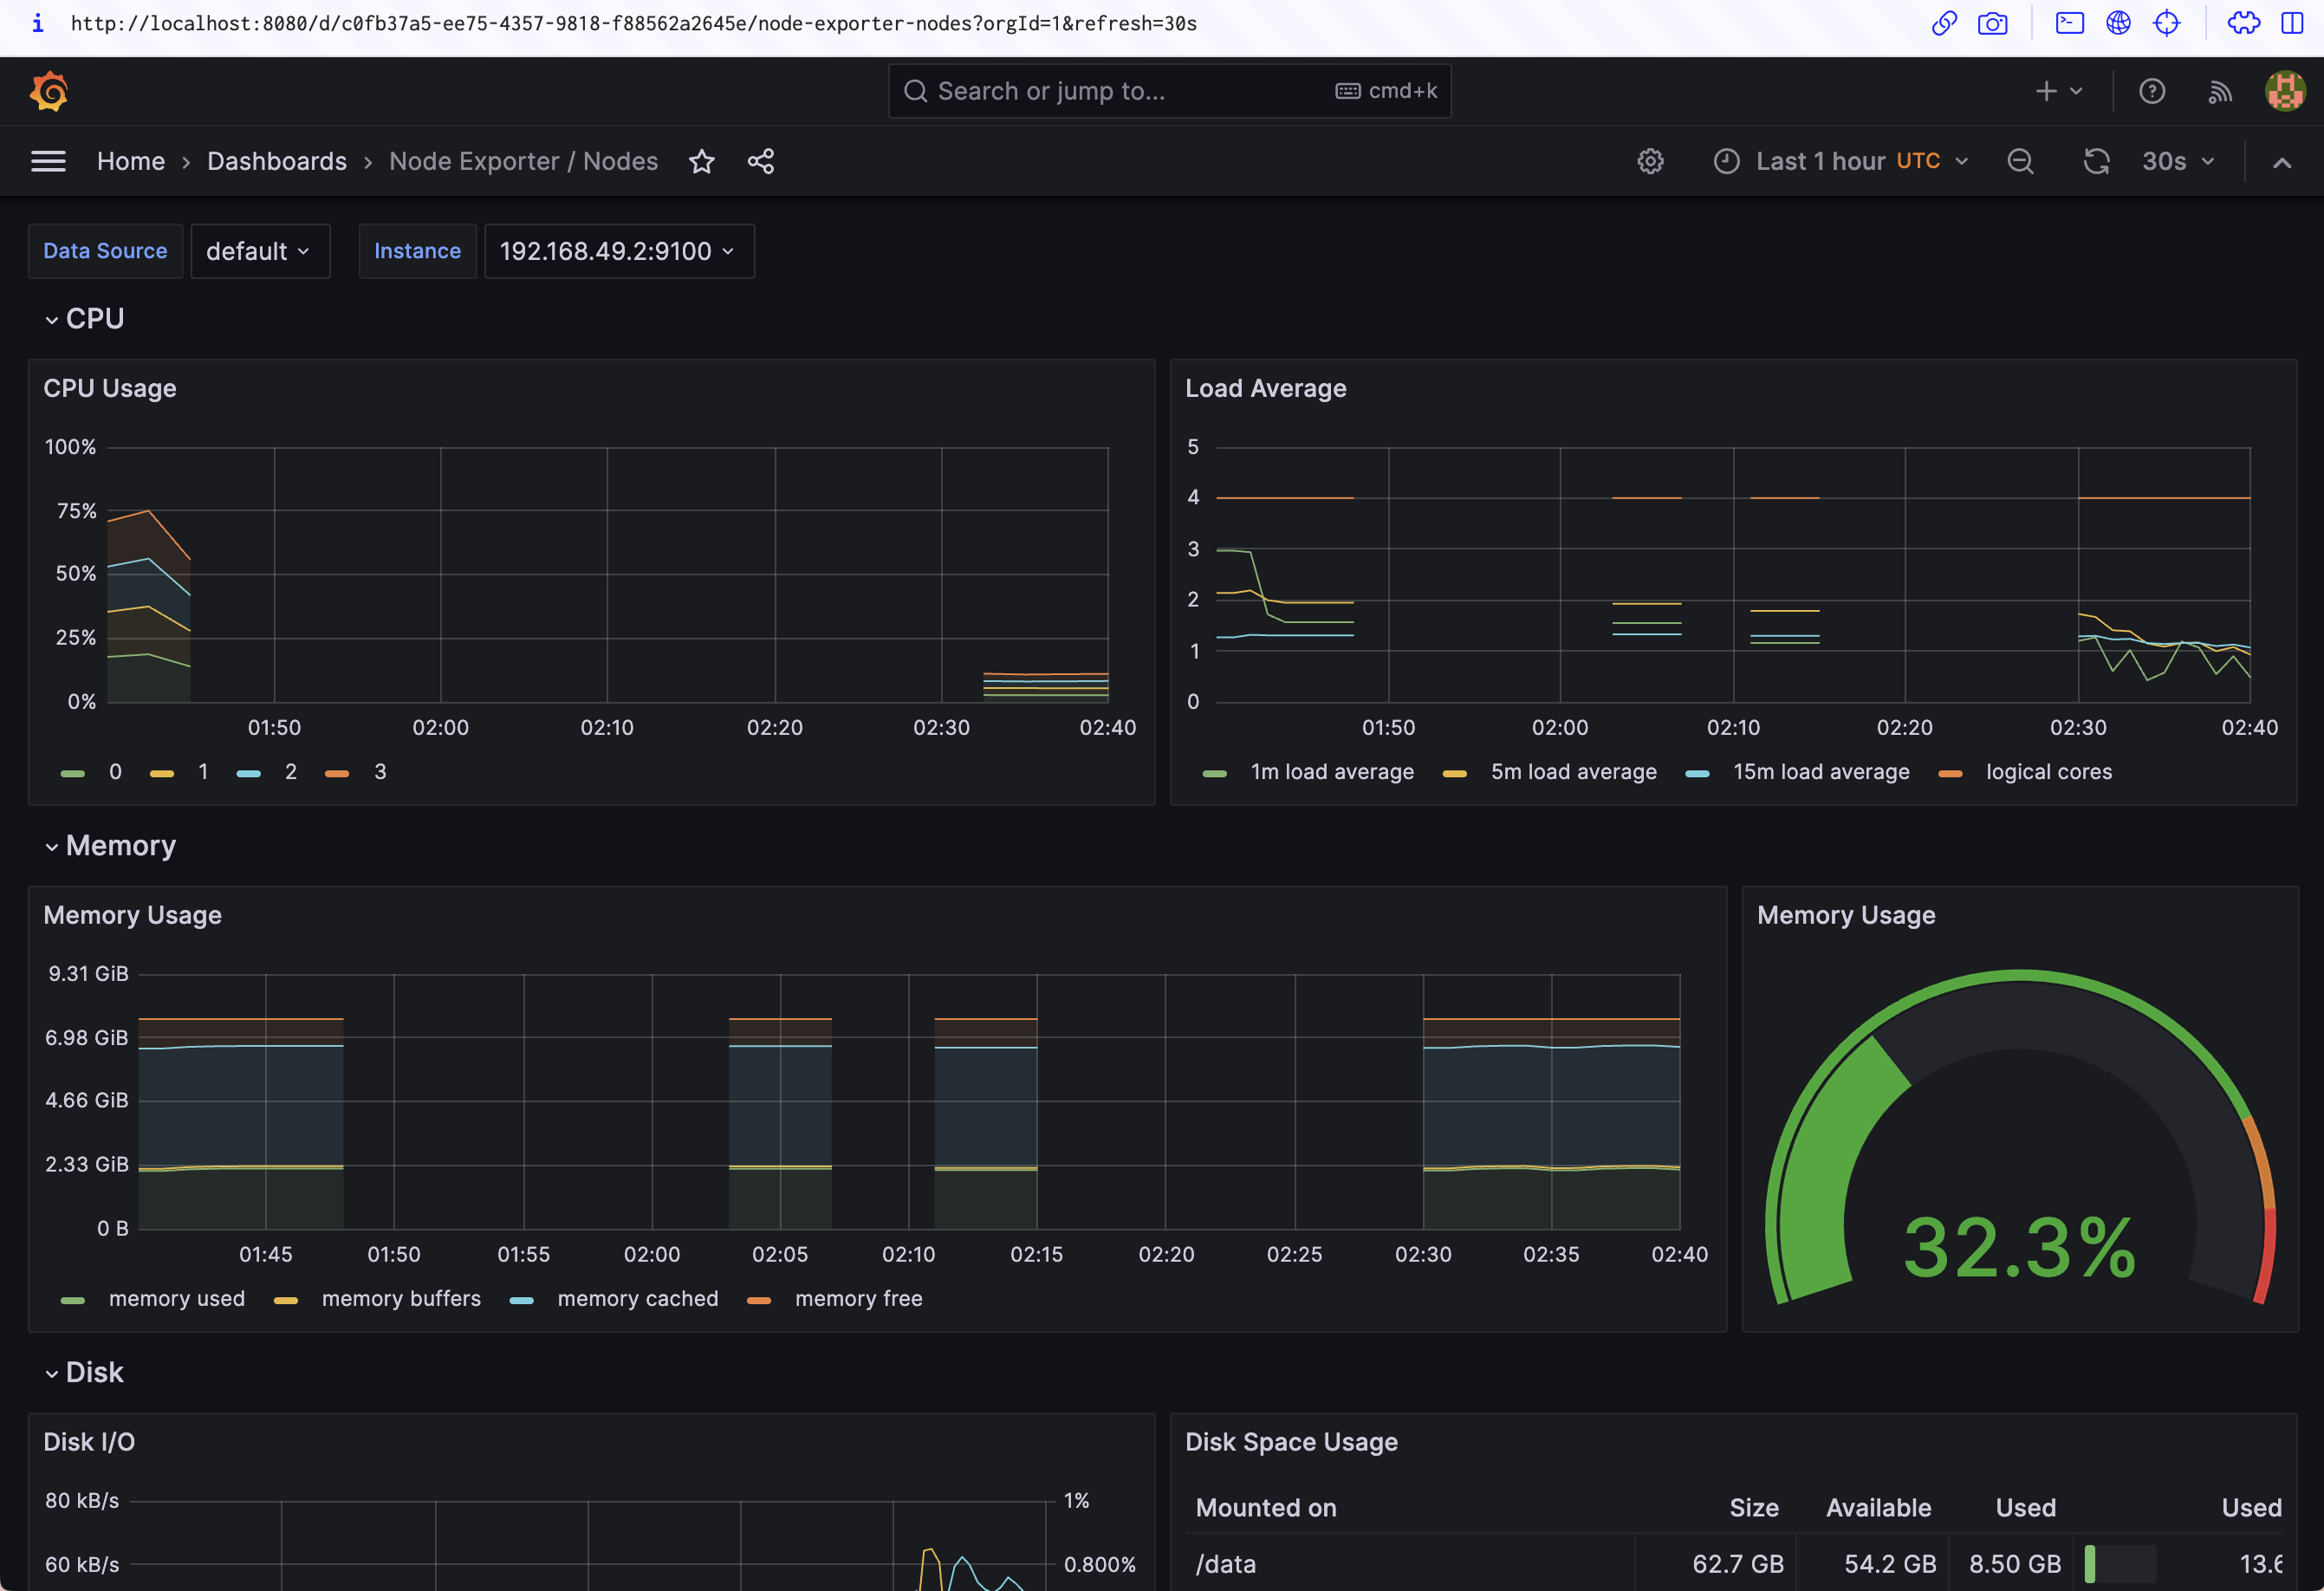
Here's the Node Exporter / Nodes dashboard, which shows the resource utilization of each of the nodes in your cluster:
Adding Your Own Metrics
The built-in dashboards are a great asset for monitoring the health of your cluster. Tracking resource utilization is vital so you can make informed scaling decisions.
However, Prometheus becomes even more powerful when you add metrics that relate directly to individual applications in your cluster.
Understand difference between metrics, logs, traces and events - the key pillars of observability.
Creating a Simple Demo App
Below is a Node.js counter app. It's incredibly simple — each time you visit a URI, the counter for that path increments by one:
const express = require("express");

 const prometheus = require("prom-client");

 const app = express();

 const requestCounter = new prometheus.Counter({

   name: "requestCount",

   help: "Number of requests made",

   labelNames: ["path"]

 });

 const requestCounterMiddleware = (req, res, next) => {

   if (req.path !== "/metrics") {

     requestCounter.inc({path: req.path});

   }

   next();
};


app.use(requestCounterMiddleware);


app.get("/metrics", (req, res) => {

  res.set("Content-Type", prometheus.register.contentType);

  prometheus.register.metrics().then(metrics => res.send(metrics));

});


app.get("*", (req, res) => {

  res.send("Hello World!");

});


app.listen(80, () => console.log("Listening!"));
This code uses the prom-client library to capture metrics and expose them in Prometheus format. While its details are out of scope for this article, you can use prom-client and similar packages for other languages to instrument your applications.
Now you can deploy this application to your Kubernetes cluster and connect its metrics to Prometheus. You'll need npm and Docker installed to follow along.
Copy the code above and save it to index.js in a new directory. Next, run the following command to install its dependencies:
npm install express prom-clientNow, copy the following Dockerfile to Dockerfile in the same directory:
FROM node:16
 WORKDIR /app
 COPY *.json ./
 RUN npm ci
 COPY *.js ./
 ENTRYPOINT ["node", "app.js"]
Use the following command to build your application's Docker image:
docker build -t <your_docker_hub_username>/prometheus-demo:latest .Push the image to your Docker Hub account so it's accessible to your Kubernetes cluster without having to set up private registry access:
docker push <your_docker_hub_username>/prometheus-demo:latestNext, deploy your application into your cluster. Copy the following YAML file and save it to prometheus-operator-demo.yaml:
---
apiVersion: apps/v1
kind: Deployment
metadata:
  name: prometheus-operator-demo
spec:
  replicas: 1
  selector:
    matchLabels:
      app: prometheus-operator-demo
  template:
    metadata:
      labels:
        app: prometheus-operator-demo
    spec:
      containers:
        - name: prometheus-operator-demo
          image: <your_docker_hub_username>/prometheus-operator-demo:latest
          ports:
            - name: http
              containerPort: 80

---
apiVersion: v1
kind: Service
metadata:
  name: prometheus-operator-demo
  labels:
    app: prometheus-operator-demo
spec:
  selector:
    app: prometheus-operator-demo
  ports:
    - name: http
      port: 80
This sets up a simple deployment and service to expose your application. The app: prometheus-operator-demo label set on the service will be used by Prometheus to identify it as a metrics scraping target in the next section.
Apply the manifest to your cluster using kubectl:
kubectl apply -f prometheus-operator-demo.yamlLaunch a port forwarding session to the service:
kubectl port-forward svc/prometheus-operator-demo 8000:80Now you can visit your application by heading to http://localhost:8000 in your browser:
Refresh the page a few times and then visit http://localhost:8000/metrics:
You'll see the raw metrics data, ready to be scraped by the Prometheus system.
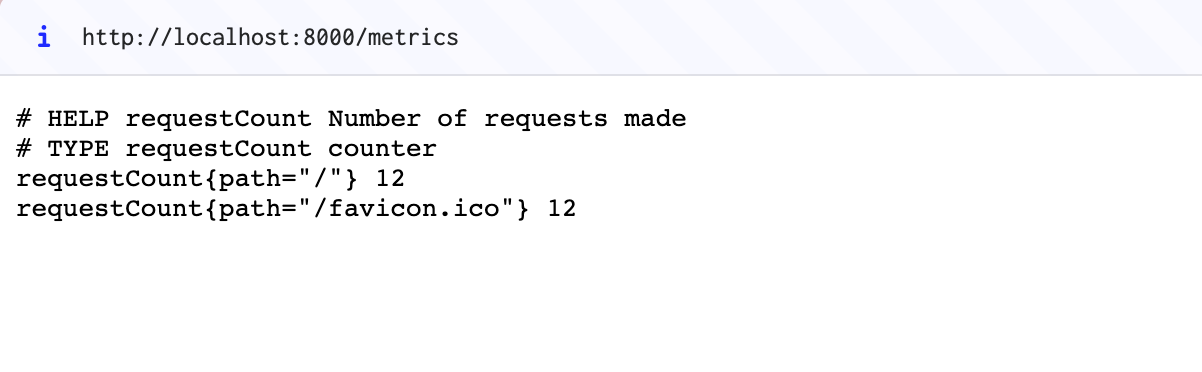
In the example above, the / route has been loaded twelve times by hitting the refresh key, and the browser attempted a single retrieval of /favicon.ico.
Collecting Metrics via Prometheus
The application is now running, and metrics are being exposed. Next, you need to set up a Prometheus monitor that will scrape the metrics from the application's endpoint.
Scrape Config and ServiceMonitor are two different approaches to configuring the scraping of metrics data in Prometheus.
1. Scrape Config:
Scrape Config, short for "scrape configuration," is a traditional method of configuring Prometheus to scrape metrics from specific targets. In the Scrape Config approach, the scraping configuration is directly defined in the Prometheus configuration file - prometheus.yml.
Scrape Config includes details such as the target URL, scraping interval, and any additional parameters required to access the metrics endpoint of the target. This approach is suitable for scenarios where a specific set of targets need to be scraped and the scraping configuration remains relatively static.
However, manually managing the Scrape Config in the Prometheus configuration file can become cumbersome as the number of targets or the complexity of the monitoring environment increases.
2. ServiceMonitor:
ServiceMonitor is a more dynamic and automated approach to configuring metric scraping in Prometheus, specifically designed for Kubernetes environments. It utilizes the Custom Resource Definition (CRD) provided by the Prometheus Operator.
With ServiceMonitor, the scraping configuration is defined as a Kubernetes resource rather than being directly specified in the Prometheus configuration file. Users create ServiceMonitor objects that define the desired scraping behavior for a group of Kubernetes services or pods based on labels.
ServiceMonitor automatically discovers and monitors services or pods based on the specified labels, eliminating the need for manual configuration updates as the environment changes. It provides more flexibility and scalability in dynamically discovering and monitoring targets within a Kubernetes cluster.
In summary, while Scrape Config is a manual and static method of configuring metric scraping in Prometheus, ServiceMonitor is a dynamic and automated approach tailored for Kubernetes environments, leveraging Kubernetes resources and labels for discovery and configuration.
Using ServiceMonitor
You can do this by creating a ServiceMonitor object, one of the custom resource definitions provided by the Kubernetes operator.
Copy the following YAML manifest and save it to prometheus-operator-demo-monitor.yaml:
---
apiVersion: monitoring.coreos.com/v1
kind: ServiceMonitor
metadata:
  name: demo-monitor
  labels:
    app: prometheus-operator-demo
    release: prometheus
spec:
  endpoints:
    - port: http
      path: /metrics
  selector:
    matchLabels:
      app: prometheus-operator-demo
Use kubectl to add the monitor to your cluster:
kubectl apply -f prometheus-operator-demo-monitor.yaml

 servicemonitor.monitoring.coreos.com/prometheus-operator-demo-monitor created
This monitor configures a scrape of the /metrics endpoint of services with the app: prometheus-operator-demo label. The endpoints.port field instructs Prometheus to direct scraping requests to the port named http that's defined by the service. The service monitor also has a release: prometheus label assigned. This is required for the Prometheus operator to detect the new monitor and register it as a target.
The Prometheus resource created by the kube-prometheus-stack has a selector which says, act on all the Service Monitors with label release: prometheus (configuration).
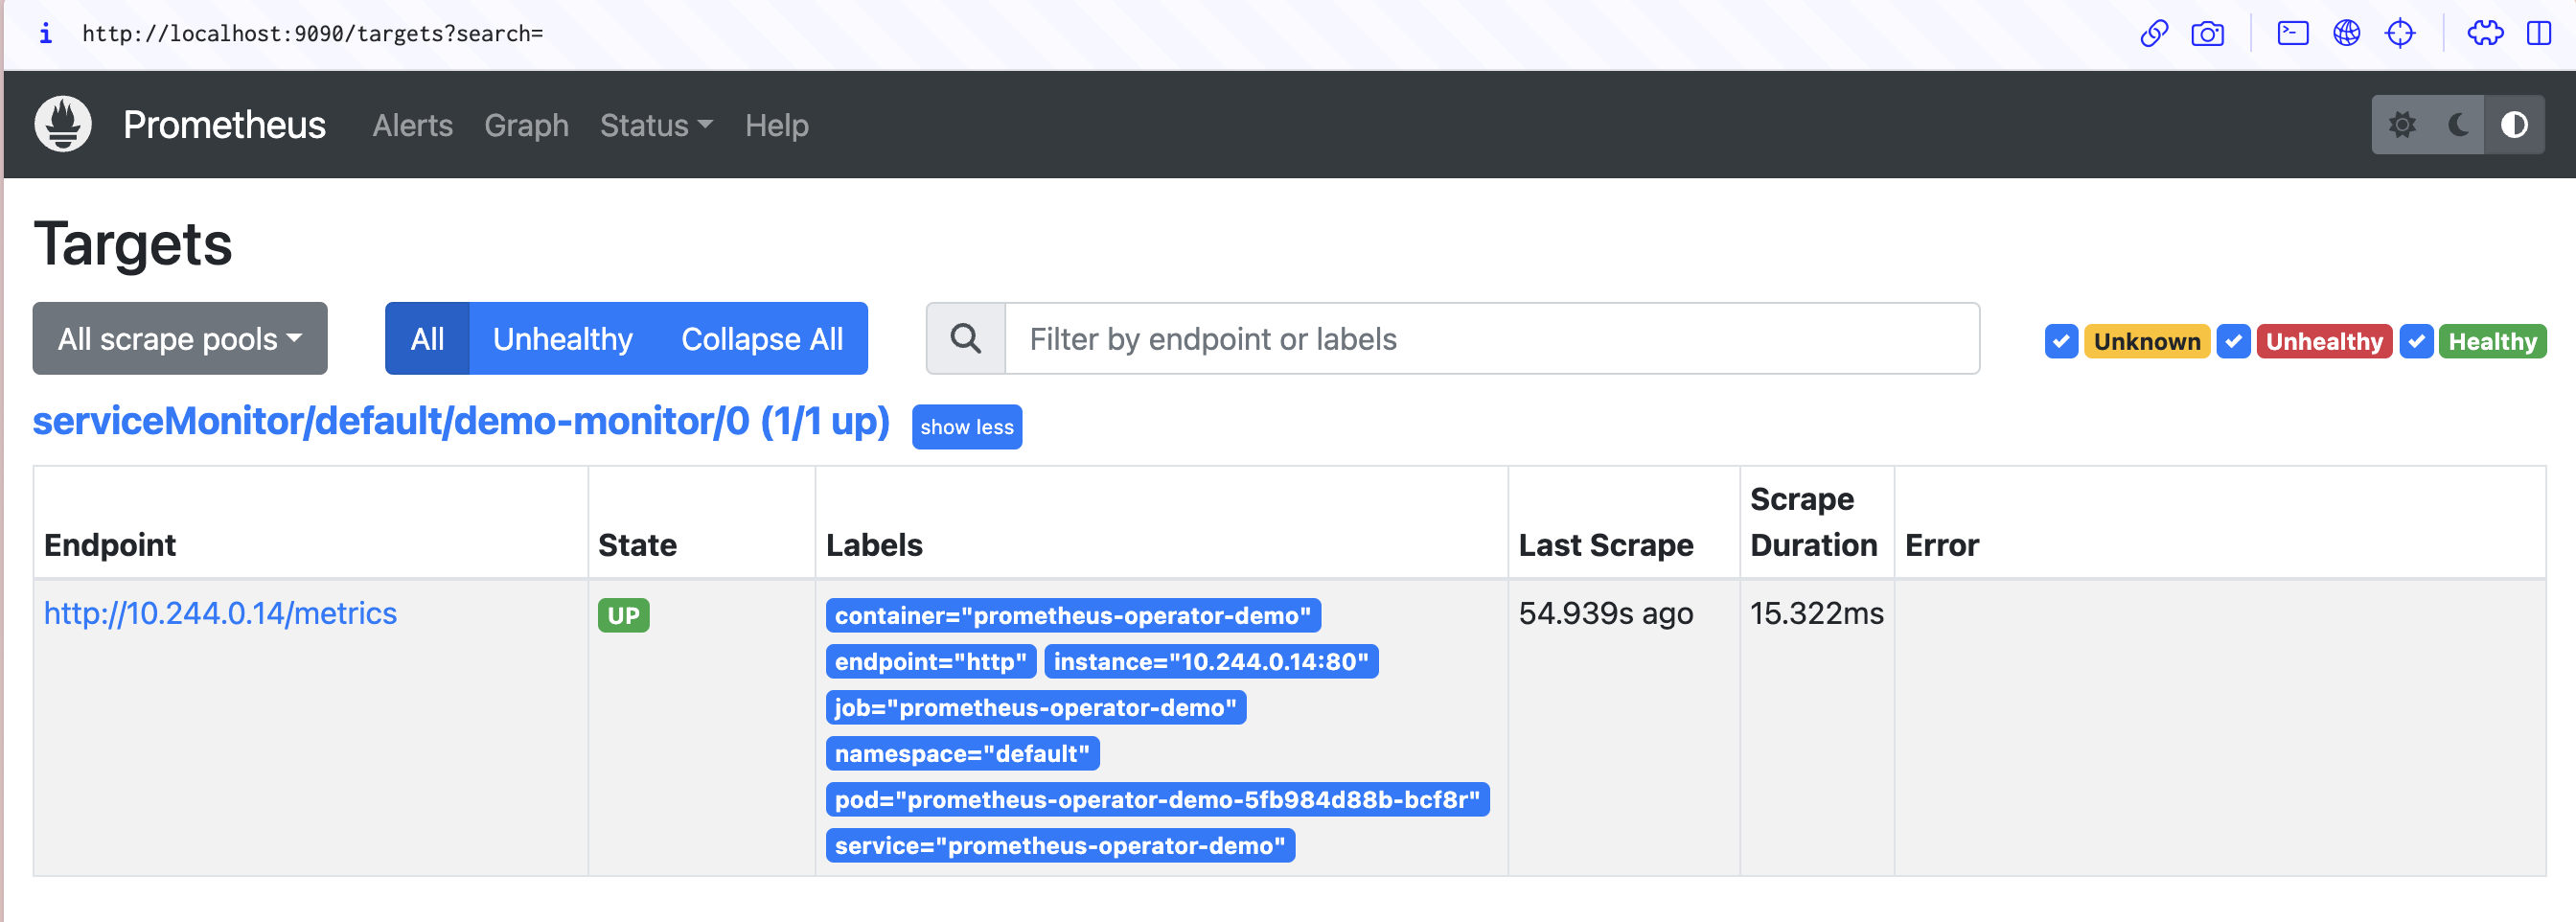
Return to the Prometheus UI in your browser (http://localhost:9090) and head to the Status > Targets page using the menu at the top of the screen. You can also visit http://localhost:9090/targets directly. The page should include an entry for your prometheus-operator-demo-monitor service monitor that shows the last scrape time and its duration:
Now return to the home screen and enter requestCount into the Expression input used earlier. requestCount is the name of the counter created by the demo application. Execute the query and switch to the Graph tab to visualize the requests made to your application over time.
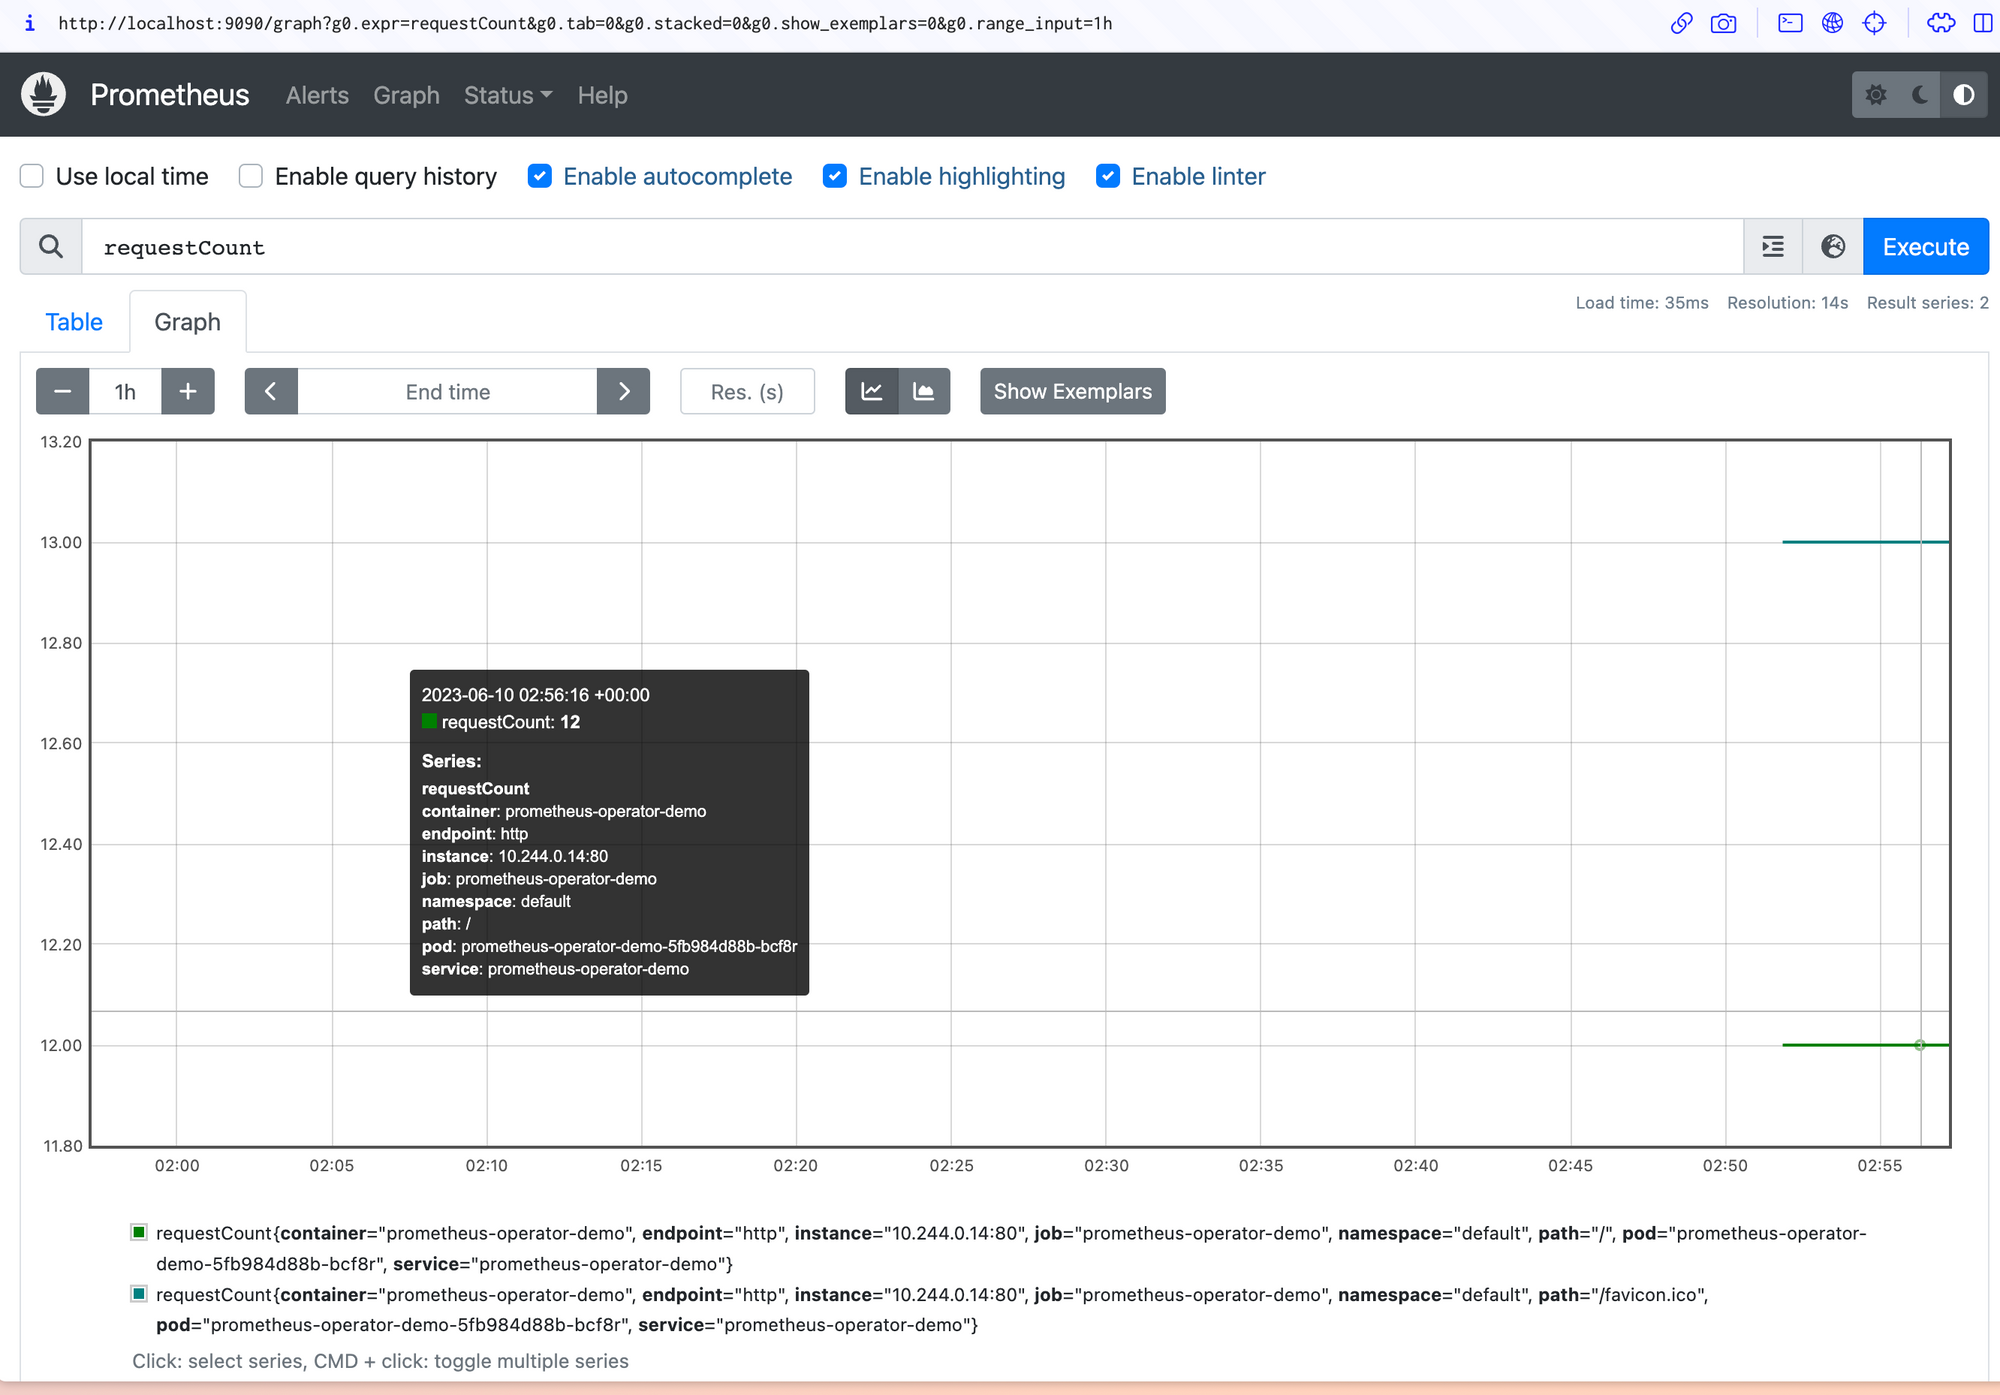
New requests you make will appear in the data each time a Prometheus scrape occurs. This defaults to every sixty seconds.
Creating a Grafana Dashboard
To create a Grafana dashboard for the metric, click Dashboards > New dashboard in the sidebar and then Add a new panel on the screen that appears.
Check that the data source in the Query tab is set to Prometheus. Click the Select metric dropdown and search for your requestCount metric, then press the Run queries button to update the preview. Your data should display.
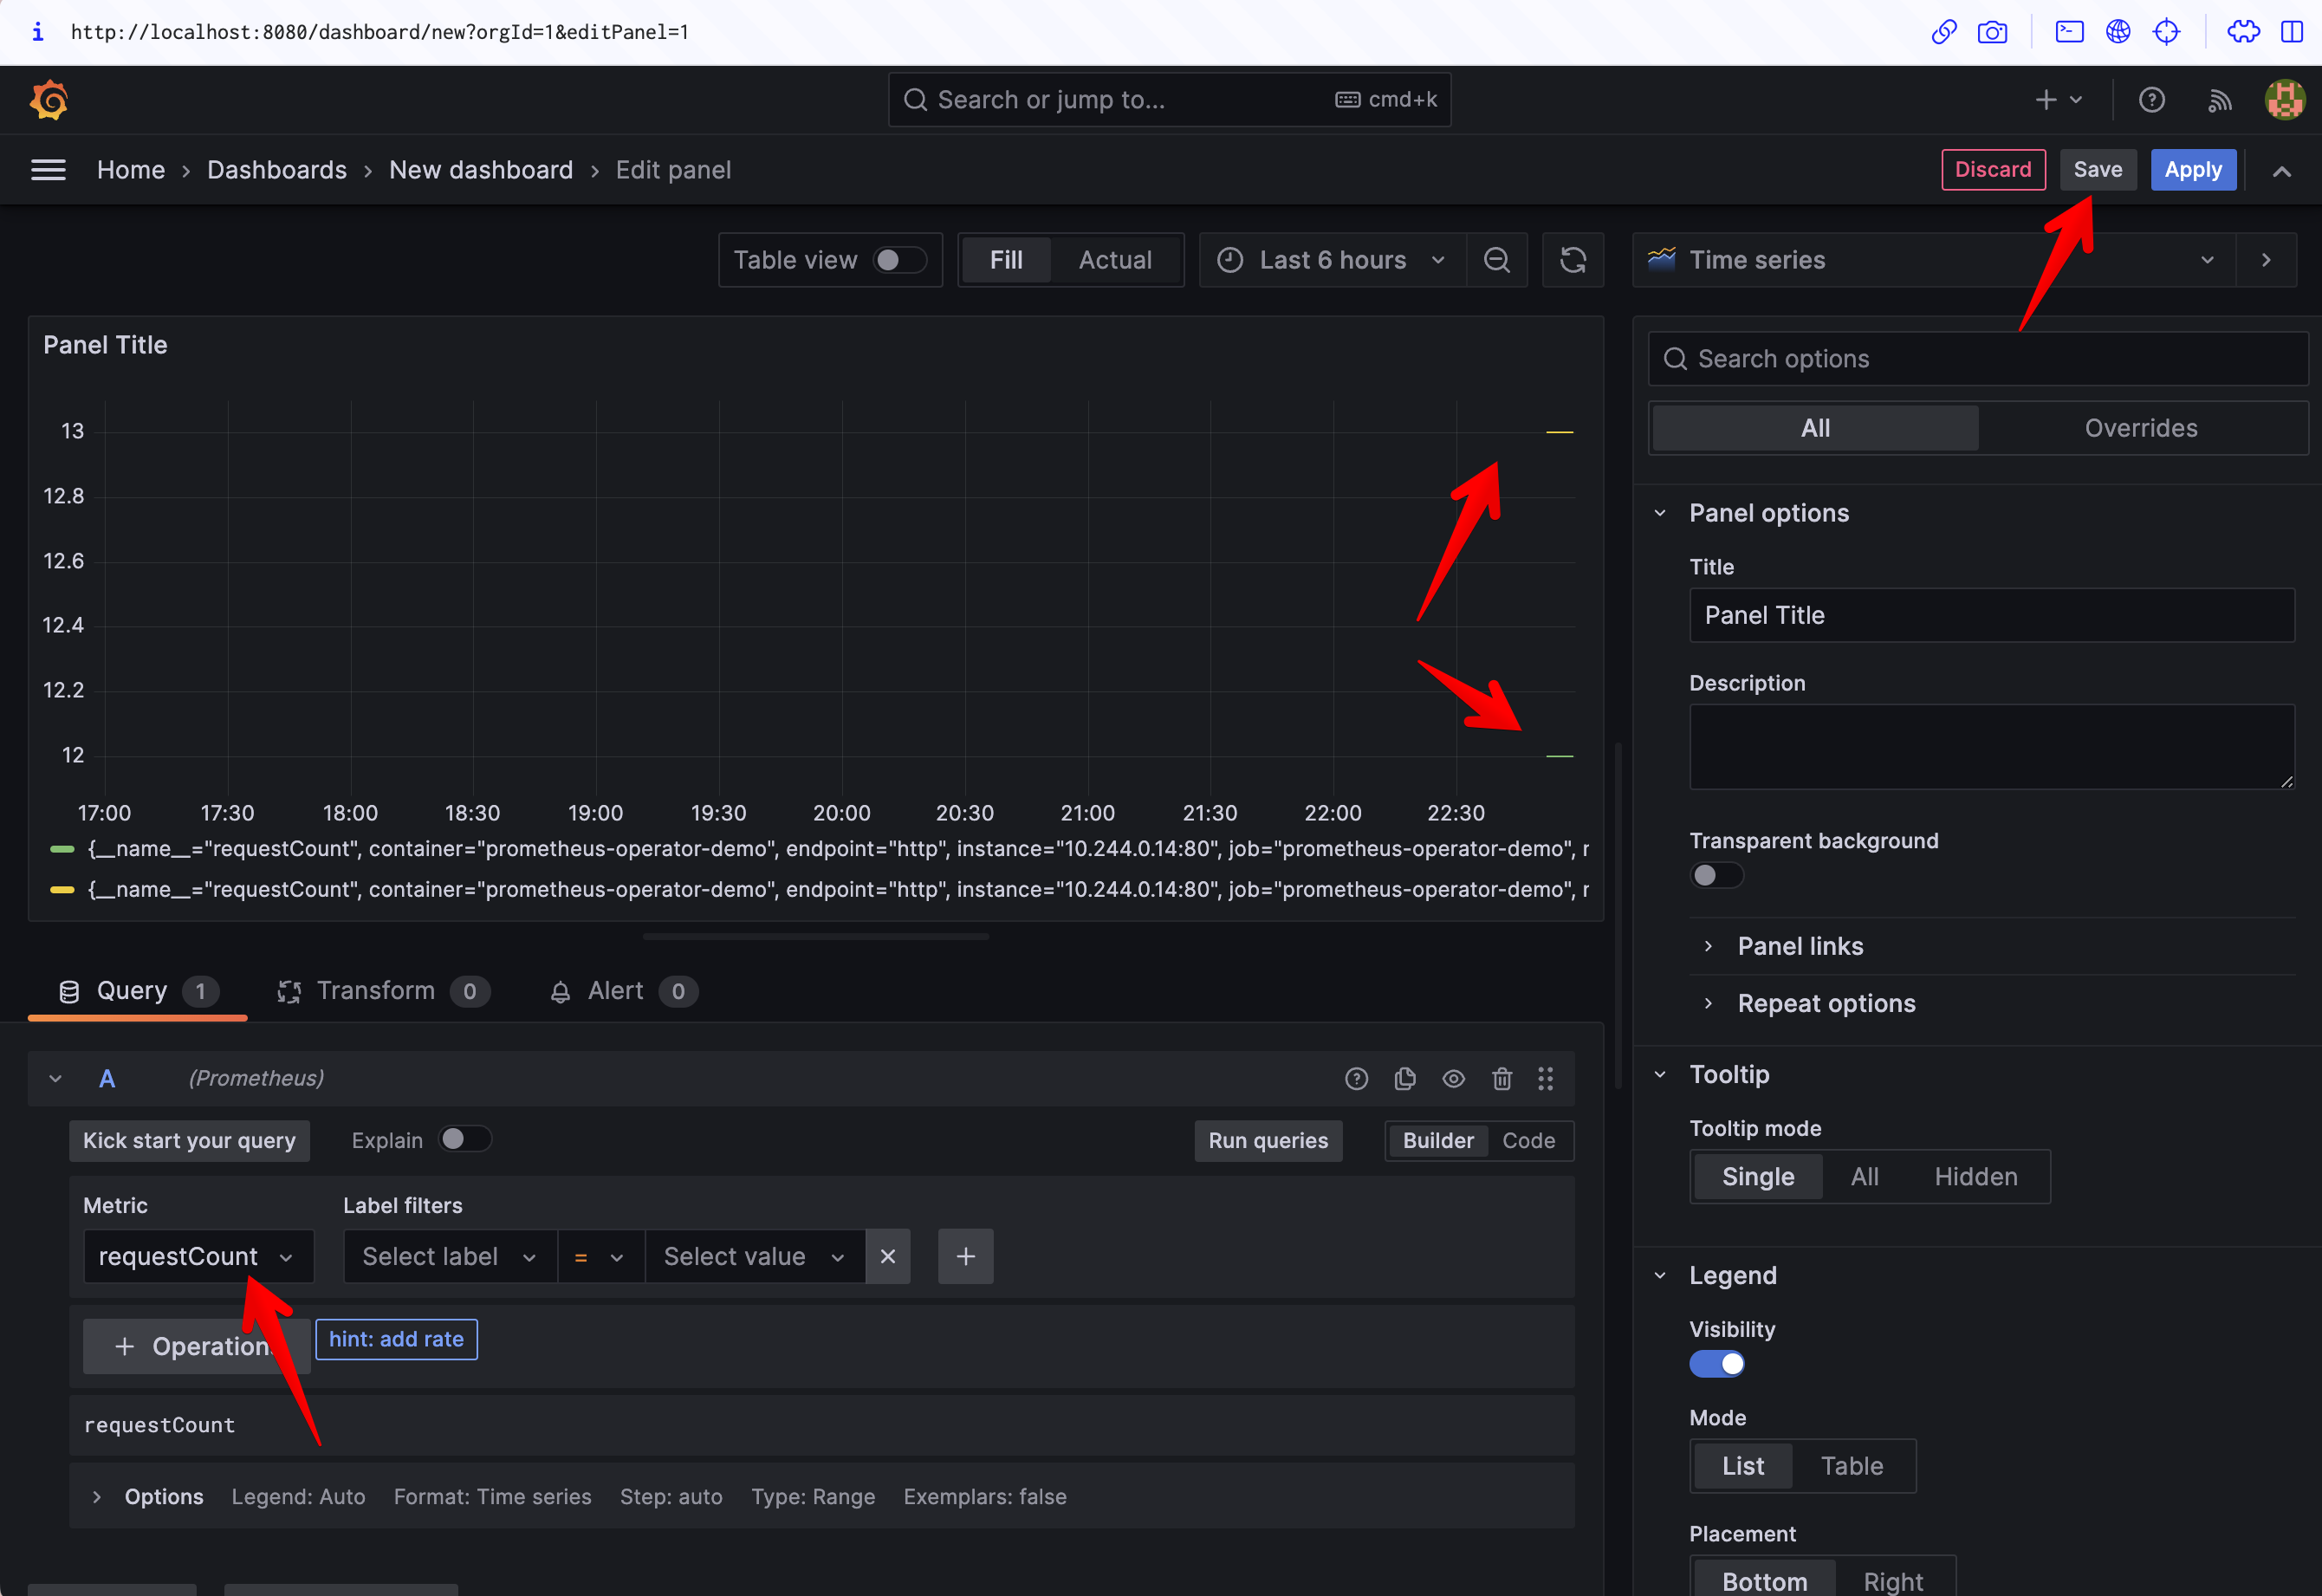
Click the blue Apply button to save your new panel. Now you have a Grafana dashboard that's presenting data scraped directly from your application, without having to manually edit any Prometheus config files!
Configuring Alertmanager
Alerts are the final major component to explore in the Prometheus operator. Prometheus allows setting alerts via alerting rules.
Alertmanager sends you notifications you of changing metrics so you can stop constantly watching your dashboards. Several different delivery mechanisms called receivers are available, including email, messaging apps, and arbitrary webhooks. For this tutorial, you'll send alerts to a Slack channel using a webhook.
Begin by creating a new Slack channel in which your alerts will be posted. prom-operator-demo is used as the channel name in the following example. Next, add the Incoming Webhooks app to your Slack workspace and select the channel you've created. The webhook URL will be displayed on the next screen; note this down, as you'll need it in the next step.
Copy the following YAML and save it to alertmanager.yaml:
---
alertmanager:
  config:
    global:
      resolve_timeout: 5m
      slack_api_url: <YOUR_SLACK_WEBHOOK_URL>
    route:
      receiver: slack
      group_wait: 5s
      group_interval: 10s
      repeat_interval: 1h
    Receivers:
      - name: "null"
      - name: slack
        slack_configs:
          - channel: "#prom-operator-demo"
            send_resolved: true
Replace <YOUR_SLACK_WEBHOOK_URL> with the URL that Slack displayed. This sets up a receiver that sends alerts to your Slack channel via the webhook you created. Alerts will wait for five seconds after they fire before they're sent (in case they're quickly resolved), while new alerts in an existing group will be held for up to ten seconds. Alerts that are still firing will be repeated in Slack every hour. The send_resolved key instructs Alertmanager to also send a message when events get resolved instead of only when they start. The extra null receiver is required due to a bug in the Helm chart that can prevent your configuration from applying.
Run the following command to merge these settings into the Alertmanager instance's active configuration:
helm upgrade --reuse-values -f alertmanager.yaml prometheus prometheus-community/kube-prometheus-stack -n prometheusIt may take a few moments after the command completes for the Alertmanager configuration to fully reload. You'll then receive Slack messages for any already firing alerts.
Sending a Test Alert
First, open a port forwarding session to your Alertmanager service. It listens on port 9093:
kubectl port-forward svc/prometheus-kube-prometheus-alertmanager 9093 -n prometheusNext, run the following command to send a dummy alert:
curl -H 'Content-Type: application/json' -d '[{"labels":{"alertname":"demo-alert","namespace":"demo","service":"Demo alert"}}]' http://127.0.0.1:9093/api/v1/alertsThe message should show up in Slack within a few seconds if you're using the Alertmanager config provided above. The demo message sets fake namespace and service values to populate Alertmanager's default Slack message template.
Role of RBAC
The Prometheus Operator leverages RBAC to enforce secure access control for Prometheus instances and related resources. By utilizing RBAC, the operator ensures that only authorized users or entities can perform specific actions on Prometheus deployments.
When using the Prometheus Operator, RBAC can be utilized to grant or restrict access to various aspects of Prometheus configuration and management. For example, administrators can define roles that grant the ability to create or modify Prometheus instances, manage alerting rules, or access Prometheus metrics.
By combining the Prometheus Operator with RBAC, organizations can ensure secure and controlled access to Prometheus monitoring capabilities within their Kubernetes clusters. RBAC provides the flexibility to assign permissions at a granular level, enabling administrators to enforce security policies effectively while allowing authorized users to perform their monitoring tasks.
Conclusion
The Prometheus Operator simplifies using Prometheus in Kubernetes clusters by automating configuration and maintenance tasks. Deploying it with the kube-prometheus-stack Helm chart lets you bring up a complete observability solution in seconds. You get Prometheus, Alertmanager, Grafana, and automatic monitoring of your cluster environment.
The extra abstraction levels introduced by operators can sometimes impede control; however, the trade-off is worth it when you're running complex third-party application stacks such as the Prometheus ecosystem.

