

Your dashboards are green and users are reporting problems. Often the cause is that traditional monitoring watches system metrics, while the problem sits in what users see or in a path nobody was watching.
There is a second gap that RUM vs synthetic monitoring guides rarely cover. Hosted synthetic checks probe from the public internet, so they cannot reach your internal APIs, databases and queues. Teams end up running a second tool for anything private.
This guide compares RUM and synthetic monitoring, then shows how to cover private endpoints with HTTP and TCP probes that run inside your network and send results next to your OpenTelemetry data.
What Is RUM (Real User Monitoring)?
Real User Monitoring (RUM) captures actual user interactions with your application. It’s like having thousands of field reporters sending back data about how your app performs in the wild.
RUM collects metrics directly from your users’ browsers or devices through JavaScript snippets embedded in your application. These snippets track page load times, clicks, network requests and JavaScript errors.
RUM measures what your users experience on their devices, networks and locations, not what you think they should be experiencing.
To learn more about Real User Monitoring (RUM) and its benefits, check out our detailed guide here: Real User Monitoring (RUM).
Essential Performance Metrics in RUM
RUM solutions collect and analyze various performance indicators from actual user sessions:
- Page load timing: Complete loading and rendering time for user interfaces
- Network request performance: Latency of API calls and third-party resource loading
- User interaction responsiveness: Response time for clicks, inputs, and navigations
- JavaScript error tracking: Exception frequency, impact, and correlation with performance
- User journey analysis: Path visualization through application features
- Geographic performance distribution: Regional variations in response times and availability
- Device and browser performance profiles: Performance segmentation across technical configurations
Strategic Advantages of RUM Implementation
- Authentic performance data: Captures actual user experiences rather than simulated interactions
- Demographic performance analysis: Segment metrics by location, device categories, and user cohorts
- Technical-business metric correlation: Links performance indicators to conversion and engagement metrics
- Edge case detection: Identifies issues affecting specific user subsets that might otherwise go unnoticed
- Behavioral insight: Reveals how users navigate and interact with applications in production environments
To understand how correlation IDs and trace IDs work together in distributed systems, check out our article on Correlation ID vs Trace ID.
What Is Synthetic Monitoring?
Synthetic monitoring works by simulating user interactions with your application. Think of it as having robot testers visiting your site 24/7, following predefined scripts, and reporting back measurements.
Unlike RUM, synthetic tests run from controlled environments with consistent network conditions, devices, and locations. That makes synthetic monitoring a good fit for baseline performance tracking and proactive issue detection.
One detail decides most of what a synthetic check can do: where the probe runs. A probe sees your service the way its network position sees it. A probe in a vendor’s cloud reaches whatever is public. A probe inside your VPC reaches whatever the VPC can route to, but says nothing about whether users in another region can connect.
Common Synthetic Monitoring Methodologies
- Availability verification: Basic endpoint checks confirming system responsiveness
- Transaction path validation: Scripted workflows testing multi-step user journeys
- API performance evaluation: Direct backend service testing without browser rendering
- Frontend rendering assessment: Full browser tests measuring visual and interactive components
- Performance benchmarking: Comparative testing against historical baselines or competitor systems
To learn more about how synthetic monitoring works and its use cases, check out our guide on What is Synthetic Monitoring?.
Benefits of Synthetic Monitoring
- Proactive detection: Catches issues before users do
- Consistent baselines: Stable environments enable reliable trend analysis
- Pre-production testing: Test performance before deploying to production
- Competitor benchmarking: Compare your site against others
- SLA verification: Objectively measure against service level agreements
- 24/7 coverage: Monitor during low-traffic periods when real user data is sparse
RUM vs Synthetic Monitoring: Head-to-Head Comparison
| Feature | RUM | Synthetic Monitoring |
|---|---|---|
| Data source | Actual user interactions | Scripted test scenarios |
| Issue detection | Reactive (after users experience it) | Proactive (before users notice) |
| Coverage | Only active user paths | Any path you script |
| Reach | Wherever your users are | Wherever the probe can route to: public only for hosted checks |
| Protocols | Browser and app traffic | Depends on the tool: HTTPS only for Last9 hosted checks, HTTP and TCP with Collector receivers |
| Environment variables | Wide variety (uncontrolled) | Limited (controlled) |
| Cost scaling | Based on traffic volume | Based on test frequency |
| Setup complexity | Simple script injection | Requires test script creation |
| Low-traffic insight | Poor (limited data) | Excellent (consistent data) |
| Real-world accuracy | High (actual conditions) | Medium (simulated conditions) |
The two rows that matter for private systems are the new ones. RUM only sees what users reach through a browser or app. A hosted synthetic check only sees what the public internet can reach. The next section covers everything in between.
How to Cover Private Endpoints and TCP/HTTP Probes
Internal APIs, databases, message brokers and admin services sit behind a VPC, a firewall or a service mesh. A hosted probe cannot route to them, and users never touch them directly, so RUM does not see them either. When one of them fails, you find out through the services that depend on it.
The fix is to move the probe. Run it inside the network, where it can route to the target, and ship its results to the same backend as everything else.
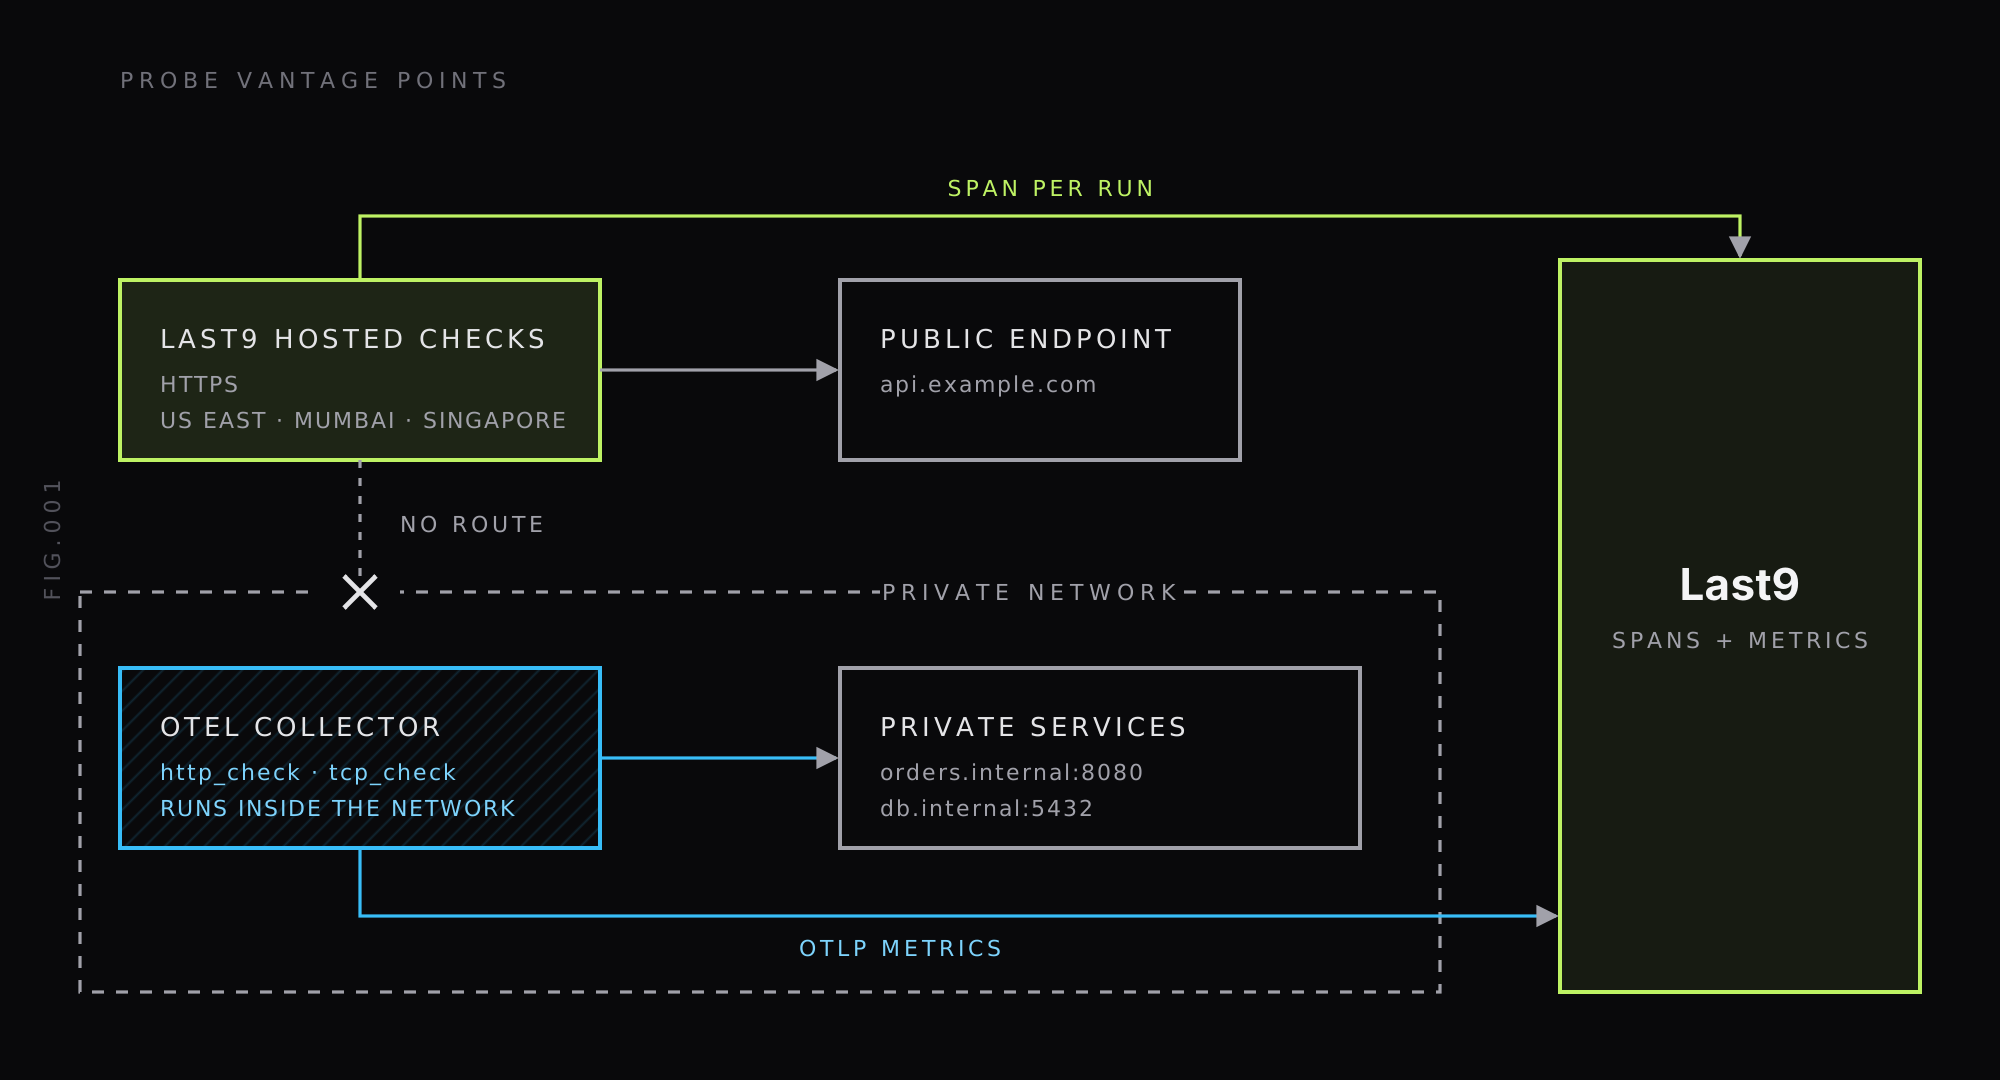
The OpenTelemetry Collector has two receivers for this. The http_check receiver makes a request to each HTTP endpoint and reports status and timing. The tcp_check receiver opens a connection to each host:port target and reports whether it connected. Both are in the contrib distribution and both carry alpha stability for metrics, so pin a version and read the changelog before upgrading. Their default interval is 60 seconds.
A Collector config for private HTTP and TCP checks
This config probes one internal HTTP health endpoint and two TCP targets, then exports to Last9 over OTLP:
receivers:  http_check:    collection_interval: 30s    targets:      - method: GET        endpoint: http://orders.internal:8080/health        validations:          - contains: "ok"          - json_path: "status"            equals: "ok"    metrics:      httpcheck.duration:        enabled: true      httpcheck.dns.lookup.duration:        enabled: true      httpcheck.client.connection.duration:        enabled: true      httpcheck.tls.handshake.duration:        enabled: true      httpcheck.client.request.duration:        enabled: true      httpcheck.response.duration:        enabled: true      httpcheck.validation.passed:        enabled: true      httpcheck.validation.failed:        enabled: true  tcp_check:    collection_interval: 30s    targets:      - endpoint: db.internal:5432        dialer:          timeout: 5s      - endpoint: queue.internal:5672        dialer:          timeout: 5s
processors:  batch:    timeout: 5s
exporters:  otlp_http/last9:    endpoint: "${env:LAST9_OTLP_ENDPOINT}"    headers:      Authorization: "${env:LAST9_OTLP_AUTH}"
service:  pipelines:    metrics:      receivers: [http_check, tcp_check]      processors: [batch]      exporters: [otlp_http/last9]
Copy LAST9_OTLP_ENDPOINT and the full LAST9_OTLP_AUTH value from your Last9 integration setup. The header must use the Basic scheme, for example Basic <base64-credentials>. The Collector setup docs note that Last9 rejects a Bearer value.
Two details in this config trip people up:
json_pathtakes a bare path.json_path: "status"matched a response of{"status":"ok"}when we ran it."$.status"did not.- Timing and validation metrics are off by default. The timing breakdown,
httpcheck.validation.passedandhttpcheck.validation.failedonly appear once you enable them undermetrics:.
For HTTPS targets you can also enable httpcheck.tls.cert_remaining, which reports the time left before the certificate expires. The README marks it disabled by default.
What we ran, and what we did not
We ran this pipeline on OpenTelemetry Collector contrib v0.164.0 against a local HTTP service, a local TCP listener, and a closed port. The OTLP destination was a local stub, not Last9: it received POST /v1/metrics requests carrying the Basic Authorization header we configured. We did not send this data to a Last9 workspace, so check the first batch in your own account.
These are the metrics the Collector emitted. The first group is HTTP, the second is TCP:
| Metric | What it tells you |
|---|---|
httpcheck.status | 1 for the status class that matched, 0 for the others, with http.status_class and http.status_code attributes |
httpcheck.duration | Total check duration |
httpcheck.dns.lookup.duration, httpcheck.client.connection.duration, httpcheck.tls.handshake.duration, httpcheck.client.request.duration, httpcheck.response.duration | Timing by phase |
httpcheck.validation.passed | Whether each validation matched, with a validation.type attribute such as contains or json_path |
tcpcheck.status | 1 if the connection succeeded, 0 if not, per tcpcheck.endpoint |
tcpcheck.duration | Time to connect |
tcpcheck.error | Count of failures, with an error.code such as connection_refused |
tcpcheck.error showed up only after the closed port failed, and tcpcheck.status went to 0 for that endpoint. Alert on tcpcheck.status for outages and use tcpcheck.error to see why. Check how the names appear in your Last9 workspace before you write alert rules, since the backend may normalize dots in metric names.
Hosted Checks vs In-Network Probes: Synthetic Monitoring Tools Compared
Synthetic monitoring tools split into two groups: probes someone else hosts, and probes you run. Here is how the options in this post compare:
| Last9 hosted checks | OTel http_check and tcp_check | Prometheus Blackbox Exporter | |
|---|---|---|---|
| Runs from | US East (N. Virginia), Asia Pacific (Mumbai), Asia Pacific (Singapore) | Wherever you run the Collector | Wherever you run the exporter |
| Reaches | Public internet only | Anything the Collector can route to | Anything the exporter can route to |
| Protocols | HTTPS (the only check type in the docs) | HTTP and TCP | HTTP, HTTPS, DNS, TCP, ICMP and gRPC |
| Output | An OpenTelemetry trace span per run | OTLP metrics | Prometheus metrics (probe_success and others) |
| You operate | Nothing | The Collector | The exporter and Prometheus scrape config |
| Alerting | One-click alert on synthetic_probe_up == 0 | Alert rules on httpcheck.* and tcpcheck.* | Alert rules on probe_* |
Last9’s Synthetic Monitoring docs list HTTPS as the only check type today and require the target to be reachable from the public internet from the probe locations you pick. Whether hosted checks will cover TCP or private locations is not documented, so plan private coverage with an in-network probe.
If you already run Prometheus, the Blackbox Exporter is a good fit and covers more protocols than the two Collector receivers. Our Blackbox Exporter guide walks through modules, scrape config and alerts. If you already run an OpenTelemetry Collector, the receivers above avoid adding another component.
An in-network probe has the same limit as any single vantage point. It can report success while users in another region cannot connect. Pair it with hosted checks for the public path and RUM for what users see. For the TCP side in more detail, see TCP monitoring.
When to Use RUM
RUM shines in specific scenarios that synthetic monitoring can’t match:
Measuring Actual User Experience
When your primary goal is understanding exactly what users experience, RUM is the right tool. It captures the full diversity of your user base, including different devices, network conditions, and geographic locations.
Analyzing Performance Impact on Business Metrics
RUM allows you to correlate technical performance with business outcomes. If slower page loads affect conversion rates, RUM can show it. If certain errors cause users to abandon carts, RUM can show that too.
Understanding Geographic and Device-Specific Issues
Some problems only affect users in specific regions or on particular devices. RUM helps you identify these segment-specific issues that synthetic tests might miss. For example, you might discover your app performs poorly on older Android devices in regions with slower mobile networks.
Capturing the Long Tail of Performance Problems
The 95th percentile performance often matters more than averages. RUM catches the slowest 5% of experiences, which can cause the most user frustration and get lost in aggregate metrics.
For a deeper look into the importance of metrics monitoring, check out our post on Metrics Monitoring.
When to Use Synthetic Monitoring
Synthetic monitoring excels in scenarios where RUM falls short:
Proactive Problem Detection
The biggest advantage of synthetic monitoring is catching issues before users do. Scheduled tests can alert you to problems during deployment or third-party service failures before they reach your actual users.
Monitoring Critical Paths 24/7
Some user journeys are too important to wait for real users to hit a problem. Synthetic monitoring lets you continuously test checkout flows, login processes, and other key paths regardless of actual traffic patterns.
Pre-Production Performance Testing
Before deploying changes, synthetic tests give you performance data without requiring real user traffic. This helps catch regressions before they hit production.
Competitor Benchmarking
To see how your site performs compared to competitors, synthetic tests can run the same scenarios across multiple sites. RUM cannot do this, because it only sees your own users.
Consistent Baseline Metrics
Because synthetic tests run in controlled environments, they provide stable baselines for tracking performance over time without the variability inherent in real user data.
Why You Probably Need Both
Most mature observability strategies combine both approaches because each covers the other’s blind spots.
The Complete Visibility Approach
RUM tells you what’s happening with real users, while synthetic monitoring helps you understand why and catch issues proactively. Together, they create a feedback loop that strengthens your overall monitoring strategy.
Consider this scenario: your synthetic tests show consistent performance, but RUM reveals slowdowns for users in a specific region. You add synthetic tests from that region, and they identify a CDN issue that was invisible from your original test locations.
Filling Each Other’s Blind Spots
- RUM can’t tell you about problems during low-traffic periods
- Synthetic can’t capture the diversity of real-world conditions
- RUM doesn’t test rarely-used features
- Synthetic doesn’t show unexpected user behaviors
- Neither sees internal services unless a probe runs inside the network
To better understand traces and spans in observability, check out our guide on Traces & Spans: Observability Basics.
Creating a Monitoring Strategy Using Both
- Use synthetic for baselines: Establish consistent performance benchmarks
- Use RUM for validation: Verify that real users experience what your synthetic tests predict
- Let RUM guide synthetic: When RUM shows problems, create synthetic tests to reproduce and monitor them
- Use synthetic for alerting: Set up proactive alerts based on synthetic tests
- Use RUM for impact assessment: Evaluate how many users are affected by the identified issues
- Probe from inside for private services: Put an in-network probe on the dependencies users never touch directly
Setting Up Effective RUM Monitoring
Choosing the Right Metrics
Focus on the metrics that matter to your users:
- Core Web Vitals: Track LCP (Largest Contentful Paint), INP (Interaction to Next Paint) and CLS (Cumulative Layout Shift). INP replaced FID as a Core Web Vital in March 2024; see web.dev on INP.
- Custom Timings: Monitor app-specific interactions that impact user experience.
- Error Rates: Track JavaScript exceptions by page or feature to understand where issues are affecting users.
- Resource Timing: Identify slow third-party resources that could affect page load times.
Implementation Best Practices
- Sample high-traffic applications to control data volume without losing insight.
- Set up proper user segmentation (device type, location, etc.) to understand performance across different user groups.
- Track custom business metrics alongside technical ones to align performance with business goals.
- Establish clear performance budgets based on RUM data to ensure consistency.
- Integrate RUM data into your CI/CD pipeline for performance regression testing, so issues are caught early.
How to Create Effective Synthetic Tests
A synthetic check is only as useful as its assertions. A check that passes on any 200 will pass while the page shows an error message.
Critical Paths to Test
- Login Flows: Ensure users can access their accounts.
- Search Functionality: Test whether searches return results quickly and accurately.
- Checkout Process: Verify users can complete purchases without issues.
- API Health: Make sure backend services are responding properly.
- Core User Journeys: Test primary tasks that users perform regularly.
Assertions Worth Adding
Pin each check to more than a status code:
- Status code: Last9’s default assertion is
Status Code equals 200. Change it if your endpoint returns204or301. - Body content: With the Collector, a
containsorjson_pathvalidation catches an endpoint that returns200with a broken payload. - Latency: Combine the status check with a response time limit so slow responses count as failures.
- Certificate expiry: Alert before a TLS certificate lapses. The Collector’s optional
httpcheck.tls.cert_remainingmetric covers this for HTTPS targets.
Test Frequency and Location Strategy
Frequency is a trade-off between detection time and cost, because more frequent checks from more locations cost more to run and store.
- Run basic availability checks every 1 to 5 minutes. A 5-minute check cannot detect a 1-minute outage, so tighten critical endpoints to every minute.
- Schedule complex transaction tests less often, such as every 15 to 30 minutes.
- Test from at least two locations for a public endpoint. A failure from one region with success from another points to a network issue, not an outage.
- Match locations to your user base, and include mobile networks if your traffic is mobile-heavy.
- Vary test timing to uncover time-of-day performance issues.
Advanced Observability: Beyond Basic Monitoring
RUM and synthetic data answer “is it slow or down?”. The next question is “why?”, and that needs the check result to sit next to your traces.
Every Hosted Check Run Is a Trace Span
Last9 records every hosted synthetic check run as an OpenTelemetry trace span. A failing probe links to a full trace with DNS, TCP, TLS, TTFB and download timings, so you do not switch tools to find out why a check failed. The span carries attributes you can filter on:
| Attribute | What it holds |
|---|---|
l9.synthetic.check_id | The check’s unique ID |
deployment.environment | The probe region, such as ap-south-1 |
http.status_code | The HTTP status returned |
http.dns_time_ms, http.connect_time_ms, http.tls_time_ms, http.ttfb_ms, http.download_time_ms | Time per phase, in milliseconds |
Filter spans where l9.synthetic.check_id equals a check’s ID to list every run of that check. The same filter works in dashboards and alert rules. Synthetic spans carry kind=Client and type=SYNTHETIC, so they stay separate from application spans in mixed views. Details are in the Synthetic Monitoring docs.
For alerting, Last9’s one-click alert fires when synthetic_probe_up == 0 for several failed runs in a window. The number of runs and the window scale with check frequency: a 1-minute check fires after 3 failed runs within 3 minutes, and a 5-minute check after 3 failed runs within 15 minutes.
The Collector receivers above emit metrics, not spans, so for private endpoints you get status and timing series but not a trace per check.
Putting RUM, Synthetic and Backend Telemetry Together
Last9’s real user monitoring sends frontend sessions, errors, and performance signals through the same OpenTelemetry pipeline as your backend telemetry, and the RUM docs cover the web SDK. With RUM, hosted checks and Collector probes all landing in one place, a regional slowdown can be followed from the user session to the failing probe to the backend trace, without joining data across tools.
Choosing Where to Probe From
RUM shows what real users experience. Hosted synthetic checks tell you whether public endpoints work right now. In-network probes cover the private services neither of those can see.
Pick the probe location first, since it decides what a check can reach. Then add assertions that fail on wrong content, not only on a bad status code.
And if you’d like to discuss further, our Discord community is available. We have a dedicated channel where you can connect with other developers and share your specific use case.
FAQs
Is RUM or synthetic monitoring better for my organization?
Neither is better on its own, because they answer different questions. RUM shows what real users experience across devices, networks and regions. Synthetic monitoring tells you whether a path works right now, including when no users are online. Start with synthetic checks on your most critical endpoints, add RUM for user experience, and keep both once traffic grows.
Can synthetic monitoring check private or internal endpoints?
Only if the probe runs somewhere that can route to the endpoint. Last9 hosted checks run from US East, Mumbai and Singapore, and the docs require the target to be reachable from the public internet. For internal services, run a probe inside the network, such as the OpenTelemetry Collector’s http_check and tcp_check receivers or the Prometheus Blackbox Exporter, and send the results to your backend.
How do I run TCP and HTTP probes inside a private network?
Run an OpenTelemetry Collector inside the network with the http_check receiver for HTTP endpoints and the tcp_check receiver for host:port targets. Add a pipeline that exports to Last9 over OTLP with a Basic Authorization header. Each check emits metrics such as httpcheck.status and tcpcheck.status that you can alert on.
Can synthetic monitoring replace real user monitoring?
No. Synthetic checks run scripted requests from fixed locations, so they cannot show the variety of devices, networks and user behavior that RUM captures. They also miss problems on paths nobody scripted. Use synthetic checks for proactive detection and RUM to confirm what users see.
How do I know if my synthetic tests are realistic?
Compare synthetic results with RUM data for the same page, region and time window. A large, persistent gap means the test is not exercising what users do, or runs from a location your users do not use. Add checks from the region where RUM shows slowdowns and tighten the assertions on the paths that matter.
How often should I run synthetic tests?
Match the frequency to how fast you need to know. A 5-minute check cannot detect a 1-minute outage, so critical endpoints warrant checks every minute, while lower-priority paths can run every 5 to 15 minutes. Last9’s one-click alert scales its failed-run count and window with check frequency: per the docs, a 1-minute check fires after 3 failed runs within 3 minutes, and a 5-minute check after 3 failed runs within 15 minutes.
Does RUM affect my site’s performance?
A RUM script adds some work in the browser, and the amount depends on the SDK and how you configure it. We have no measured overhead figure to quote. Load the script asynchronously, batch the reporting, and compare your own page timings with and without it before rolling out.


