

Cloud providers like AWS (Amazon Web Services), Azure, and Google Cloud (GCP) have pushed the boundaries of what is possible to do on the internet using flexible elastic compute and storage architectures.
As all new software is deployed on the cloud for faster release cycles and time-to-market advantages, it becomes critical to monitor its performance, health, and reliability.
However, with the increasing number of cloud monitoring tools, it can be hard to decide. The right monitoring tool can provide a critical edge to your business through operational intelligence.
Let’s look at the tools as of 2024 and see how they stack up against one another.
What Is Cloud Monitoring?
Cloud monitoring is the process of observing and tracking the performance, availability, and overall health of cloud-based IT infrastructures.
It involves using specialized tools to collect and analyze data from various cloud services and environments, ensuring optimal performance and identifying potential issues before they impact business operations.
How Cloud Monitoring Works
It’s important to understand the composable parts of a cloud monitoring system. Here are some key parts of this setup, that are also detailed in the architecture of a monitoring system.
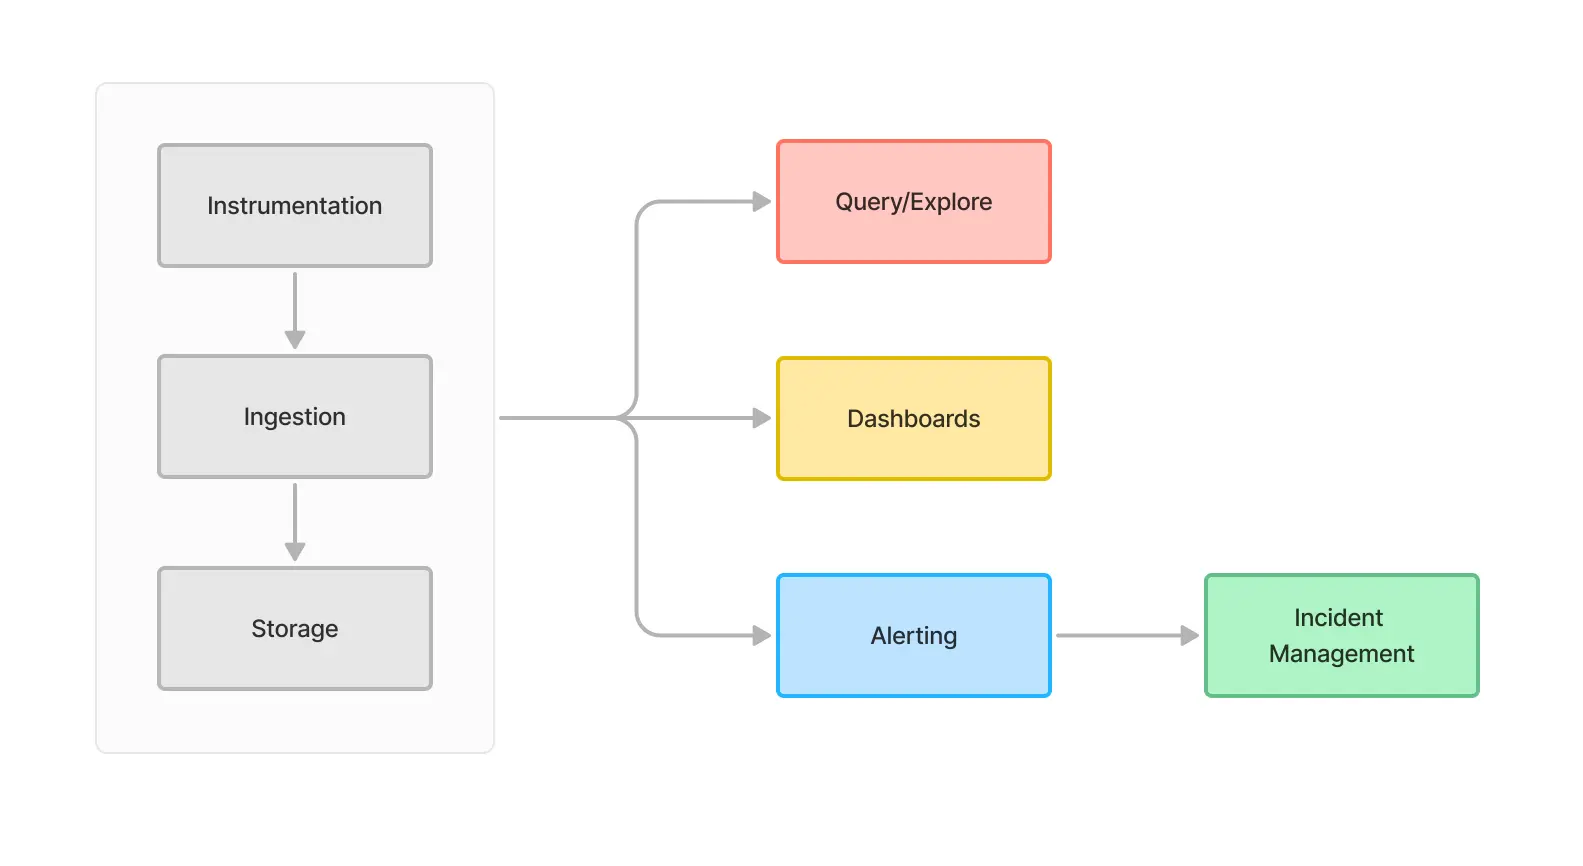
Cloud monitoring operates through continuous data collection and analysis:
- Data Collection / Instrumentation: Monitoring tools gather metrics from cloud resources, applications, services, networks, Kubernetes, and virtual machines. It's ideal to use open telemetry integrations instead of vendor lock-in agents.
- Data Processing / Ingestion: Collected data is analyzed to extract insights and identify patterns or anomalies.
- Storage: Collected data is optimized for storage and kept in active memory of long-term storage based on retention parameters
- Visualization: Processed data is presented in dashboards for easy interpretation
- Alerting: The system triggers real time alerts based on predefined thresholds, pattern detection, and system & configuration changes.
- Automation: Many solutions incorporate automated responses to common issues through playbooks and scripting.
Several other tools also plug into observability data to provide additional applications around incident management.
Monitoring & Debugging (Troubleshooting)
For all the telemetry data that is collected, there are primarily 2 use cases that decide how important certain features are.
A radar that helps effectively look at all signals (metrics & events) in real-time to know if an incident can be avoided. A black box (troubleshooting through logs and traces) system to do root cause analysis and find unknown unknowns.
Cost-Effective Monitoring Tools Engineering Teams Should Try
Last9
Features
Last9 offers real-time monitoring and alerting capabilities. It specializes in high-cardinality and high-dimensionality data, allowing teams to slice and dice their telemetry data in numerous ways.
It provides custom dashboards and visualizations, enabling users to create tailored views of their data. The platform includes integrated log management and traces making it easier to correlate metrics with log and trace data.
It employs change intelligence and anomaly detection for automatic correlations helping teams identify unusual patterns quickly and reduce MTTD.
Pros
- Control plane that allows you to optimize your data ingestion without having to re-instrument
- Developer-friendly comprehensive API and integration options
- Simple cost optimization features and workflows
- Excellent support and solutions team to help adopt
Cons
- SIEM and RUM (Real User Monitoring) for end users are in alpha
Pricing
- Free tier available for small teams
- A pay-per-use model with tiered pricing based on data ingestion
- Custom enterprise plans available
Key Aspects
- High Cardinality but yet a cost-effective solution with a focus on modern cloud practices
- Anomaly detection and change intelligence for proactive issue identification
AWS Cloudwatch
AWS CloudWatch is your go-to monitoring solution for the AWS cloud platform. It’s designed to give you detailed insights into your AWS resources and applications. Because it’s deeply integrated with AWS services, CloudWatch feels like a natural extension of your AWS environment, offering monitoring capabilities that are truly built for AWS.
It collects and tracks metrics, offering insights into resource utilization and application performance across both cloud and data center environments. CloudWatch includes log analytics features, allowing users to search, filter, and analyze log data.
The service supports setting up alarms and automated actions based on predefined thresholds. Users can create custom dashboards to visualize their metrics and logs in a way that suits their needs.
Pros
- Deep integration with the AWS ecosystem
- No additional setup is required for basic AWS resource monitoring
- Scalable to handle large volumes of data
Cons
- Complex to set up for non-AWS resources
- Pricing can become expensive at scale, for each read/write/alert/dashboard
- Very limited customization options compared to specialized tools
Pricing
- Needs an extensive calculator to really figure out what will it cost
- Pay-as-you-go model based on metrics, alarms, and data ingestion
- Some features included free with AWS accounts
- Additional costs for advanced features and data retention
Key Aspects
- Native AWS integration makes it ideal for AWS-centric infrastructures
- Scalability to handle monitoring needs from small to enterprise-level deployments
Azure Monitor
Azure Monitor is Microsoft's all-in-one solution for gathering, analyzing, and responding to telemetry data from both Azure and on-premises environments. It offers extensive monitoring for Azure resources, ensuring you have full visibility over everything from your applications to your containers.
It includes Application Insights for detailed application performance monitoring, helping developers understand how their apps are being used and performing. The Log Analytics feature enables deep analysis of log data from various sources.
Azure Monitor, part of Microsoft Azure supports alerting and automated actions, allowing teams to respond quickly to issues. It also integrates with Azure Security Center, enhancing the overall security posture of Azure-based systems.
Pros
- Seamless integration with Azure services
- Powerful query language (Kusto) for log analysis
- Good balance of features for both operations and development teams
Cons
- Primarily focused on Azure, may require additional setup for other clouds
- Can be overwhelming for users new to the Azure ecosystem
- Requires familiarity with a proprietary query language
- Some advanced features require separate licensing
Pricing
- Pay-as-you-go model based on data ingestion and retention
- Some basic monitoring included free with Azure subscriptions
- Tiered pricing for more advanced features and longer data retention
Key Aspects
- Comprehensive solution for Azure-based infrastructures with powerful analytics capabilities
- Kusto Query Language provides flexible and powerful log analysis options
Google Cloud's Operations Suite (formerly Stackdriver)
Google Cloud's Operations Suite (formerly Stackdriver) is an integrated monitoring, logging, and diagnostics suite for applications on GCP, providing a central platform for all critical data. It includes robust error reporting and debugging tools to help developers quickly identify and resolve issues.
The suite provides uptime monitoring and alerting, ensuring that teams are notified of any service disruptions. A standout feature is its support for Service Level Objective (SLO) monitoring, allowing teams to track and maintain service quality targets.
Pros
- Strong integration with Google Cloud services
- Good support for Kubernetes monitoring
- Easy to use for teams already familiar with Google Cloud
Cons
- Limited support for non-Google Cloud environments
- May require additional configuration for complex multi-cloud setups
- Some users report the interface can be unintuitive
Pricing
- Free tier available with limited features
- Pay-as-you-go pricing based on monitored resources and data ingestion
- Volume discounts available for larger deployments
Key Aspects
- Good Kubernetes monitoring capabilities make it ideal for container-based architectures
- SLO monitoring features support reliability engineering practices
New Relic
Offers full-stack observability with a focus on application performance monitoring.
New Relic offers a comprehensive observability platform that provides full-stack visibility into applications, infrastructure, and user experiences. It employs real-time analytics to give instant insights into system performance and user behavior. The platform includes AI-powered anomaly detection, helping teams identify and respond to issues quickly.
New Relic enables users to create custom dashboards and set up alerts based on various metrics and conditions. It integrates application performance monitoring (APM), infrastructure monitoring, and digital experience monitoring into a single platform, streamlining management tools for enhanced efficiency.
Pros
- Comprehensive full-stack observability
- Strong APM capabilities
- User-friendly interface with customizable dashboards
Cons
- Can be expensive for large-scale deployments
- Some users report a steep learning curve
- Data retention policies may be limiting for some use cases
Pricing
- Offers a free tier with basic features
- Pay-as-you-go pricing based on data ingestion and user count (can get expensive)
- Volume discounts available for larger deployments
Key Aspects
- All-in-one observability platform with a strong APM focus
- AI-driven insights for faster problem resolution
DataDog
A platform for monitoring servers, databases, tools, and services through a SaaS-based platform. DataDog is a monitoring and analytics platform designed for modern, cloud applications. It offers infrastructure monitoring, application performance monitoring, log management, network monitoring, and user experience monitoring.
The platform provides dashboards with customizable widgets and visualizations. DataDog's machine learning algorithms help detect anomalies and forecast trends. It supports a wide range of integrations, allowing teams to consolidate monitoring data from various sources.
It also includes features for continuous profiling and network performance monitoring, making it a comprehensive monitoring service for modern IT environments.
Pros
- Extensive integration ecosystem
- Powerful correlation between metrics, traces, and logs
- Strong support for containerized and microservices architectures
- User-friendly UI with customizable dashboards
Cons
- Can become expensive, really fast
- Some users report that the wealth of features can be overwhelming
- Configuration for complex environments can be challenging
Pricing
- Free plan available with limited features
- Various paid plans based on hosts, custom metrics, and features
- Enterprise pricing available for large-scale deployments
Key Aspects
- Comprehensive monitoring solution with a vast integration ecosystem
- Strong support for modern, distributed application architectures
Grafana (Open Source)
Grafana is an open-source analytics and interactive visualization web application, often used in combination with various data sources. It allows users to create highly customizable dashboards, providing flexible ways to visualize metrics and logs.
Grafana offers a robust alerting system, enabling teams to set up notifications based on complex conditions. The platform's plugin ecosystem extends its functionality, allowing integration with various data sources and adding new visualization options.
Pros
- Highly flexible and customizable
- Large community and extensive documentation
- Can be self-hosted or used as a managed service
Cons
- Requires separate data sources for metrics logs and traces
- Can be complex to set up and maintain for large deployments
- Limited built-in alerting capabilities
Pricing
- Open-source version is free
- Grafana Cloud offers a free tier and paid plans based on active series and users
- Enterprise on-premise licenses available for large organizations
Key Aspects
- Unparalleled flexibility in data visualization and dashboard creation
- Strong open-source community support and continuous improvements
Sumologic
Sumologic is a cloud-native machine data analytics platform that provides log management, metrics monitoring, and security analytics. It offers powerful search and analytics capabilities for log data, allowing teams to quickly investigate issues.
The platform includes real-time dashboards and visualizations for monitoring system health and performance. Sumologic's machine learning features help detect anomalies and predict potential issues. It also provides threat intelligence and security analytics capabilities, making it useful for both IT operations and cloud operations management.
Pros
- Strong log analytics capabilities
- Machine learning-powered insights
- Good security analytics features
Cons
- Can be expensive for high data volumes
- Some users report a steep learning curve for advanced features
- Query language may take time to master
Pricing
- Free tier available with limited features
- Paid plans based on data ingestion volume and retention
- Custom enterprise pricing for large-scale deployments
Key Aspects
- Powerful log analytics with machine learning-driven insights
- Combines IT operations and security analytics in one platform
Uptrace
Uptrace is an open-source APM system designed for monitoring distributed traces and metrics. It offers end-to-end distributed tracing, allowing developers to track requests across multiple services.
The platform provides detailed performance breakdowns, helping identify bottlenecks in complex systems. Uptrace includes features for alerting and anomaly detection based on trace data. It supports OpenTelemetry, making it easy to integrate with existing observability setups.
Pros
- Open-source with a permissive license
- Strong focus on distributed tracing
- OpenTelemetry support
Cons
- Smaller feature set compared to some commercial alternatives
- Limited built-in integrations
- Smaller community and ecosystem compared to other open source, established tools
Pricing
- Open-source version is free
- Managed cloud offering with usage-based pricing
- Support and consulting services available
Key Aspects
- Specialized in distributed tracing for complex, microservices-based applications
- Open-source nature allows for customization and community contributions
Victoria Metrics
Victoria Metrics is a high-performance time-series database and monitoring solution designed for efficiency and scalability. It offers full Prometheus compatibility, making it easy for teams familiar with Prometheus to adopt.
The platform supports multi-tenancy, allowing different teams or projects to use the same instance while maintaining data isolation. Victoria Metrics excels at long-term data storage and querying, enabling teams to analyze historical trends effectively.
Pros
- Excellent performance and resource efficiency
- Easy migration path for Prometheus users
- Supports both pull and push models for data ingestion
Cons
- Smaller community compared to some alternatives
- May require additional tools for complete observability stack
- Logging product is new and no support for traces
Pricing
- Open-source version available for free
- Enterprise version with additional features and support
- Cloud-managed option with usage-based pricing
Key Aspects
- High-performance time-series database optimized for efficient resource usage
- Prometheus compatibility facilitates easy adoption for teams already using Prometheus
AppDynamics
AppDynamics, now part of Cisco, offers application performance monitoring with a focus on business impact. It provides end-to-end transaction tracing across distributed systems, helping teams understand the flow of requests through their applications.
The platform offers automatic discovery and mapping of application topology. AppDynamics includes features for user experience monitoring, database monitoring, and infrastructure visibility. It also provides business performance monitoring, linking IT metrics to business outcomes.
Pros
- Deep visibility into application performance and business impact
- Strong transaction tracing capabilities
- Automatic discovery and mapping of application dependencies
- Integration with Cisco's networking tools
Cons
- Can be expensive, especially for large deployments
- Some users report complexity in setup and configuration
- May be overkill for smaller applications or teams
Pricing
- Pricing based on the number of agents and modules used
- Perpetual license and subscription models are available
- Custom pricing for enterprise deployments
Key Aspects
- Strong focus on linking IT performance to business outcomes
- Deep application performance insights with automatic topology mapping
Middleware
Middleware is a newer entrant in the observability space, focusing on API observability and microservices monitoring. It offers real-time API metrics, allowing teams to monitor the performance and usage of their APIs.
The platform provides features for automatic API discovery and documentation. Middleware includes tools for API testing and validation, helping ensure API reliability. It also offers features for API governance and security monitoring.
Pros
- Specialized in API and microservices monitoring
- Automatic API discovery and documentation
- User-friendly interface
Cons
- More limited in scope compared to full-stack observability platforms
- Relatively new, with a smaller user base and community
- May require additional tools for comprehensive monitoring
Pricing
- Free tier available for small-scale use
- Paid plans based on API call volume and features
- Custom enterprise pricing is available
Key Aspects
- Focused solution for API observability and governance
- Combines monitoring, testing, and documentation for APIs
SolarWinds
SolarWinds offers a suite of IT management and monitoring tools, including network performance monitoring, server and application monitoring, and log analytics.
Their platform provides comprehensive visibility into IT infrastructure, both on-premises and in the cloud. SolarWinds offers features for automatic network discovery and mapping, helping teams understand their network topology. The suite includes tools for capacity planning, configuration management, and IT service management.
Pros
- Comprehensive suite covering various aspects of IT management
- Strong network monitoring capabilities
- Good for hybrid (on-premises and cloud) environments
- Extensive knowledge base and community resources
Cons
- Can be complex to set up and manage
- User interface may feel dated compared to newer tools
- Licensing model can be complicated
Pricing
- Various products with different pricing models
- Generally based on the number of elements monitored
- Both perpetual license and subscription models are available
Key Aspects
- Comprehensive IT management suite with a strong network monitoring focus
- Well-suited for traditional IT environments and hybrid cloud setups
HoneyComb
Honeycomb is an observability platform designed for debugging live production systems. It specializes in high-cardinality and high-dimensionality data.
Honeycomb offers powerful query capabilities, enabling users to ask complex questions about their system's behavior. The platform provides trace-driven debugging, allowing developers to follow requests across distributed systems. It also includes features for SLO monitoring and error budget tracking.
Pros
- Excellent for high-cardinality, high-dimensionality data
- Powerful query and data exploration capabilities
- Strong support for modern observability practices
- Good for debugging complex, distributed systems
Cons
- Can have a steeper learning curve for teams new to observability
- No first-class metrics & logs support.
- May be more expensive than traditional monitoring tools
- Less focused on traditional infrastructure monitoring
Pricing
- Free tier available for small teams
- Paid plans based on event volume and retention
- Enterprise pricing for large-scale deployments
Key Aspects
- Specialized in high-cardinality data exploration for complex systems
- Strong support for modern observability practices like SLO monitoring
Coralogix
Coralogix is a cloud-native log management and analytics platform designed for modern applications.
It offers advanced features for filtering, searching, and analyzing large volumes of log data. Coralogix integrates with various data sources and provides powerful tools for anomaly detection, predictive analytics, and compliance.
Pros:
- Excels at handling large volumes of logs.
- Supports logs, metrics, and traces.
- Utilizes ML for anomaly detection and predictive analytics.
- Offers tiered storage options.
Cons:
- May be challenging for new users.
- Less focused on these compared to log management.
Pricing:
- Tiered pricing based on data usage.
- Enterprise plans are available.
Key Aspects:
- Log management specialist.
- Strong ML integration.
- Flexible data ingestion and storage.
Chronosphere
Chronosphere is an observability platform designed for monitoring distributed systems and microservices. It is built on OpenTelemetry and offers a comprehensive set of tools for collecting, analyzing, and visualizing metrics and traces.
Pros:
- Utilizes OpenTelemetry for standardized data collection and analysis.
- Well-suited for monitoring distributed systems and microservices.
- Allows for flexible data retention and storage management.
- Provides seamless integration with the popular Prometheus monitoring system.
Cons:
- Less focused on log management compared to metrics and traces.
- May require advanced technical knowledge for complex configurations.
Pricing:
- Tiered pricing based on per-metric, per-user costs.
- Enterprise plans available for large-scale deployments.
Key Aspects:
- OpenTelemetry-based platform for metrics and traces.
- Custom storage tiering for optimized data retention.
- Strong integration with Prometheus.
Comparing the Top Cloud Monitoring Tools: Features and Costs
Selecting the Right Tool for Your Needs
When choosing a cloud monitoring tool, consider:
- Compatibility with your cloud provider(s)
- Scalability to match your infrastructure and microservices growth
- Depth of insights provided, and if recommendations feature exist
- Ease of use and dashboard customization
- Integration capabilities with your existing tools
- Pricing model and total cost of ownership
- Support for multi-cloud or hybrid cloud environments if relevant
- Ease of portability
Conclusion
Choosing the right cloud monitoring tool is crucial for keeping things running smoothly and managing costs. Each tool offers different features to fit various needs, whether you're after advanced analytics, cost efficiency, or smooth integration.
If you're exploring options, Last9 is worth a look. It handles high-cardinality and high-dimensional data really well, so you can dig into your telemetry data from different angles. Plus, with its integrated log management and trace capabilities, connecting metrics with logs and traces is a breeze.
Book a demo with us to know more about it!
FAQs related to Cloud Monitoring Tools
What are some DevOps tools for cloud computing?
DevOps tools for cloud computing include AWS CloudWatch, Azure Monitor, Google Cloud's Operations Suite, Last9, DataDog, New Relic, and Grafana. These tools help with monitoring, automation, and management of cloud resources.
What is cloud infrastructure monitoring?
Cloud infrastructure monitoring is the process of tracking and analyzing the performance, availability, and health of cloud-based resources and services. Tools like Last9 can help collect and analyze data from cloud systems to ensure optimal operation and quickly address issues.
Which monitoring tool is best?
The best monitoring tool depends on your specific needs:
- AWS CloudWatch for AWS-centric environments
- Last9 for high cardinality, real-time telemetry data
- Azure Monitor for Azure-based setups
- Google Cloud's Operations Suite for Google Cloud
- DataDog and New Relic for comprehensive, multi-cloud observability
- Grafana for customizable visualizations with open-source flexibility
What are the tools used for monitoring clouds?
Common tools for cloud monitoring include AWS CloudWatch, Azure Monitor, Google Cloud's Operations Suite, Last9, Grafana, and more.
How can I save costs on cloud monitoring?
To save costs on cloud monitoring:
- Choose tools with tiered pricing or free tiers for smaller needs (e.g., Grafana, Last9).
- Optimize data retention and filtering settings to reduce storage and ingestion costs.
- Monitor and analyze your usage to adjust plans accordingly.

