

Monitoring your systems can feel like keeping track of a million moving parts. Logs, metrics, traces—the constant flow of data can quickly turn into a whirlwind. Making sense of it all can be overwhelming, but that’s where a single pane of glass monitoring helps.
In this post, we’re going to break down what a single pane of glass monitoring means, why it’s so important, and how it can make your life easier by giving you a clearer view of your systems.
What Is a Single Pane of Glass Monitoring?
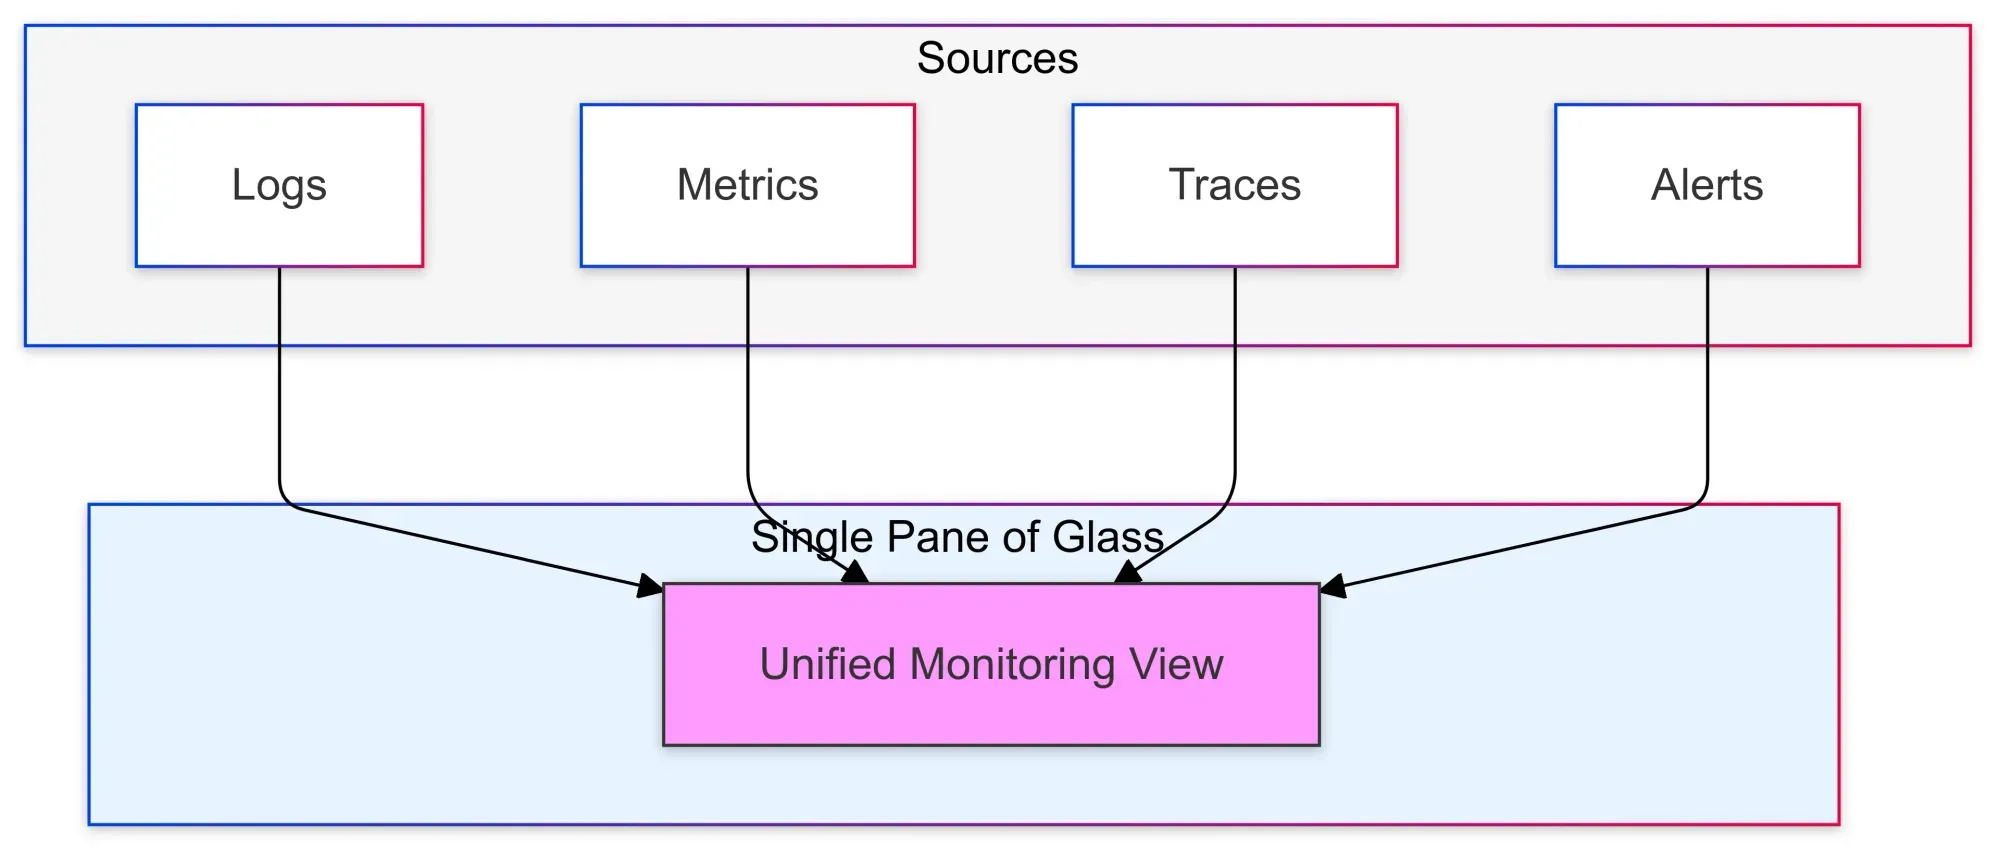
Picture this: instead of switching between multiple dashboards or tools to get a read on your system’s health, you have one central dashboard that brings everything together.
Single pane of glass monitoring does just that—providing you with a unified view of all your observability data i.e. metrics, logs, traces, or alerts, you get it all in one place.
In short, it means no more juggling between different screens and tools to understand what’s going on. Instead, everything you need is right in front of you, making it way easier to keep tabs on system performance and troubleshoot issues quickly.
For a deeper understanding of key metrics, check out our blog on Golden Signals for Monitoring.
Why Does Single Pane of Glass Monitoring Matter?
When you’re using multiple tools and dashboards, it’s easy to waste time jumping between them instead of solving the actual problem. That’s where a single pane of glass monitoring makes life a whole lot easier.
Here’s why:
- Everything in One Place
No more opening a dozen tabs or switching between platforms. With a single dashboard, you can see everything you need in one spot. It saves time and keeps you focused. - Faster Troubleshooting
When things go wrong, you need to find the issue fast. With logs, metrics, and traces all in one place, troubleshooting becomes smoother. You won’t be wasting time hunting for data across different tools. - Easier Teamwork
When everyone has access to the same data, collaboration is a breeze. With one dashboard everyone can check, and working through issues and finding solutions becomes a team effort. - Quick Incident Response
When you get an alert, you need to act fast. A unified view means your team knows exactly where to look and what’s wrong, so you can fix it quickly and minimize downtime. - Better Insights
Having everything in one place doesn’t just help you spot issues—it also gives you a clearer picture of how your system is performing overall. No more isolated data points; just rich insights at your fingertips.
Check out our blog on Synthetic Monitoring—see how simulated tests complement a single pane of glass by detecting issues before they impact real users.
How Does Single Pane of Glass Monitoring Work?
Single pane of glass monitoring works by pulling together data from various parts of your system. It gathers logs, metrics, traces, and alerts from different sources and displays them on one central dashboard.
Here’s an example: imagine there’s an issue with a service. Normally, you’d have to check your metrics tool for response times, dive into your logging tool to figure out what happened, and then check your traces to see where it’s failing.
With a single pane of glass monitoring, you can do all that from one dashboard. This unified view makes everything easier and helps teams work more quickly and effectively.
Key Benefits of Single Pane of Glass Monitoring
1. Time-Saving
Switching between multiple tools can be a huge time-suck. With everything in one place, you can quickly get the data you need and solve problems faster.
2. Stress-Free Troubleshooting
No more feeling like you’re searching for a needle in a haystack. You’ll always know where to go for the right data.
3. Easier Teamwork
Having a shared view of your system’s health ensures that everyone’s on the same page, making collaboration smoother and faster.
4. Proactive Monitoring
Being able to spot issues before they become major problems helps you take action quickly and avoid big headaches down the line.
How to Implement Single Pane of Glass Monitoring
Getting the most out of a single pane of glass monitoring requires more than just installing a tool. It’s about setting up a system that brings everything together in a way that makes sense for your team.
Here’s how to get started:
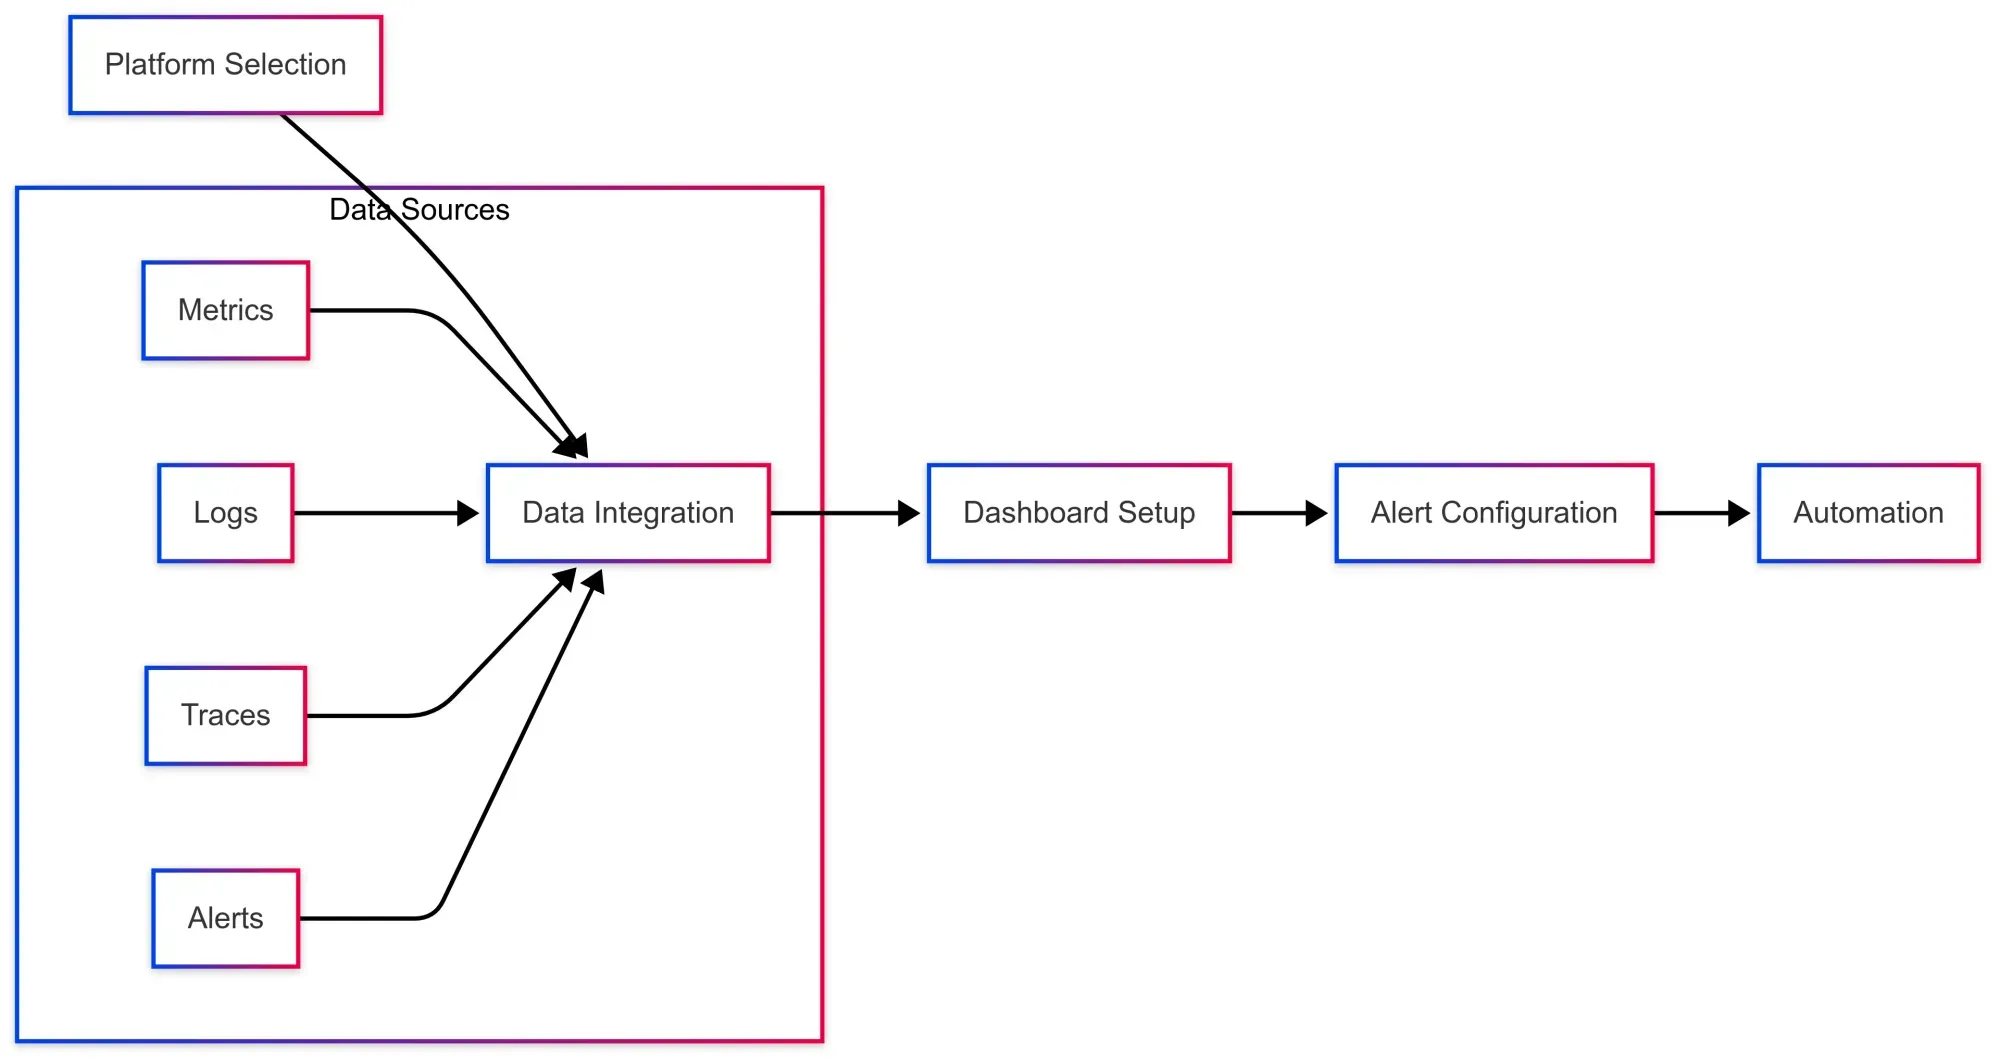
1. Choose the Right Platform
First, pick a platform that fits your needs. Whether you go for an open-source option like Prometheus and Grafana or something more advanced, ensure it integrates smoothly with your existing tools and infrastructure.
You want a platform that can collect data from various sources and display it all in one place, so integration is key.
2. Integrate Your Data Sources
To create a unified view, you need to bring all your data into one dashboard. This means integrating your metrics, logs, traces, and alerts into a central place.
Many modern monitoring tools offer built-in integrations with observability platforms, so this step is usually straightforward. The goal is to have all your system data flowing into one spot for easy access.
3. Customize Your Dashboards
No two teams are the same, so it’s important to customize your dashboards to show the metrics and logs that matter most to your team.
Think about the problems you encounter most often and tailor your dashboard to make those easy to track. The more relevant your data, the easier it will be to spot issues and take action when something goes wrong.
4. Set Up Alerts
Proactive monitoring is essential for staying ahead of problems. Make sure your system is set up to send alerts when something’s off.
Whether it’s a sudden spike in response times or service downtime, having alerts in place allows you to address issues before they escalate. Keep your alerts clear and specific, so your team knows exactly what to do when something triggers.
5. Automate Where You Can
Automation is a great way to reduce manual work and save time.
For example, you can set up your system to automatically handle certain tasks like alert responses, resource scaling, or even incident resolutions. This way, routine issues can be handled quickly, and human error is minimized. The more you automate, the more efficient your monitoring setup will be.
How Can Automation and Integration Enhance Your Monitoring Solution
One of the most powerful aspects of a single pane of glass monitoring is its ability to integrate with existing tools and automate processes.
By doing so, it drastically reduces manual efforts and boosts operational efficiency. Here’s how automation and integration work together to enhance your monitoring solution:
Automation
In the context of monitoring, automation means that when an issue is detected, your system can automatically trigger the appropriate response—whether it’s alerting the team, scaling resources, or even trying a predefined fix.
- Faster Incident Response: For example, if a service’s response time exceeds a set threshold, automated actions could alert the team, restart the service, or scale up resources—all without manual intervention.
- Reduced Human Error: Automation reduces the chances of mistakes that can occur when tasks are handled manually.
- Continuous Monitoring: Even when no one is actively watching, automation ensures issues are addressed quickly, minimizing downtime.
Integration
Today, there are many different tools and platforms in use, from monitoring services to incident management solutions.
Integration allows these tools to communicate with each other, feeding data into your unified dashboard.
This ensures you have the most up-to-date and complete view of your system.
- Unified Data View: Whether it’s pulling logs from a log aggregation tool or metrics from a cloud service, integration ensures your dashboard displays everything in one place.
- Easy Tool Compatibility: The ability to integrate with observability platforms like Prometheus, Grafana, or OpenTelemetry means you can continue using your favorite tools while still benefiting from a unified monitoring solution.
- Simplified System Management: Integration reduces the complexity of juggling multiple standalone tools, making system management much easier.
Why Flexibility and Accessibility Matter in Monitoring
One of the biggest benefits of a single pane of glass monitoring is its ability to adapt to the changing landscape.
With organizations using a mix of platforms and tools, a flexible monitoring solution helps bring everything together, no matter where your data is stored.
Here’s why flexibility and accessibility are so important:
- Works Across Different Platforms: A single pane of glass system can bring all your data into one view, making it easier to manage, no matter if you’re using cloud, on-prem, or a hybrid environment.
- Customized for Your Team: Different people need different things. Dashboards can be customized for developers, operators, security teams, and managers, showing them only the data that’s relevant to their role.
- Access Anywhere, Anytime: Flexible monitoring systems ensure you can always stay informed, whether you’re on a desktop or mobile device.
- Scalable for Growth: As your infrastructure grows, your monitoring system can grow with it, accommodating new data sources to keep your systems running smoothly.
- Team Collaboration Made Easy: With accessible data, teams across your organization can collaborate more easily, even if they don’t have deep expertise in each other’s areas, making decisions faster.
Flexibility and accessibility ensure that a single pane of glass monitoring is adaptable, scalable, and able to meet the diverse needs of your teams and platforms.
Observability Without Silos: Last9’s Integrations
Effective observability relies on collecting data from multiple sources—cloud infrastructure, databases, applications, and third-party monitoring tools.
A Single Pane of Glass approach depends on seamless integrations that consolidate this data, reducing the need to manage multiple dashboards. Here’s how Last9’s integrations help engineers and DevOps Teams:
1. Automated Data Ingestion Without Manual Overhead
Manually setting up monitoring for cloud resources, databases, and applications often requires complex configurations, custom scripts, and continuous maintenance.
Last9 simplifies this by offering native integrations that:
- Automatically discover and ingest metrics from cloud services, databases, and observability tools.
- Eliminate the need for custom data pipelines, reducing engineering effort.
- Ensure real-time data collection, avoiding delays caused by manual configurations.
2. Faster Root Cause Analysis With Unified Monitoring
Debugging issues in modern distributed systems often involve piecing together data from multiple sources—cloud dashboards, database logs, and application tracing tools. Last9 integrations provide a unified observability layer, enabling teams to:
- Correlate infrastructure, database, and application performance in a single interface.
- Trace issues across different layers—for example, linking API latency spikes to slow database queries.
- Reduce Mean Time to Resolution (MTTR) by eliminating the need to switch between multiple monitoring tools.
This means that if an application experiences latency, engineers can instantly view whether the issue is caused by increased CPU usage on an EC2 instance, a slow database query, or an external service dependency—all from a single dashboard.
3. Seamless Scaling of Observability
As infrastructure scales, so does the complexity of monitoring. Last9’s integrations are designed to adapt automatically to growing environments by:
- Detecting new cloud resources and services as they are deployed, ensuring continuous visibility.
- Providing out-of-the-box dashboards for databases and cloud services, reducing setup time.
- Supporting high-cardinality metrics without performance degradation, making it ideal for large-scale environments.
Reducing Alert Fatigue with Alert Studio
Too many alerts can overwhelm teams, making it harder to spot real issues. Alert Studio helps cut through the noise by making alerts more transparent, meaningful, and actionable.
Here’s how it helps:
- Know why an alert fired – Instead of treating alerts as a black box, Alert Studio shows real-time metrics from the alerting engine, so teams can see exactly what triggered an alert.
- Spot patterns before they become problems – Teams can correlate changes in system health with config updates or environmental shifts by tracking trends across infrastructure, applications, and business metrics.
- Set up alerts the right way, faster – With built-in support for Infrastructure as Code (IaC) and GitOps workflows, teams can manage alerts more efficiently without manual tweaks.
- Fewer false alarms – Static thresholds often lead to unnecessary alerts. Alert Studio uses Anomalous Pattern Detection to identify real deviations, reducing false positives.
Conclusion
Single pane of glass monitoring isn’t just about convenience—it’s about clarity. With all your observability data in one place, you can act faster, work smarter, and get a clear picture of what’s going on across your systems. It makes troubleshooting easier and helps your team stay on top of system health.
At Last9, we’ve created a Telemetry Data Platform that changes the game when it comes to balancing performance and cost in observability. It’s designed to scale without compromise, and companies like Disney+Hotsar, Brightcove, and Replit trust us to help them keep their systems running smoothly.
We make handling high-cardinality data feel easy, processing 110 trillion events with spikes of 11 trillion a month during cricket season. This allows teams of all sizes to find meaningful insights while keeping costs in check.
If you’re looking for an effective way to improve observability, schedule a demo with us today!
FAQs
What is a single pane of glass monitoring?
A single pane of glass monitoring refers to a unified dashboard that aggregates all your observability data—metrics, logs, traces, and alerts—into one view. It eliminates the need to switch between different tools and dashboards, offering a centralized perspective to help teams monitor and troubleshoot systems more efficiently.
How does a single pane of glass monitoring improve system management?
It simplifies system management by consolidating all critical data in one place, allowing teams to access everything they need without juggling between different platforms. This centralization helps improve decision-making, speeds up troubleshooting, and enhances overall system visibility.
Can a single pane of glass monitoring handle different environments like cloud and on-prem?
Yes, it’s highly adaptable. Single pane of glass monitoring can integrate data from cloud, on-prem, and hybrid environments, making it a versatile solution that works across diverse platforms and technologies.
Is a single pane of glass monitoring customizable?
Absolutely! You can tailor your dashboards to show the most relevant data for different roles—developers, security teams, operations, and management—ensuring that each team gets the insights they need for their specific tasks.
How does single pane of glass monitoring enhance collaboration among teams?
Real-time access to the same data across teams improves transparency and communication with a single pane of glass monitoring. When everyone views the same dashboard, it becomes easier to resolve issues collectively and make informed decisions quickly.
Does a single pane of glass monitoring help with incident response?
Yes, it does. When an issue arises, the unified view makes it easier to identify the problem and respond faster. Since all the necessary data is displayed in one place, teams can resolve incidents more efficiently and minimize downtime.
Can a single pane of glass monitoring scale with growing systems?
Yes, one of the key advantages of a single pane of glass monitoring is its scalability. As your infrastructure grows, you can continue to add new data sources and integrate them into the existing dashboard without losing visibility or performance.
Is it possible to automate tasks with a single pane of glass monitoring?
Definitely! Automation is a big benefit. For example, when an issue is detected, the system can automatically trigger predefined actions such as sending alerts, scaling resources, or even attempting a fix—saving time and reducing human error.
Can I access my single pane of glass monitoring dashboard from mobile devices?
Yes, most systems are designed to be accessible across devices, including mobile. This ensures that team members can stay informed and manage systems no matter where they are.
What are the benefits of using a single pane of glass monitoring for DevSecOps teams?
Single pane of glass monitoring is particularly helpful for DevSecOps teams, as it provides a unified view of development, security, and operations data. This centralized approach leads to better alignment across teams, faster issue resolution, and improved threat detection.

