

In the early days of Google, a lot of users were asking for 30 results on the first page of search results. So after long deliberation, Marissa Mayer, then the Product Manager for google.com, decided to run the A/B test for ten vs 30 results. When the results came in, they were in for a surprise.
Traffic and revenue from Google searchers in the experimental group with 30 results dropped by 20%.
Damn! Why? Why would the traffic and revenue drop by 20% when the users had asked for this? Why would they hate it now?
After a deep dive, they found an uncontrolled variable. Page Speed or Latency. Yes. Latency.
💡 The page with ten results took 0.4 seconds to generate. The page with 30 results took 0.9 seconds.
A delay of half a second killed end users’ satisfaction. Let’s hear that half a second in the early 2000s caused a 20% drop in traffic.
‘Being fast’ matters. Latency was now the new downtime in an always-online world.
Hi! This article is for folks interested in performance analysis or software operations who want to understand its impact on user experience. The objective is to provide a deep understanding of what latency is, how to measure it and how to improve it in today’s complex cloud architectures.
Defining Latency
Latency is a measure of how “slow” something is.
Latency is a measure of how long it took to do something. For example, I had to stand in a queue for the last 9 minutes
Depending on where and how you measure it, some call it “response time” or “service time” measured in units of time like seconds, minutes, etc.
Since computers are pretty fast, we usually want to measure latency in milliseconds or microseconds.
End-User Experience
The primary reason why we must care for latency is the end-user experience. Whether it is revenue or pageviews that matter to your business, it is uncanny how closely it correlates with page load times.
Humans detect visual stimuli in approximately 200 ms, whereas for sound, it is around 140–160 ms. However, perceivable internet latency is much lower than that [Ref#1]. So for websites, you generally want to optimize for ~300ms page load times or faster, and definitely under 1s. And for API, it has to be even quicker, ideally under ~50-100ms.
Low latency is key to winning your customers!
💡 But if folks make more money off customers when they reduce latency, there has to be some power in increasing latency! So what could that use case be?
Reddit or Twitter with 150ms latency feels like cocaine. With 9000ms latency, it feels like your code is compiling, and you need a coffee break.
Storytime!
Spam on the internet is so widespread that we have incredibly sophisticated solutions to control it. On one such occasion, when we were running an online forum, some kids were challenging to manage. We would block their IP addresses, but they would come back with VPN tunnels and create new profiles. Finally, after several weeks of our virtual fight and deliberations, we hit on a gold nugget of an idea—the most effective one. Guess what? Latency. Yes. Latency.
We started adding a sleep() for each page and rendering it 3 to 30 secs slower for these spammers! Worked like a charm. Over a while, it became the most effective way to control spam. Degrading end-user experience, as much as improving it, was here to stay!
Measuring Latency
If latency is a measure of time, then we should be able to measure it through a clock. Measure at the ‘start’ of an event/process and take another measurement at the ‘end.’ Their difference is how long it takes to do something.
In reality, things get a bit more complicated than that. Especially in a distributed systems world, with the involvement of synchronized clocks, leap seconds, and timezones.
Code for measuring latency in most programming languages will look something like this:
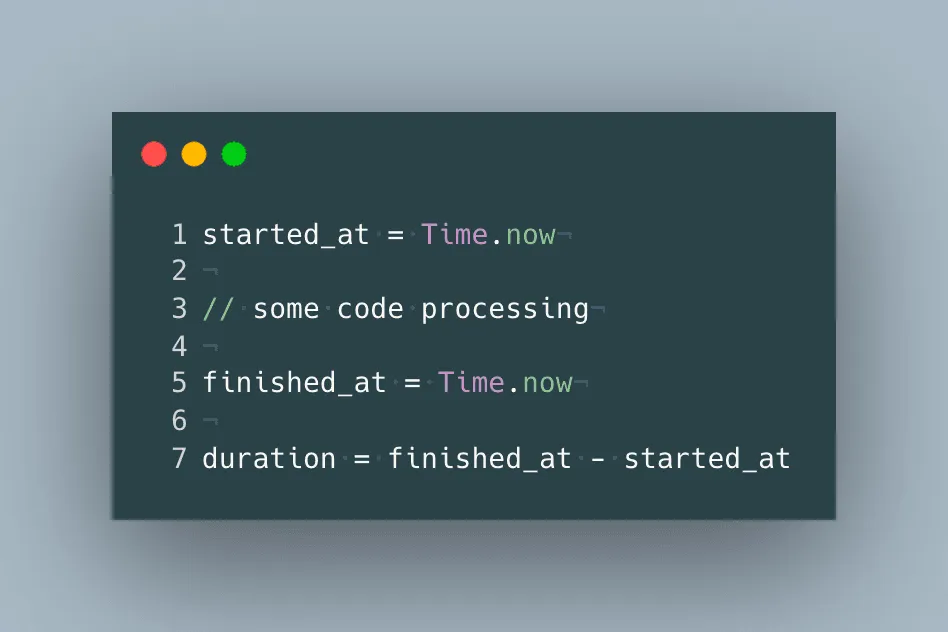
“Current time” provided by programming languages usually defers the operating system, which gets its time via the network time protocol.
These latencies we measure are needed to understand the behavior of the API or program we are building to serve end-users. Therefore, it becomes crucial to accurately measure, store and analyze.
These latencies can then be stored in most time-series databases. Most HTTP servers can be configured to write latency numbers (response time or service time) to their logs or expose them to OpenMetrics and OpenTelemetry - compatible storage. You can also store them in a dedicated metrics storage like Last9 for fast & efficient retrieval.
Synchronous APIs (Request - Response)
Let’s say you are the owner of a micro-service that provides an API for your end-users to login into the application. The request logs will look along these lines.
Mon Jul 4 16:32:54 /v3.1/login - 200 - Request processed in 120ms
Mon Jul 4 16:33:19 /v3.1/login - 200 - Request processed in 10ms
Mon Jul 4 16:33:24 /v3.1/login - 200 - Request processed in 98ms
Mon Jul 4 16:33:58 /v3.1/login - 200 - Request processed in 40ms
Mon Jul 4 16:34:19 /v3.1/login - 400 - Request processed in 48ms
You can extract the latency from these log lines as:
120ms
10ms
98ms
40ms
48ms
Depending on how many API invocations you get, these could suddenly be a lot of metrics to deal with. For example, if you get 1000 requests per minute, it would be 43.2Million (1000_60_24*30) data points for a month, just for this single API call!
Naturally, it’s hard not just to store this information, but also to visualize and infer any insights.
Typically you would find the APIs are invoked in WORM (Write Once Read Many) patterns, which means you can point read APIs to a faster/replica/cache database or host it on a content delivery network.
Asynchronous Jobs (Publish-Subscribe)
In an asynchronous system, latencies are a bit fuzzier to measure, and you have to break it down into 2 or 3 pieces to stitch the story together. Let’s take an example of people (workloads) being enqueued and a processor working on them in a FIFO.
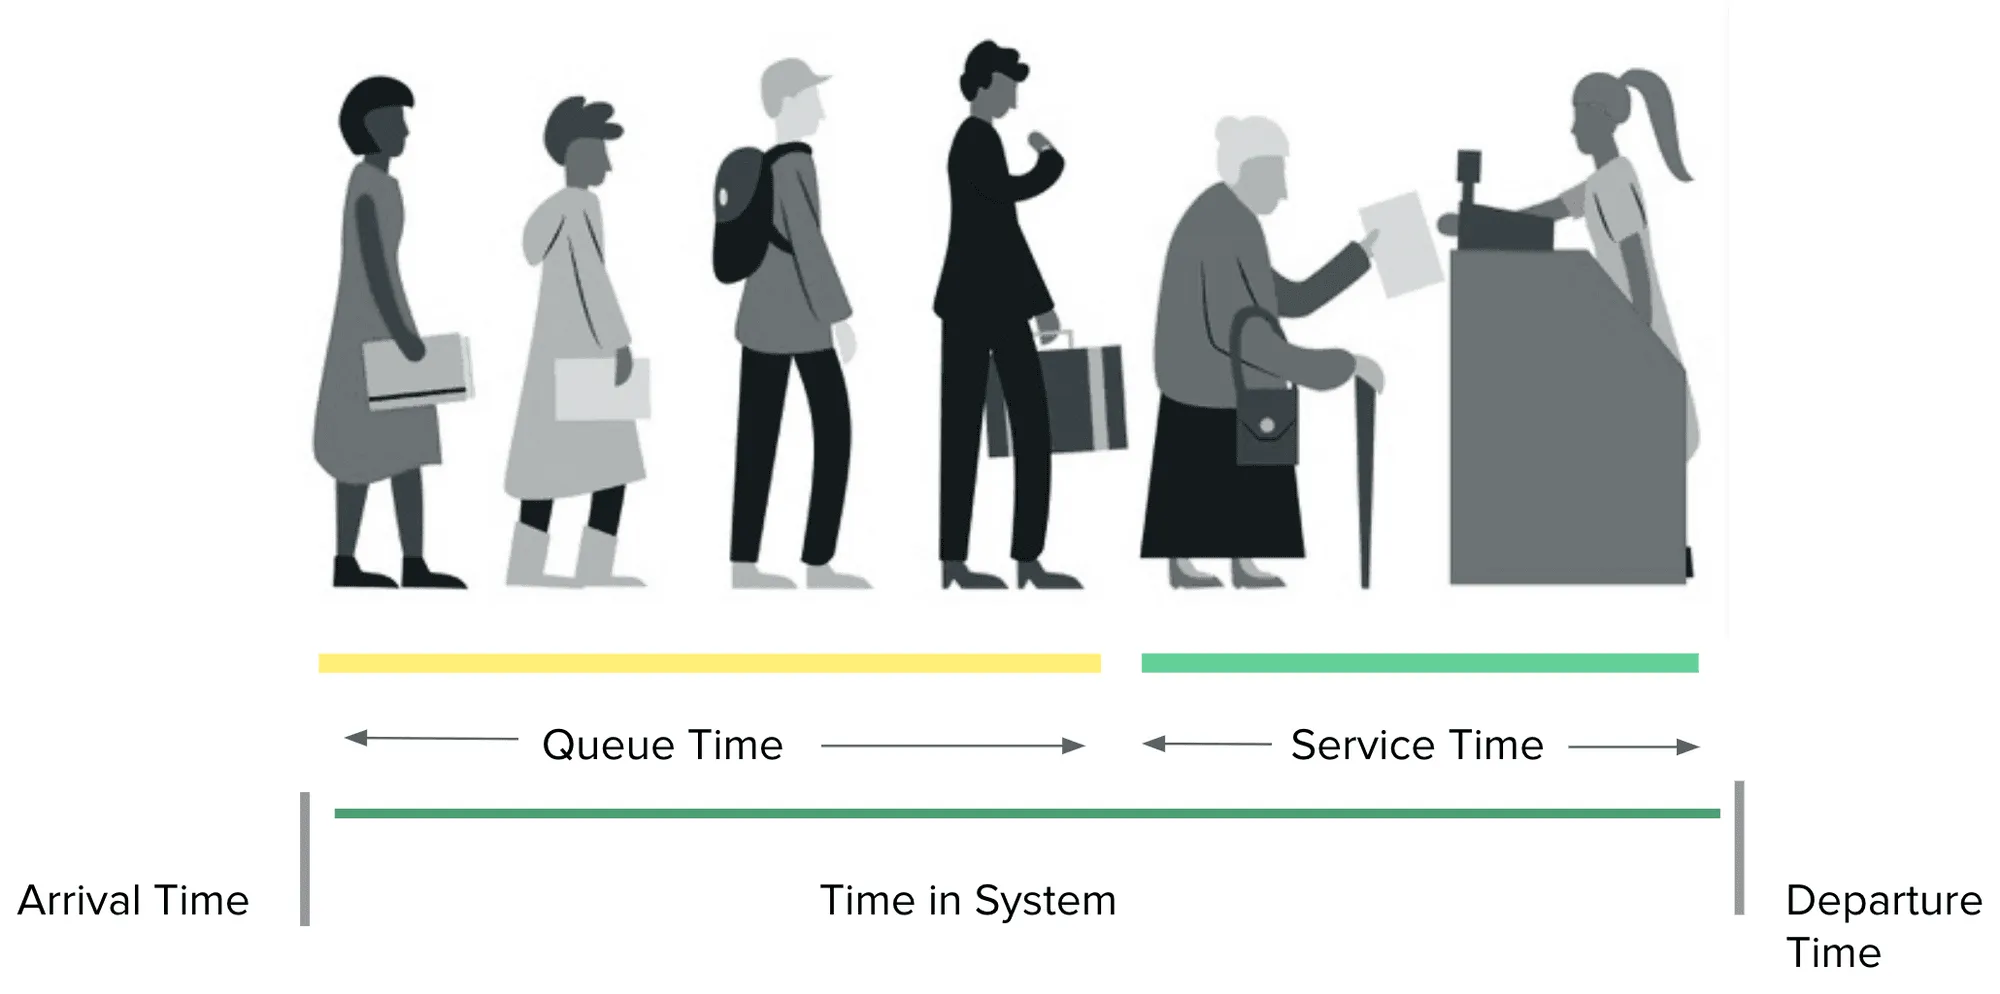
The overall latency then becomes spread over two stages — Queue Time & Service Time, both in total giving us a Turn Around Time (TAT).
This naturally gets trickier and more complex as you increase this from a single queue to multiple queues and from a single processor to various processors. This is largely covered under Queueing theory.
But back pressure (length of queue) buildup is the single biggest metric that tells you if your system is performing under limits or not. When designing a system, you should use back pressure and TAT as key indicators to know if the system is doing well.
Need for Aggregation
As you realize, each request or operation that occurs has its own latency. So, a single API call with a throughput of 1000 rpm will lead to 43.2M requests a month. How are we to possibly understand what’s important in those? What’s broken? Where to look at? What are the outliers? What we are more interested in is the latency behavior over a sufficient load and period of time.
So, in practice, you want to aggregate these numbers into fewer ones to deal with and then take decisions. Aggregations are done over a period of time, commonly referred to as resolution or window.
Average
The simplest form of aggregation is average (mean). It’s simply the sum of all the 43.2M requests divided by 43.2M.
Percentiles
The most widely used aggregation for latencies is percentiles.
Given a series of records, a percentile is a value greater than those many percentages of the records.
💡 The 99th percentile latency is the worst latency that was observed by 99% of all requests. It is the maximum value if you ignore the top 1%.
Example: 20th Percentile is a value greater than 20% of the values.
A common notation for the 99th percentile is “p99”. The 99.9th percentile is “p999”.
Learn more about why Latency Percentiles are incorrect P99 of the time.
Real-world challenges
When building applications in the real world, we ideally want to measure latency for an API or an endpoint, a piece of code, or a database query and be able to correlate them altogether! The challenge emerges from understanding these metrics and being able to co-relate them to other pieces of information available. It’s also important to be able to answer practical aspects like,
- If Latency is degrading
- Isolate the degradation to a particular subsystem or a customer experiencing it.
- Understand the traffic funnel to find which component (hop) is under stress.
A popular time-series database (Prometheus) that stores latency data about all components in a system is unfortunately troubled with several challenges, like handling large cardinality sets.
Measuring per customer/tenant
While most tools, like APM, help measure code performance, it’s extremely hard to isolate which customers were affected. Ideally, it can be solved by instrumenting the code and emitting label sets that identify information particular to that tenant or a customer. But then we run into a high cardinality problem, which tends to overwhelm these tools in the first place. Except for Last9’s service catalog, hardly any tools help solve this challenge.
Accuracy
Accuracy of measurements due to histograms and other bucketing data leads to ‘leaky’ interpretation and measurements — impacting how real consumers experience it vs. what our tools report to us.
Why are they incorrect P99 of the time?
Detecting degradation
No matter how much time is dedicated to performance testing, real-world challenges around Latency emerge with real live user traffic—most of the time, one experiences gradual degradations in performance rather than sudden drops in latency performance. A sudden drop usually correlates with some internal system change — a deployment or a config change.
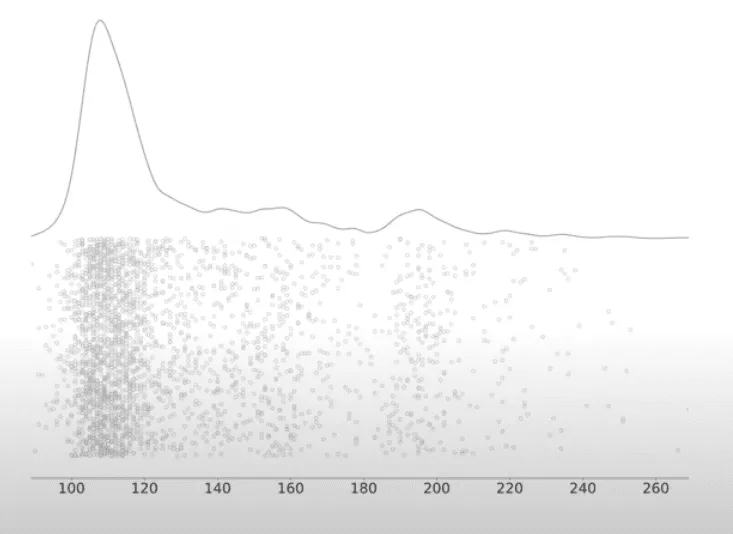
The below image showcases the load times of a web page. The grey line is the distribution of latencies, while the dots represent actual values. This indicates — a typical response time for our web page falls between 100 to 130 ms.
Several requests showcase degraded performance. Which request should we triage at first and why?
End to end observability
As in the web page, the performance chart is plotted above, and it’s important but insufficient information to understand where we begin our triaging to arrive at answers. For example, how do we know where in the request flow is the bottleneck? Do all of them happen at the same place for all requests? Is it somehow due to a network blip at some point?
Last9’s compass helps solve a lot of these challenges.
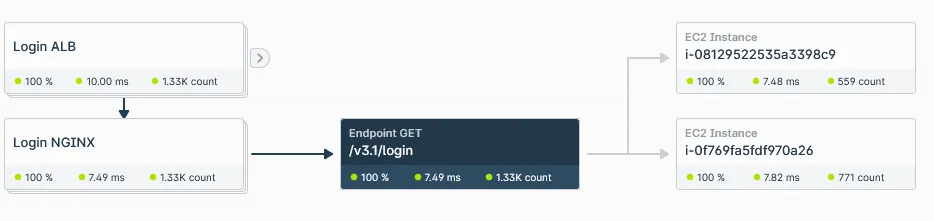
For a Login web page served from NGINX running on 2 EC2 instances. Here are a few very interesting observations.
Login ALB & NGINX are both serving 1330 throughput right now, but the Latency at ALB for this API is 10ms, while at Nginx, it is 7.49ms. But even more interesting is the part where distribution on both EC2 nodes is inconsistent. For example, one gets 559 requests at a latency of 7.48ms, while the other calls 771 requests and has a slightly higher latency of 7.82ms.
Improving Latency
One of the most critical developments in the industry in the last few years has been the availability of tools that help isolate latency issues. The most significant leap has come from adopting SLOs — Service Level Objectives for Latency & related metrics.

