
Here’s a detailed blog post on monitoring Google Cloud Functions tools from the Prometheus ecosystem. We discuss the data flow for sending metric data from Google Cloud Platform (GCP) Cloud Functions to a Prometheus Pushgateway, then to a Prometheus scrape job, and finally to a remote write data store for metrics with higher availability and durability.
Monitoring Google Cloud Functions
Traditionally, Prometheus-based systems periodically scrape targets and pull metrics. However, this strategy does not work well with Google Cloud Functions. Google Cloud Function workloads are asynchronous, which means they run periodically or are invoked when certain conditions are met. For such workloads, scraping metrics, a pull-based model, becomes a futile strategy as the availability of metric data is not a certainty given the frequency of scrapes. Hence, a push-based model is better suited for such workloads.
Pushgateway is a component in the Prometheus ecosystem that can be used in this scenario to push metrics.
GCP Cloud Function to Pushgateway
The process starts with Google Cloud Functions. These small pieces of code are event-triggered and run in the cloud. It would be best to instrument these functions to collect metrics (like function execution time, error rates, etc.). Once a function is triggered and completes its execution, it sends its metrics to the Prometheus Pushgateway. This is done through an HTTP POST request, with the metrics data in the request’s body.
Pushgateway
The Prometheus Pushgateway is a metrics cache. The primary use case is for collecting metrics from jobs that are intermittently running and cannot be scraped in real-time (like batch jobs or, in this case, serverless functions). The Pushgateway stores these metrics until Prometheus scrapes them.
Prometheus Scrape Job
Prometheus is configured to scrape metrics from different sources at regular intervals. In this case, one of those sources is the Pushgateway. When Prometheus performs a scrape operation, it makes an HTTP request to the Pushgateway’s /metrics endpoint, which returns all the current metric data.
Prometheus to Remote Write Data Store
Prometheus has a feature called “remote write” which allows it to send the metrics data it collects to a remote data store, i.e., Levitate. When Prometheus remote writes to another data store, it sends all its collected data, including the metrics scraped from the Pushgateway.
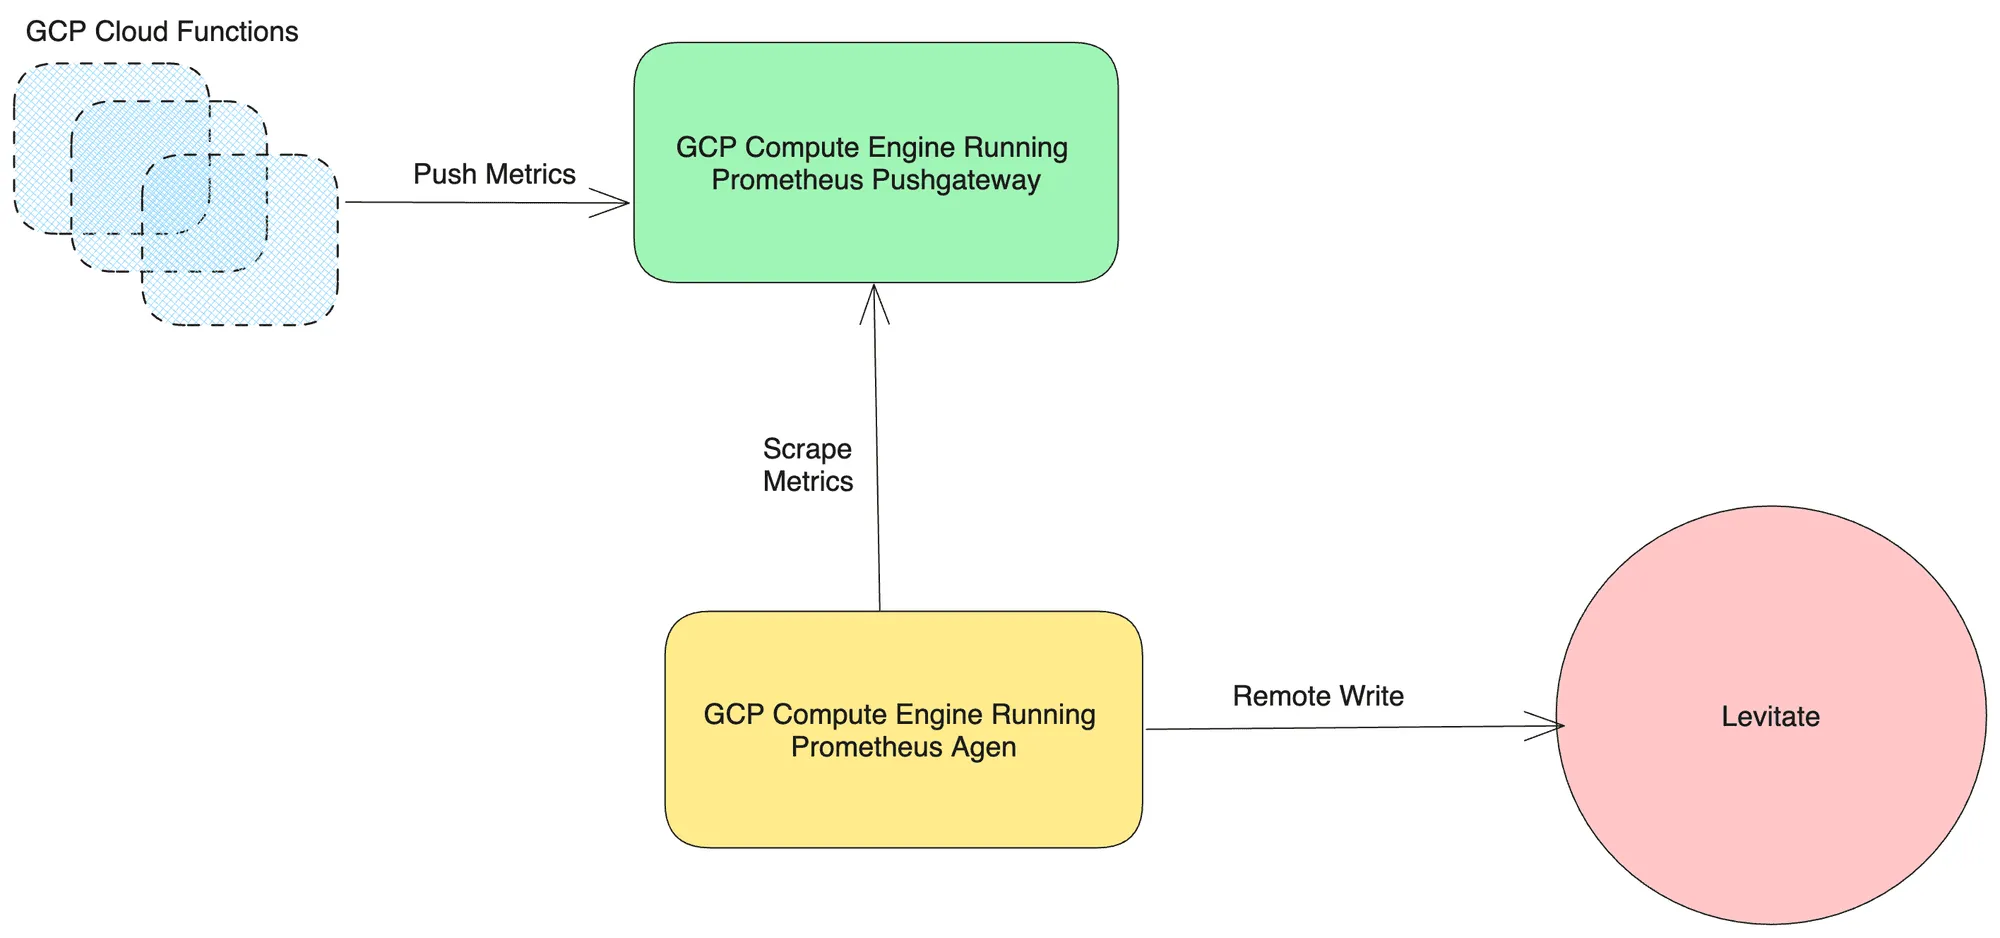
The data flow is as follows:
GCP Cloud Function -> (HTTP POST) -> Pushgateway -> (Prometheus Scrape) -> Prometheus -> (Prometheus Remote Write) -> Remote Write Data Store
Each part of this process can be monitored and logged for more visibility, and every component can be secured using networking rules and access controls to ensure the security and integrity of your metrics data.
How to instrument Google Cloud functions?
Instrumenting the Google Cloud functions to push metrics to a Prometheus Pushgateway involves using the Prometheus client libraries in the function code.
Import the Prometheus Client Library
To start, import the Prometheus client library for your chosen programming language. The complete list of libraries can be found here.
Register Metrics
Define and register Prometheus metrics in your code. Metrics include counters, gauges, histograms, and summaries. For example, in Python, you can create a gauge metric like this:
from prometheus_client import CollectorRegistry, Gauge, push_to_gateway
# Create Prometheus metricsregistry = CollectorRegistry()
# Gauge for account balance with 'account_id' labelbalance = Gauge('bank_account_balance', 'Current account balance', ['account_id'], registry=registry)
# Counter for successful auto-debit transactionssuccessful_debits = Counter('bank_auto_debit_successful', 'Successful auto-debit transactions', registry=registry)
# Counter for failed auto-debit transactionsfailed_debits = Counter('bank_auto_debit_failed', 'Failed auto-debit transactions', registry=registry)
Update Metrics in Your Functions
Upgrade the metric values based on your application’s behavior inside your functions. For example, you can increment a counter or set the value of a gauge:
balance.labels(account_id=account_id).set(amount) # Set gauge valuesuccessful_debits.inc() # Increment counterUpdate the metrics based on your application’s behavior or performance. You can create and update as many metrics as needed.
Push Metrics to the Prometheus Pushgateway
Periodically, push the collected metrics to a Prometheus Pushgateway. Here’s how you can push metrics to a Pushgateway in Python:
# Push metrics to Prometheus Pushgateway try: push_to_gateway(pushgateway_url, job='bank_auto_debit', registry=registry) print(f"Metrics pushed to Prometheus Pushgateway: {pushgateway_url}") except Exception as e: print(f"Failed to push metrics: {e}")The Pushgateway stores these metrics until Prometheus scrapes them.
How to set up a Pushgateway
Setting up a Prometheus Pushgateway can be done by using a pre-built Docker image or downloading and running the binary directly.
Here’s a brief overview of how to set it up in both ways:
Using Docker
If you have Docker installed, you can use the pre-built Docker image to start a Pushgateway instance:
docker run -d -p 9091:9091 prom/pushgatewayThe -d flag tells Docker to run the container in the background. The -p 9091:9091 flag tells Docker to map port 9091 in the container to port 9091 on your host machine.
After running these commands, you should be able to access the Pushgateway at http://localhost:9091.
Scraping metrics from Pushgateway using Prometheus Agent
As any prometheus exporter, the Pushgateway also exposes metrics on the /metrics endpoint. Depending on the number of Pushgateway instances you are running, you must declare those as targets in your Prometheus scrape configs.
Example scrape config
scrape_configs: - job_name: 'pushgateway' honor_labels: true static_configs: - targets: ['<pushgateway-address>:9091']Remote Writing data to Levitate
Instead of storing metrics locally, you can send them to long-term storage like Levitate for further analysis.
The last step here is to declare your remote TSDB endpoint, which ingests all metric data that the Prometheus agent writes. In this case, we have used Levitate as the preferred choice of remote TSDB. Check out the docs on how to remote write to Levitate here.
Example Setup
Check out this repo containing a docker-compose setup that runs a Python function as a service instrumented using the prometheus client library along with Pushgateway and Vmagent configured to collect, scrape, and ship metrics to Levitate. This setup is agnostic to any Faas provider. https://github.com/last9/faas-monitoring
Conclusion
By instrumenting your serverless functions, you collect and push metrics to the Prometheus Pushgateway, making them available for monitoring and analysis. You can also push them to long-term storage, such as Levitate.

