

Prometheus and Grafana are open-source tools that work together to make performance monitoring easier.
Prometheus quietly collects system metrics, while Grafana turns them into interactive visualizations. Prometheus handles data collection and querying, and Grafana makes that data easy to understand and act on.
But how do they work together to give you a complete picture of system health?
In this blog post, we’ll break down exactly how Prometheus and Grafana team up for monitoring and observability. Plus, we’ll walk you through the steps to connect them and get started with ease.
What is Prometheus?
Prometheus is an open-source monitoring system designed to collect and store time-series metrics from applications, software systems, and hardware.
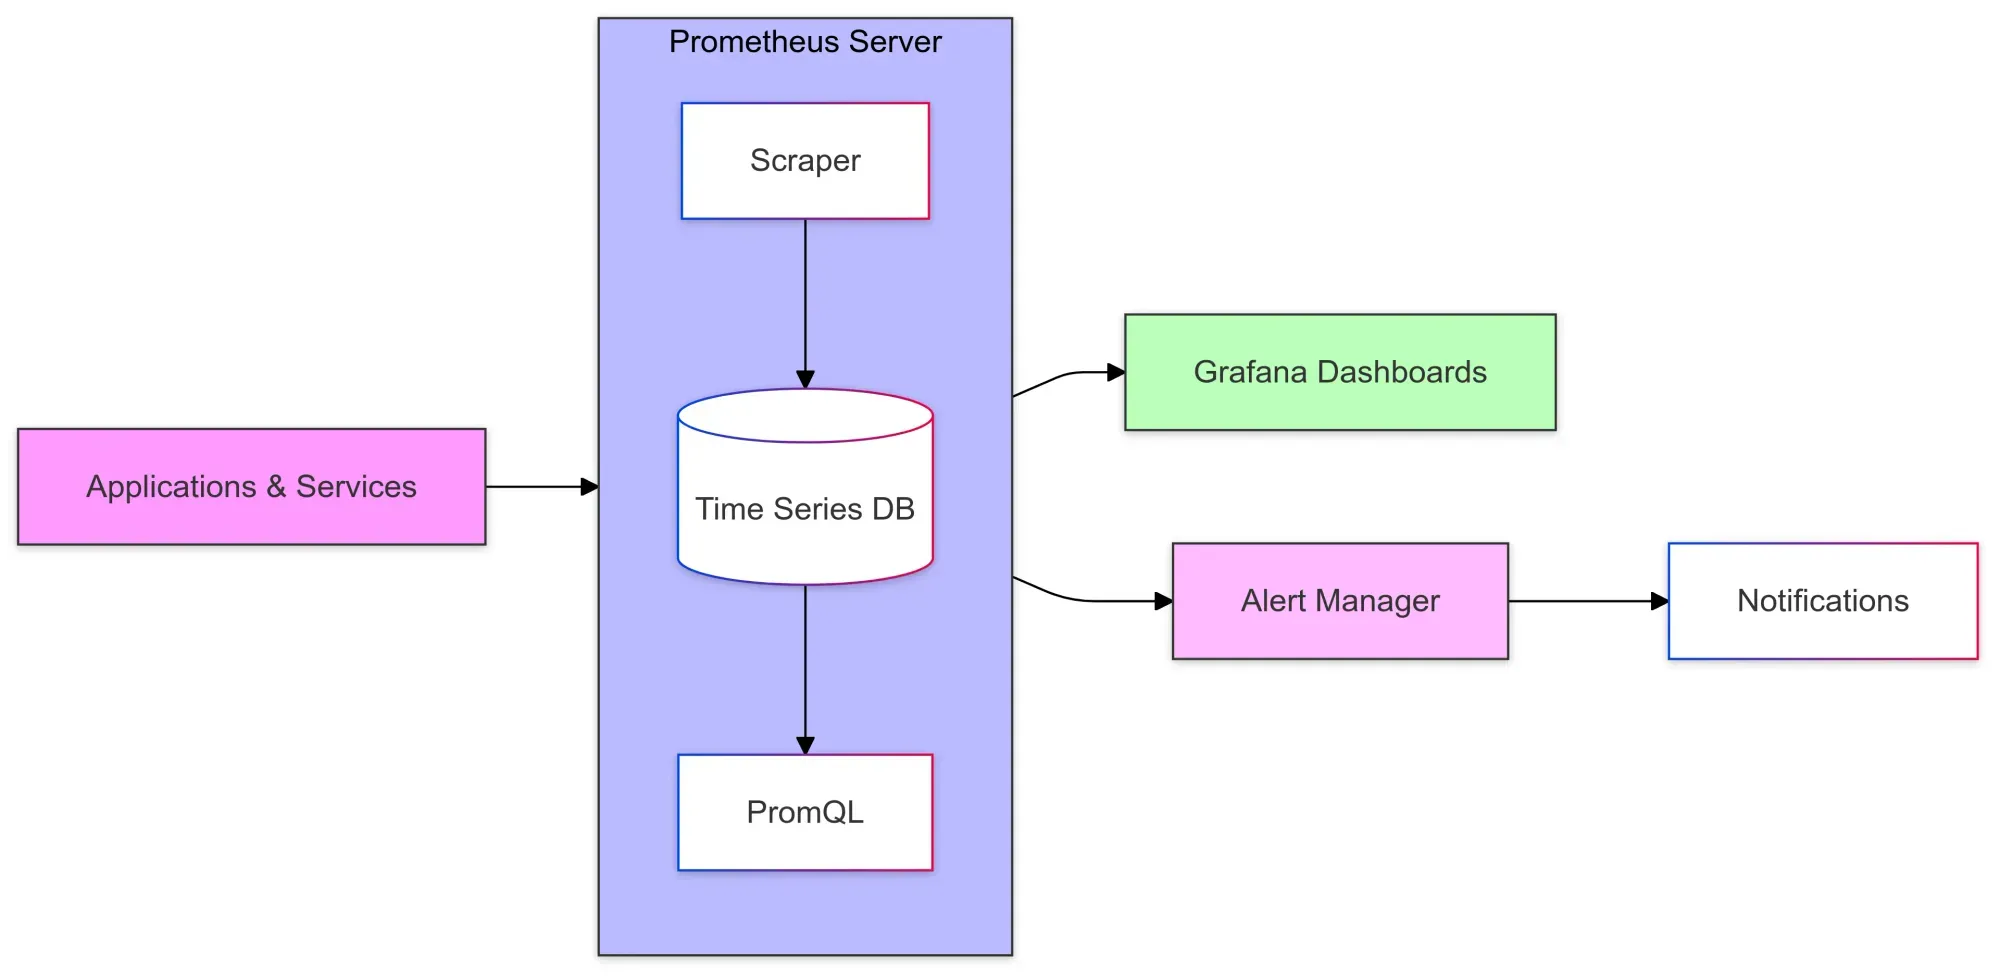
Originally developed by SoundCloud in 2012, it was donated to the Cloud Native Computing Foundation (CNCF) in 2016. Built for modern cloud-native environments, Prometheus supports various deployment models.
It uses PromQL, a powerful query language, and offers alerting features, allowing you to stay proactive in monitoring your system’s performance.
What is Grafana?
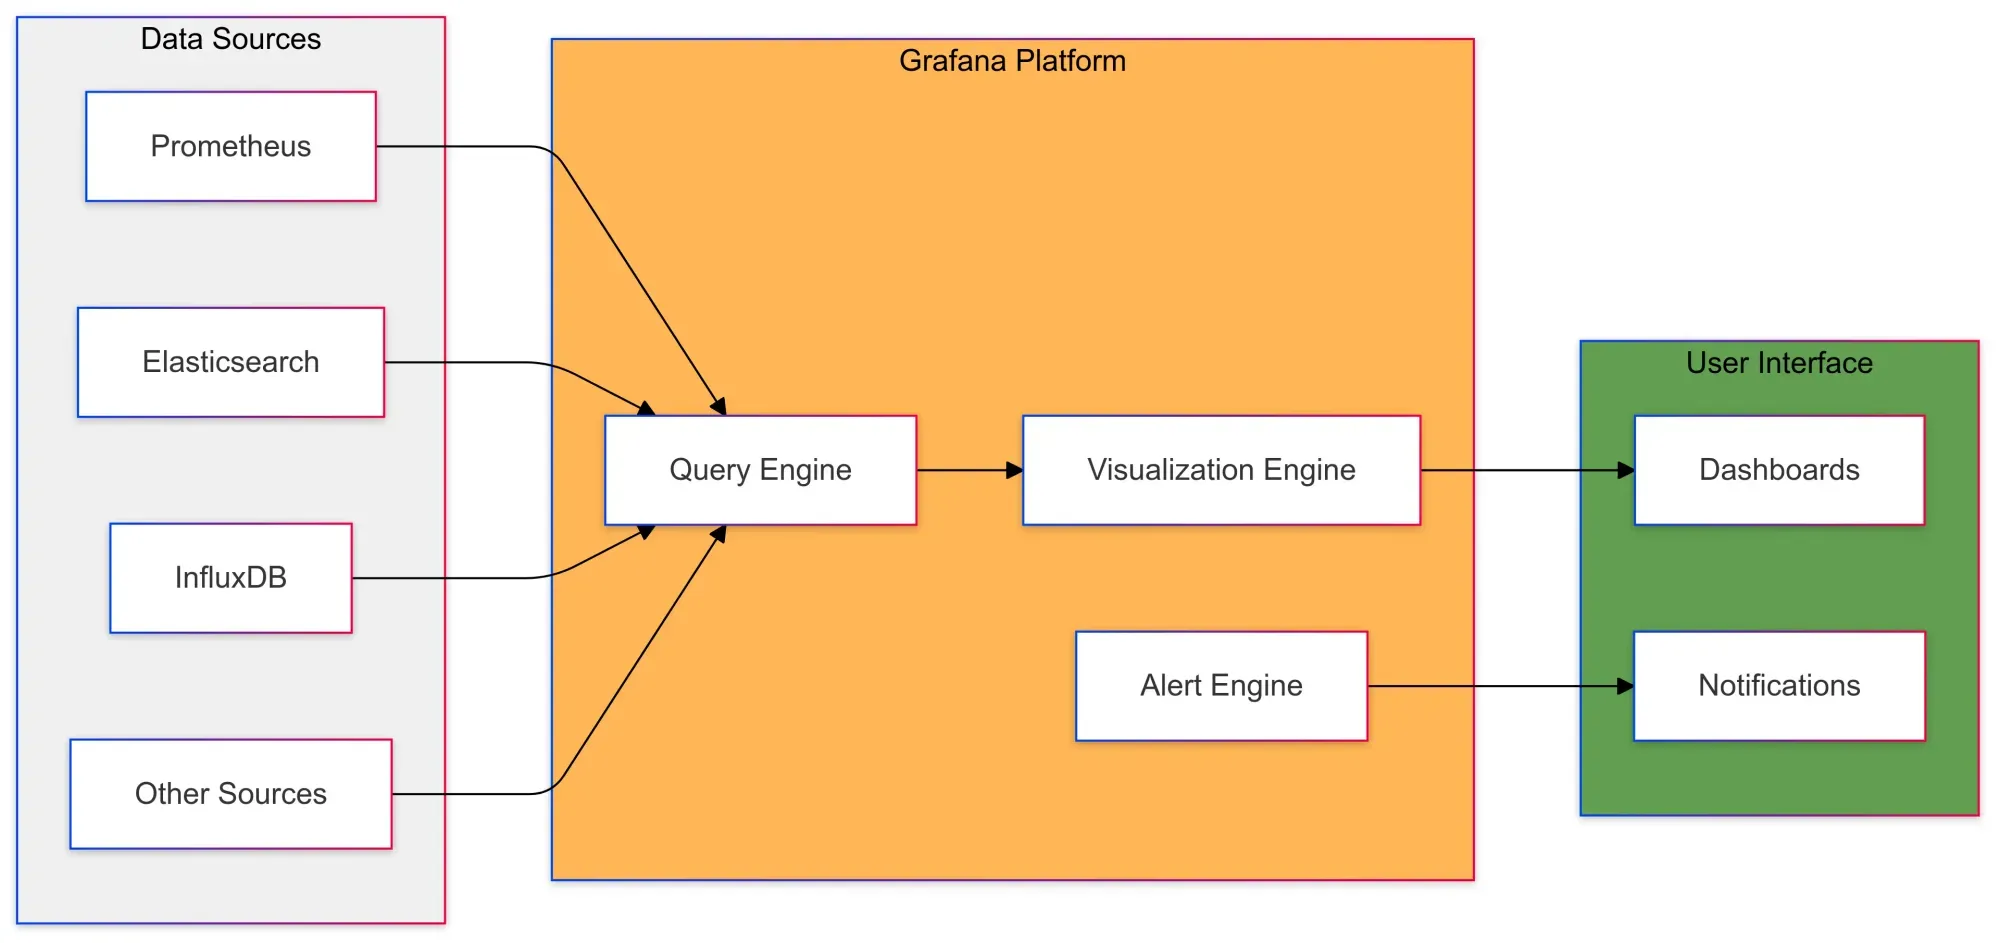
Grafana is an open-source data visualization tool that lets you display data on customizable dashboards using graphs, charts, and tables.
It’s widely used for visualizing real-time metrics, time series, and log data from sources like Prometheus, Last9, Elasticsearch, and InfluxDB.
Released in 2014, Grafana was designed to meet the need for a modern, flexible visualization tool.
Due to its ease of use, scalability, and strong community support, it has become a leading choice. Grafana also offers a plugin ecosystem to add new data sources, panels, and features, along with alerting capabilities to notify users when specific metrics cross defined thresholds.
Difference between Prometheus and Grafana
| Feature | Prometheus | Grafana |
|---|---|---|
| Purpose | Collects and stores time-series metrics data | Visualizes and analyzes data from various sources |
| Functionality | Data collection, storage, querying, alerting | Data visualization, dashboard creation, alerting |
| Scope | Monitoring system for metrics | Visualization and analysis tool for various data sources |
| Data Source | Pulls metrics from various systems and stores in a TSDB | Uses Prometheus (and other sources) to display data |
| Main Use Case | Gathering and storing system performance metrics | Creating interactive dashboards and visualizations |
Recommended reading - head over to InfluxDB vs Prometheus for a detailed comparative analysis of the two. In another blog, we are comparing all the popular time series databases. Go check them out.
Using Prometheus and Grafana
To capture and visualize metrics using Prometheus and Grafana, you must configure both tools independently and connect them afterward.
Install Prometheus
We can simply use docker and docker-compose to setup Prometheus.
We will also node exporter to emit metrics that can be scraped by Prometheus and we can visualize them and set alerts.
Node Exporter is a popular open-source software tool used for monitoring Linux and Unix systems.
Node Exporter runs on the target system that you want to monitor and collects various metrics about the system’s hardware and operating system.
It exposes these metrics in a format that Prometheus can scrape and store for further analysis and visualization.
version: "3"services: prometheus: image: prom/prometheus:v2.30.0 volumes: - ./prometheus.yml:/etc/prometheus/prometheus.yml command: - "--config.file=/etc/prometheus/prometheus.yml" ports: - 9090:9090 node-exporter: image: prom/node-exporter:v1.2.2 volumes: - /proc:/host/proc:ro - /sys:/host/sys:ro - /:/rootfs:ro command: - "--path.procfs=/host/proc" - "--path.sysfs=/host/sys" - "--path.rootfs=/rootfs" - "--collector.filesystem.ignored-mount-points=^/(sys|proc|dev|host|etc)($$|/)" ports: - 9100:9100Configure Prometheus
You can configure Prometheus by defining the target endpoints in the prometheus.yml configuration file. This allows Prometheus to scrape metric values from these endpoints.
Add a Target
Add this snippet to the prometheus.yml configuration file:
global:  scrape_interval: 15s  evaluation_interval: 15s
scrape_configs:  - job_name: "node"    static_configs:      - targets: ["node-exporter:9100"]
After creating these files, run docker-compose up -d to start the services.
Once everything is set up, you can access the Prometheus web UI by navigating to http://localhost:9090. There, you can enter expressions into the expression bar and click Execute to evaluate them. The results are shown in the graph panel.
The Node Exporter provides a wide variety of system metrics, such as CPU usage, memory, disk I/O, network, etc. For example, you can enter the expression node_memory_MemAvailable_bytes in the Prometheus web UI to view the available memory on your system.
Define Alert Rules
Prometheus allows users to define alert rules to alert them when monitored metrics cross defined thresholds. Consider this threshold rule configuration:
groups: - name: example rules: - alert: HighCpuLoad expr: 100 - (avg by(instance) (irate(node_cpu_seconds_total{job="node",mode="idle"}[5m])) * 100) > 85 for: 2m labels: severity: warning annotations: summary: "High CPU load detected" description: "CPU load is > 85% for 2 minutes" - alert: HighMemoryUsage expr: (node_memory_MemTotal_bytes - node_memory_MemAvailable_bytes) / node_memory_MemTotal_bytes * 100 > 80 for: 2m labels: severity: warning annotations: summary: "High memory usage detected" description: "Memory usage is > 80% for 2 minutes"This file defines two alert rules: one that triggers when CPU usage is above 85% and another one when memory usage is above 80%.
See the metrics in the Prometheus UI.
To visualize a graph of collected metrics in the Prometheus web interface, open http://localhost:9090 in a web browser. Run this query to get the memory usage percentage.
(node_memory_MemTotal_bytes - node_memory_MemAvailable_bytes) / node_memory_MemTotal_bytes * 100Complete Prometheus Configuration
global:  scrape_interval: 15s  evaluation_interval: 15s
rule_files:  - "alert.rules.yml"
scrape_configs:  - job_name: "node"    static_configs:      - targets: ["node-exporter:9100"]
Grafana
Grafana is an open-source data visualization and analysis software that provides real-time analytics, visualizations, and alerts. It supports the visualization of metrics data from Prometheus.
Getting started with Grafana and Prometheus
To create a series of dashboards in Grafana to display system metrics for a server monitored by Prometheus, follow these steps.
We already have Prometheus running with node exporter exposing metrics on localhost:9100
Configure Prometheus for Grafana
There are two methods to configure Prometheus for Grafana; using a hosted Grafana instance at Grafana Cloud, or running Grafana locally.
Last9 is a managed observability platform compatible with Prometheus and OpenTelemetry — ingest metrics via remote_write or native OTel, with built-in Grafana dashboards included. No separate Grafana install or license needed. Try Last9 free.
Install Grafana via Grafana Cloud
1. Sign up for Grafana here.
2. Remote write your metrics to the Grafana.com Prometheus instance
3. Add the following code to your prometheus.yml file to begin sending metrics to your hosted Grafana instance:
remote_write:- url: <https://your-remote-write-endpoint> basic_auth: username: <your user name> password: <Your Grafana.com API Key>Install Grafana using Docker
1. Download Grafana using docker-compose.
version: '3'services: ... grafana: image: grafana/grafana:latest ports: - 3000:3000Run docker-compose up -d to start Grafana.
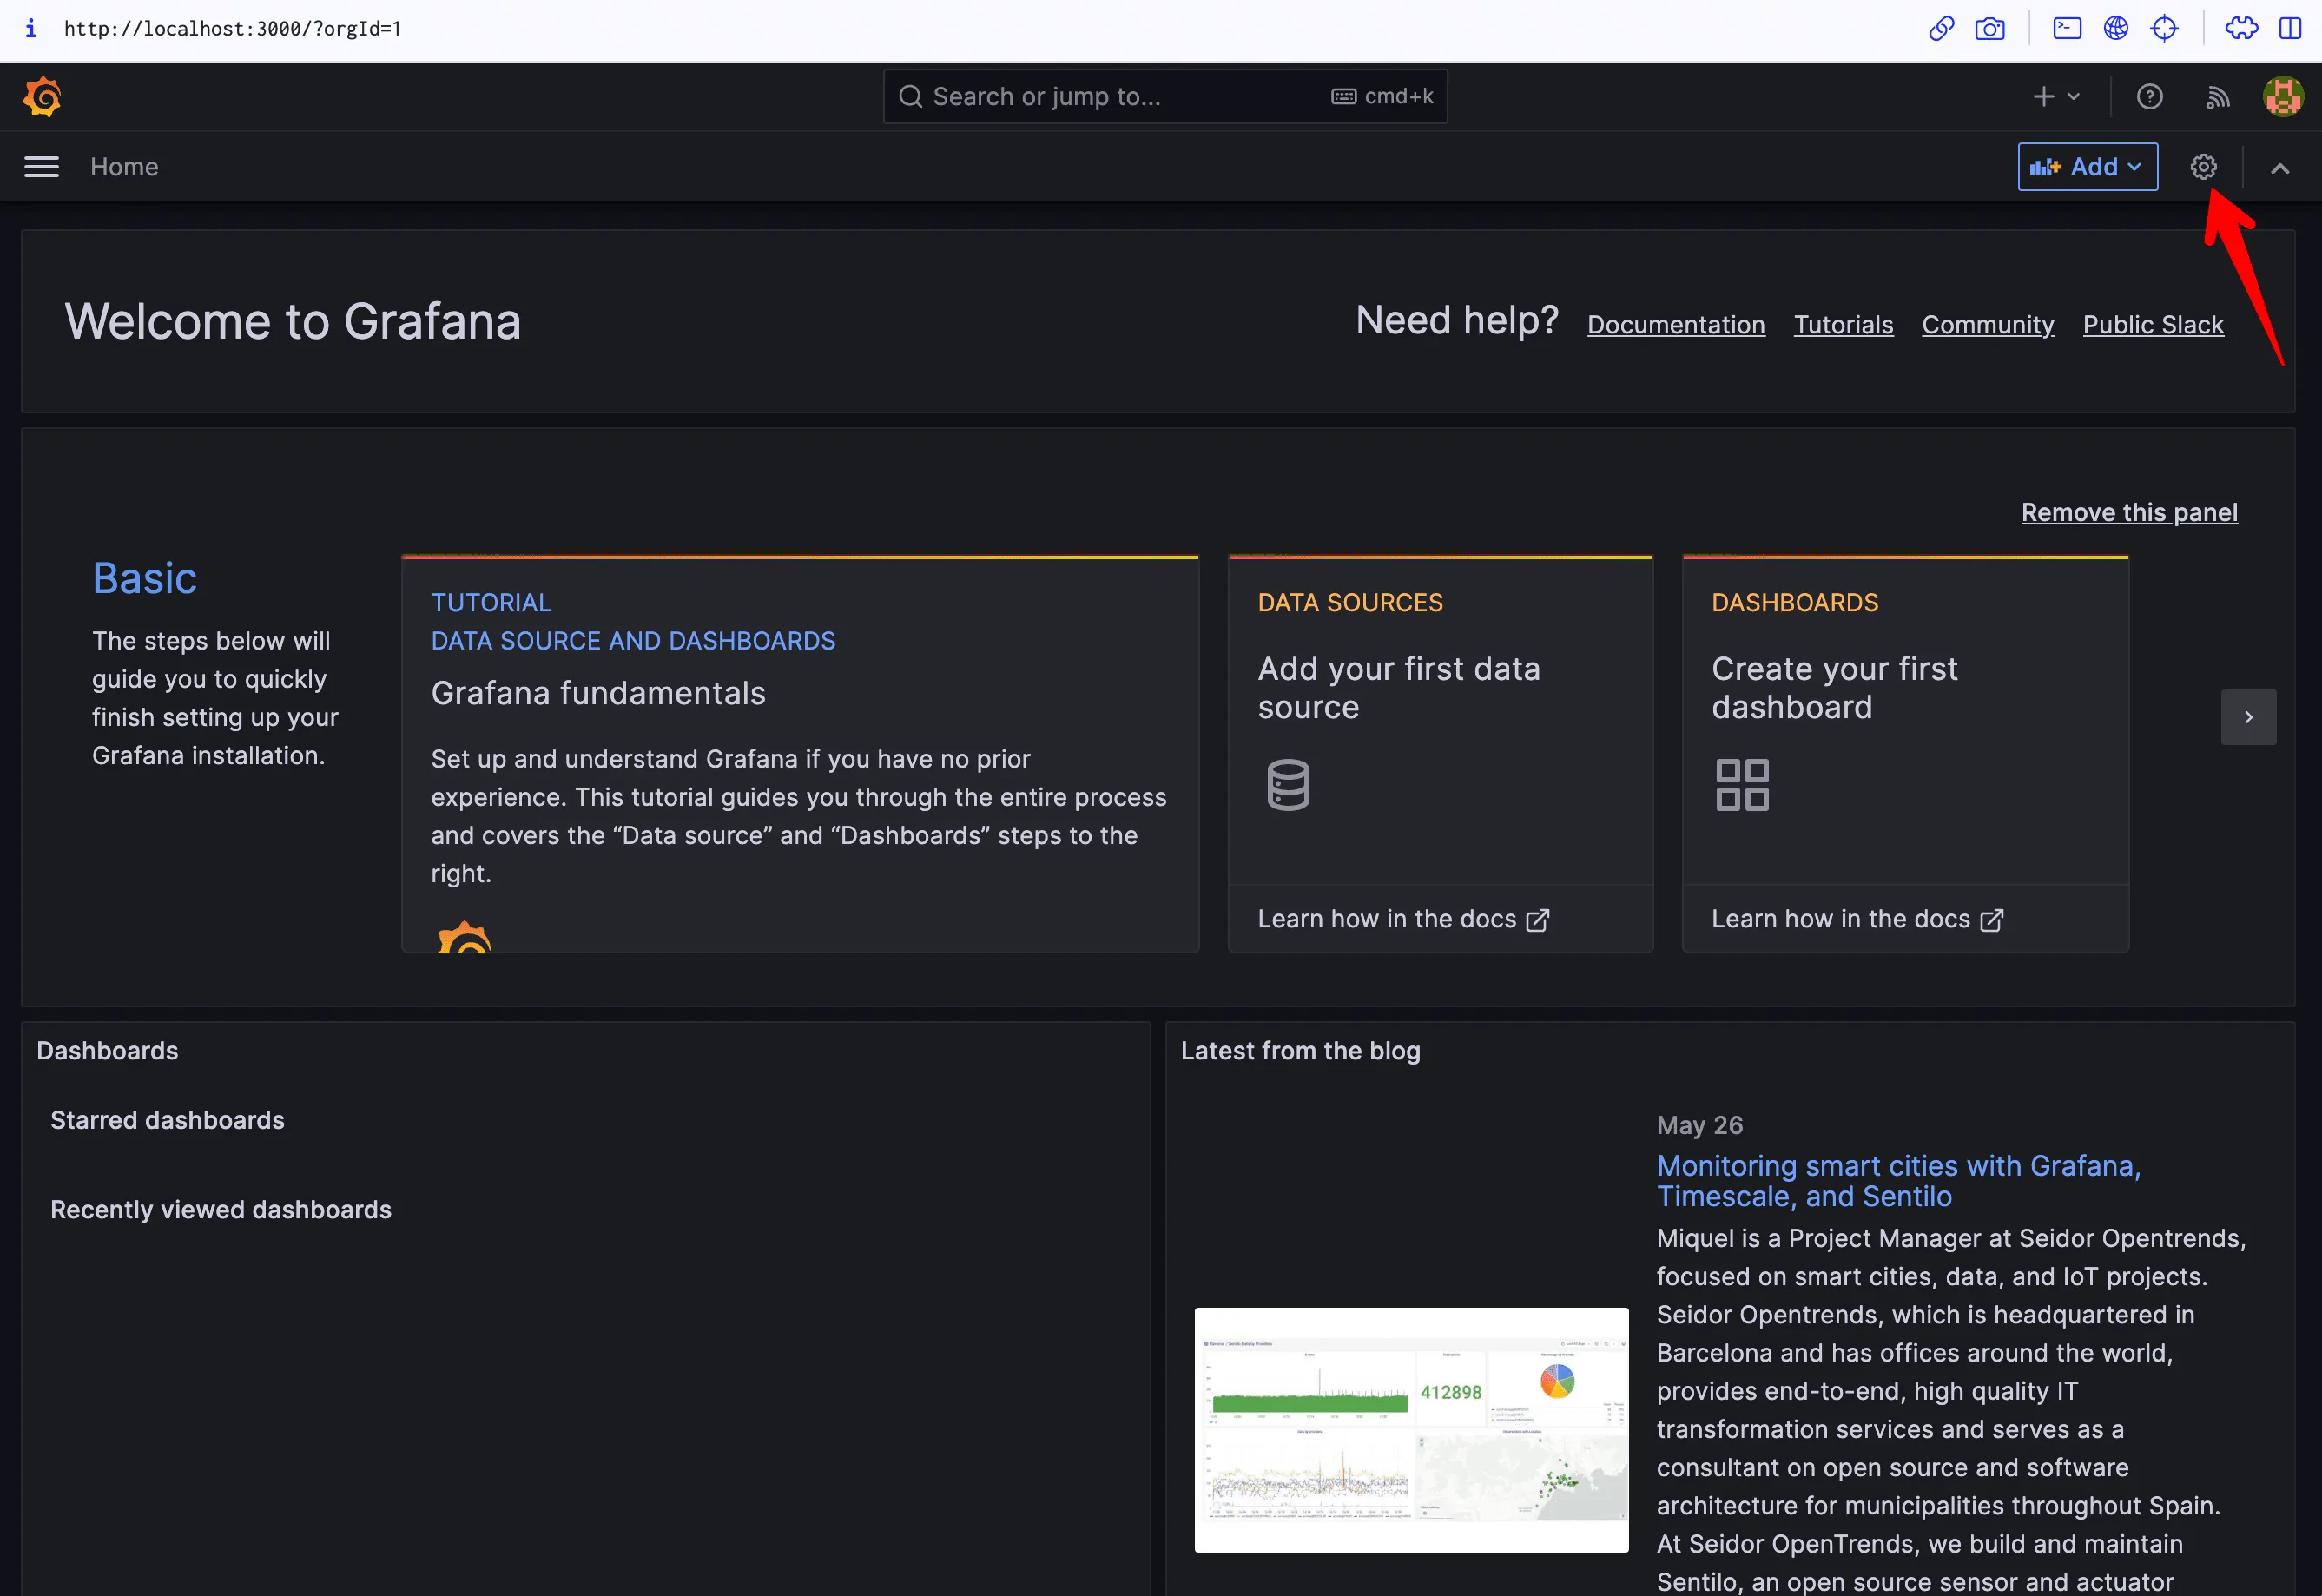
2. Open Grafana by going to http://localhost:3000 in your web browser.
3. Login with the default username (admin) and password (admin).
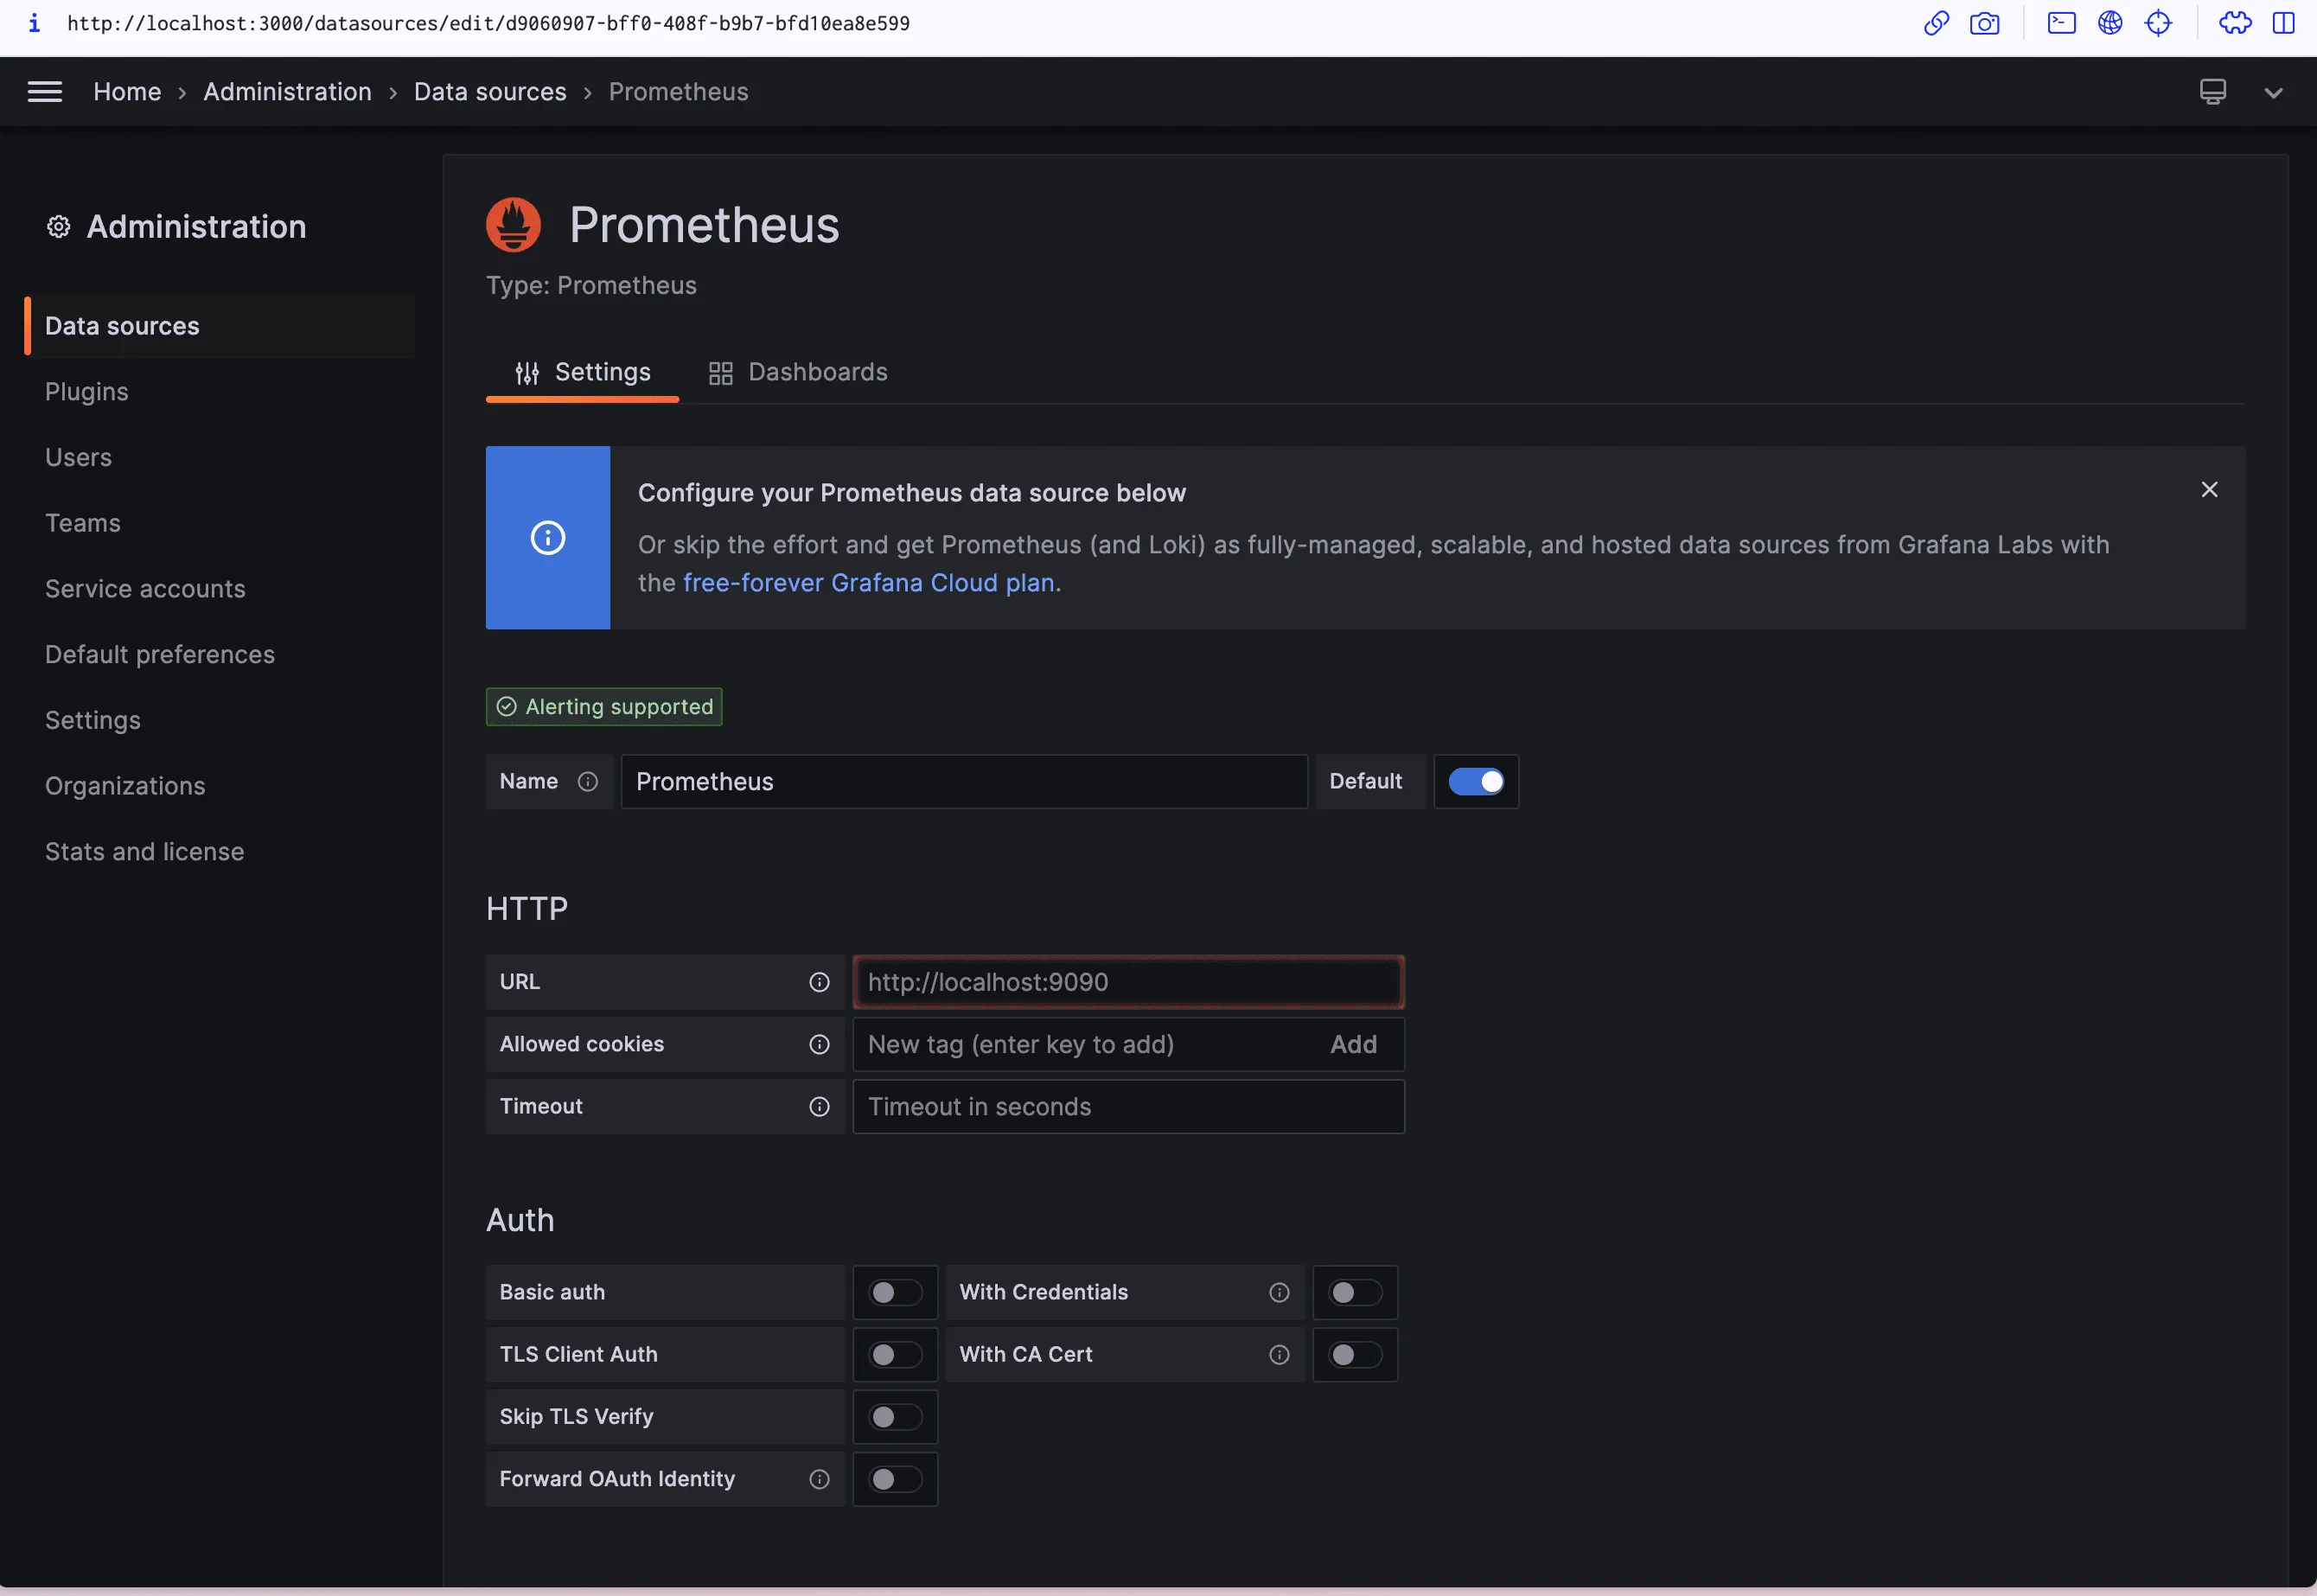
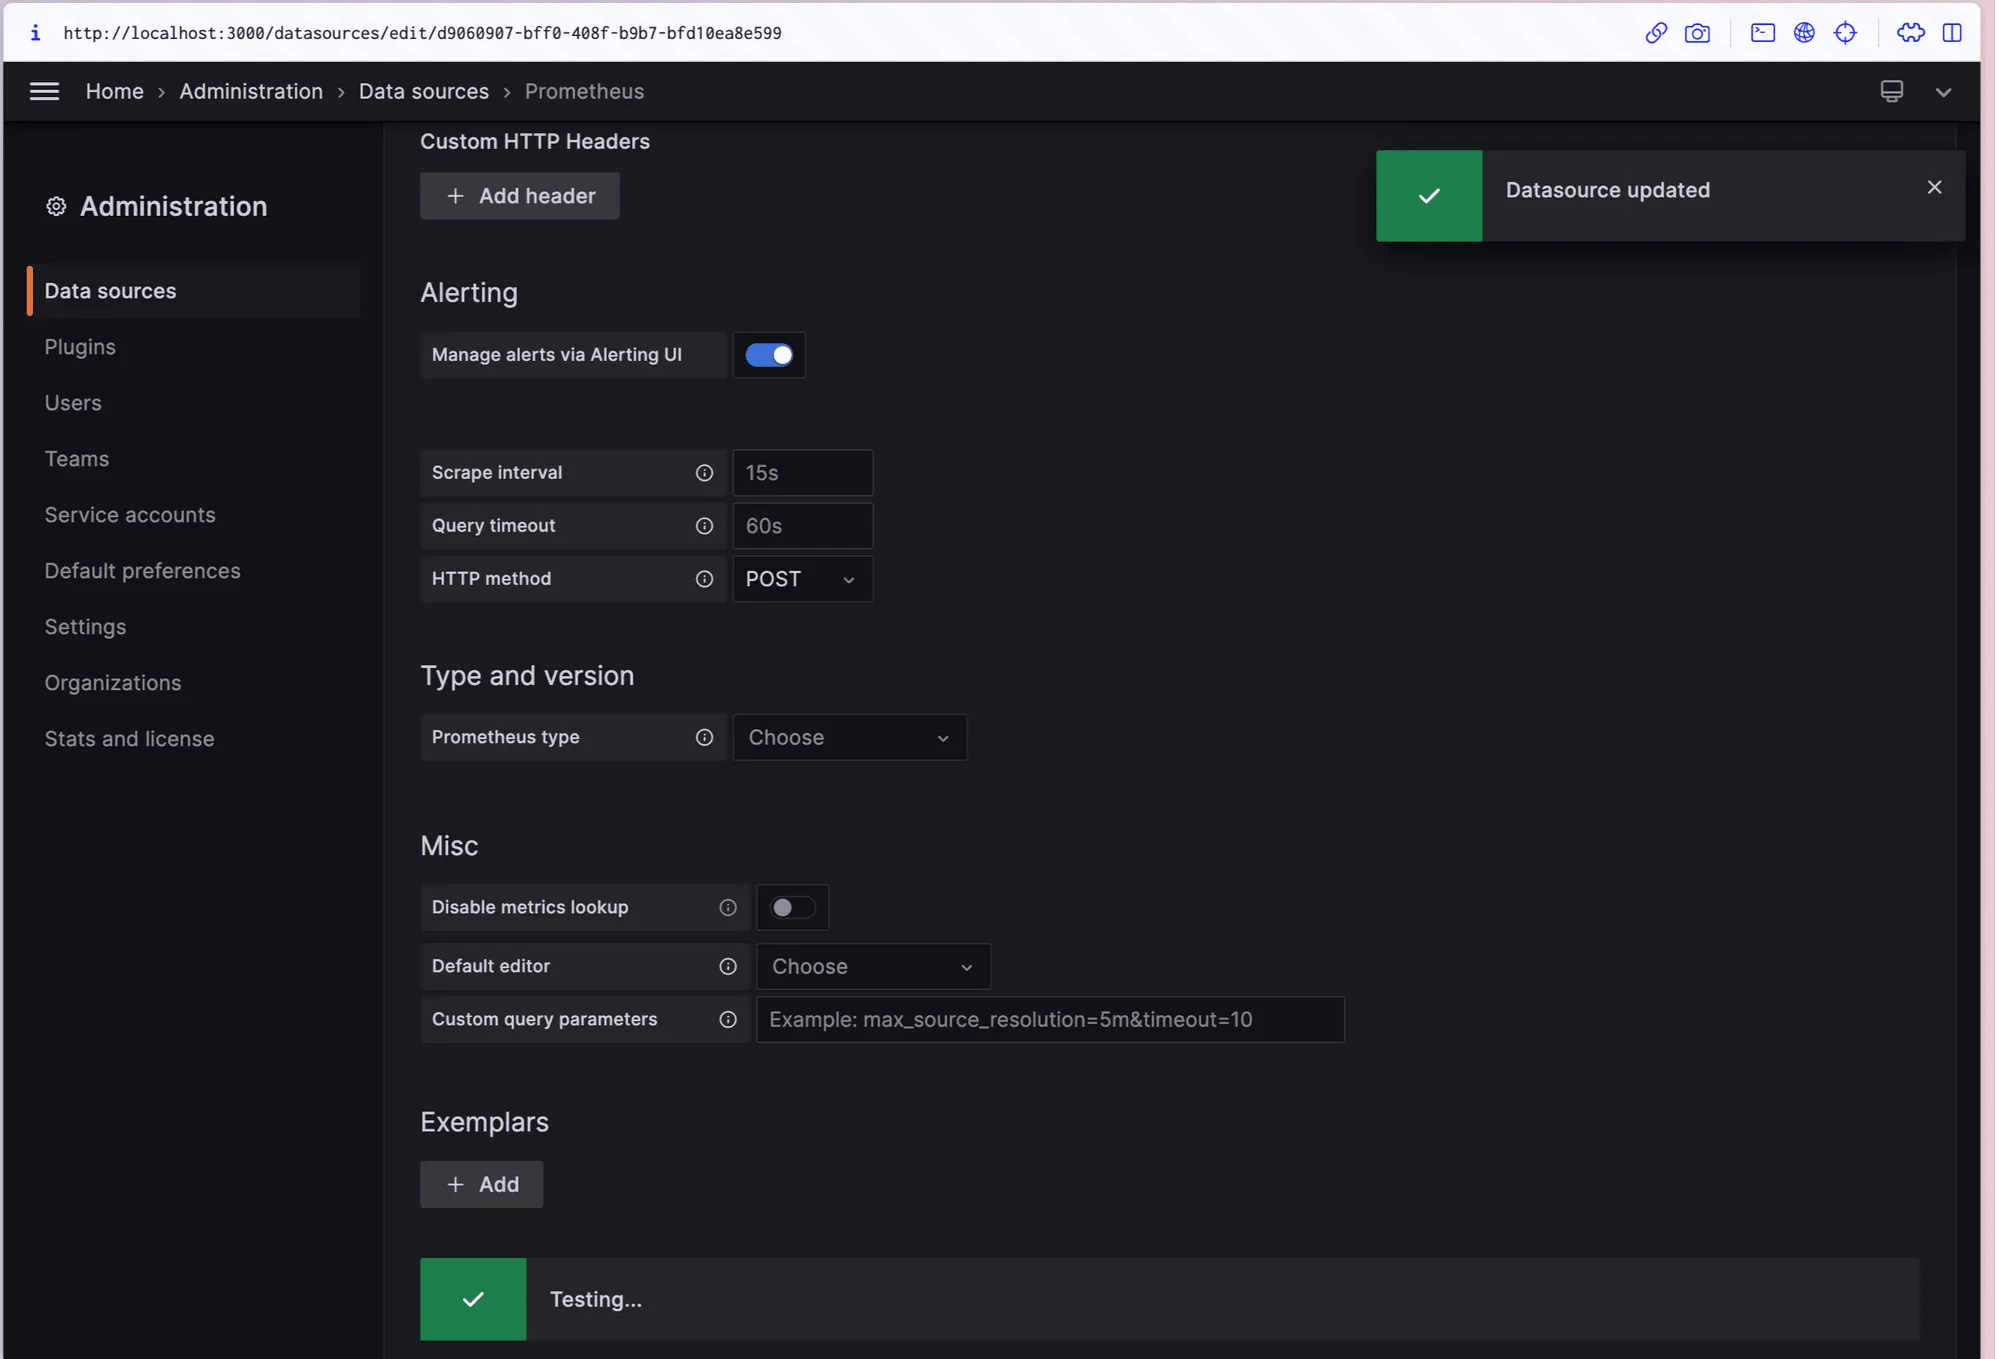
4. Add a data source:
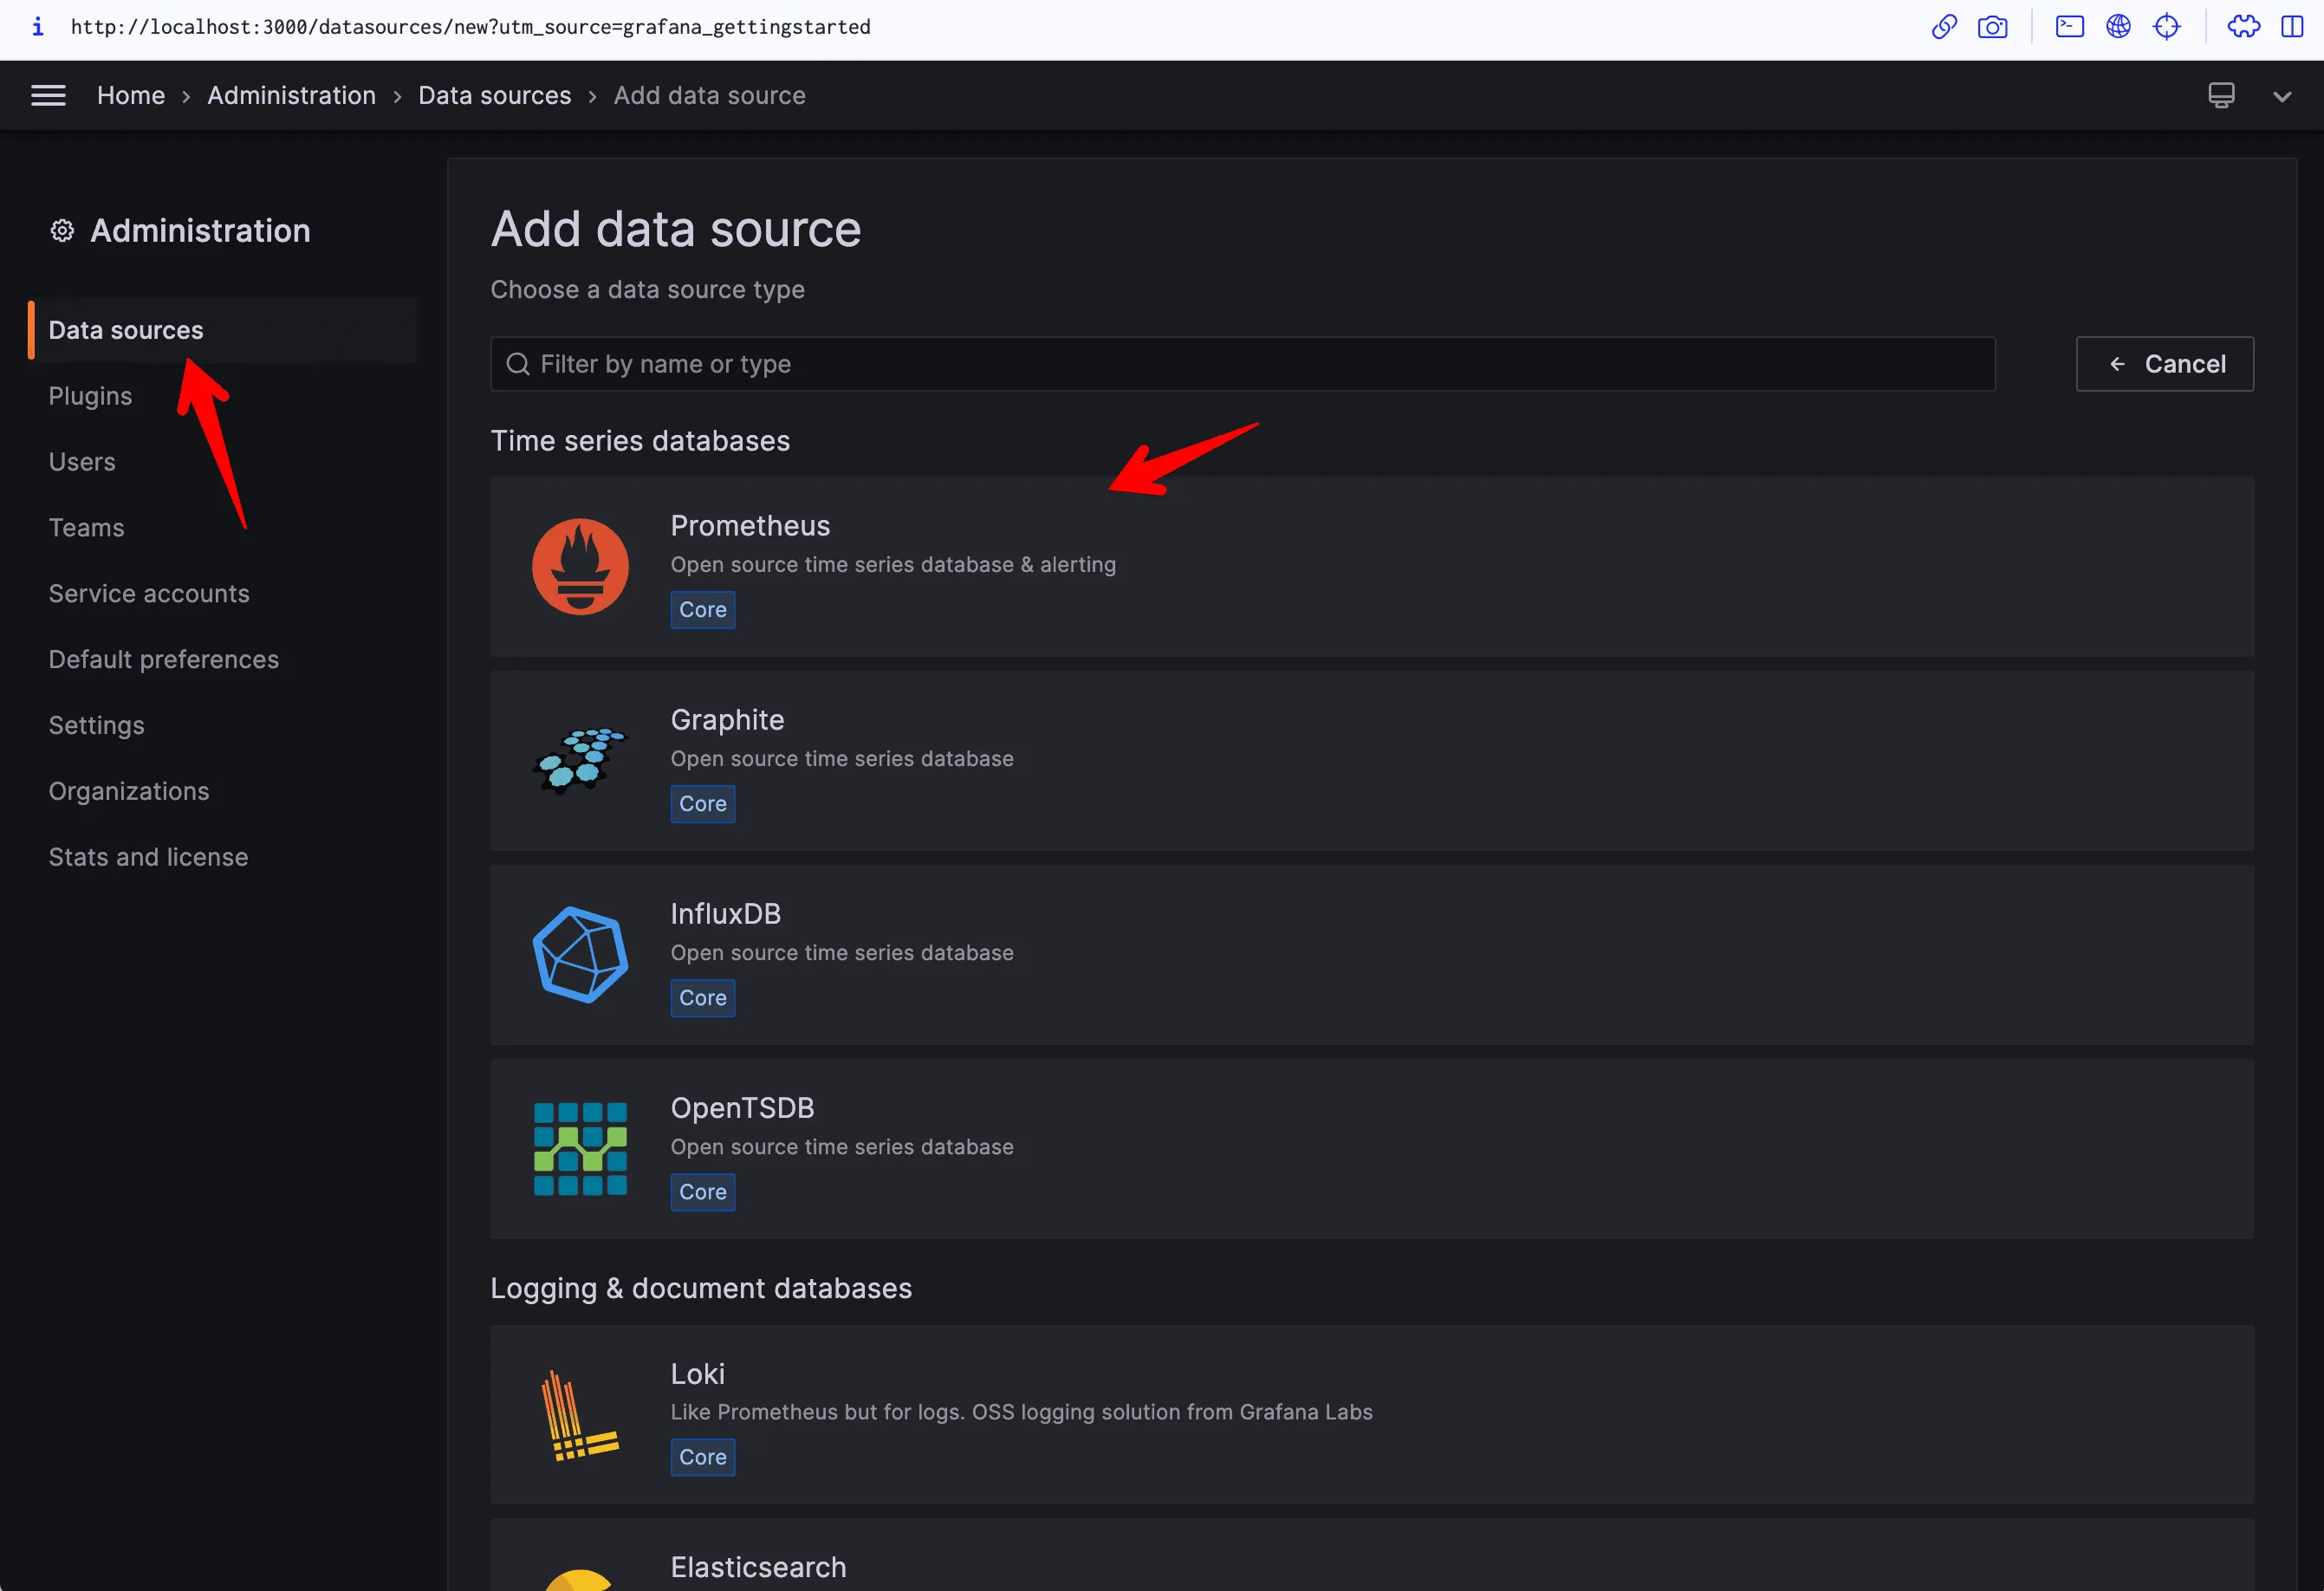
- Click on the Grafana icon in the top left corner, click on “Configuration” and then “Data Sources”.
- Click on “Add data source”, and select Prometheus as the type.
- Enter the URL of the Prometheus server. If you’re running it locally on Docker, it would be
http://prometheus:9090. - Click “Save & Test”.
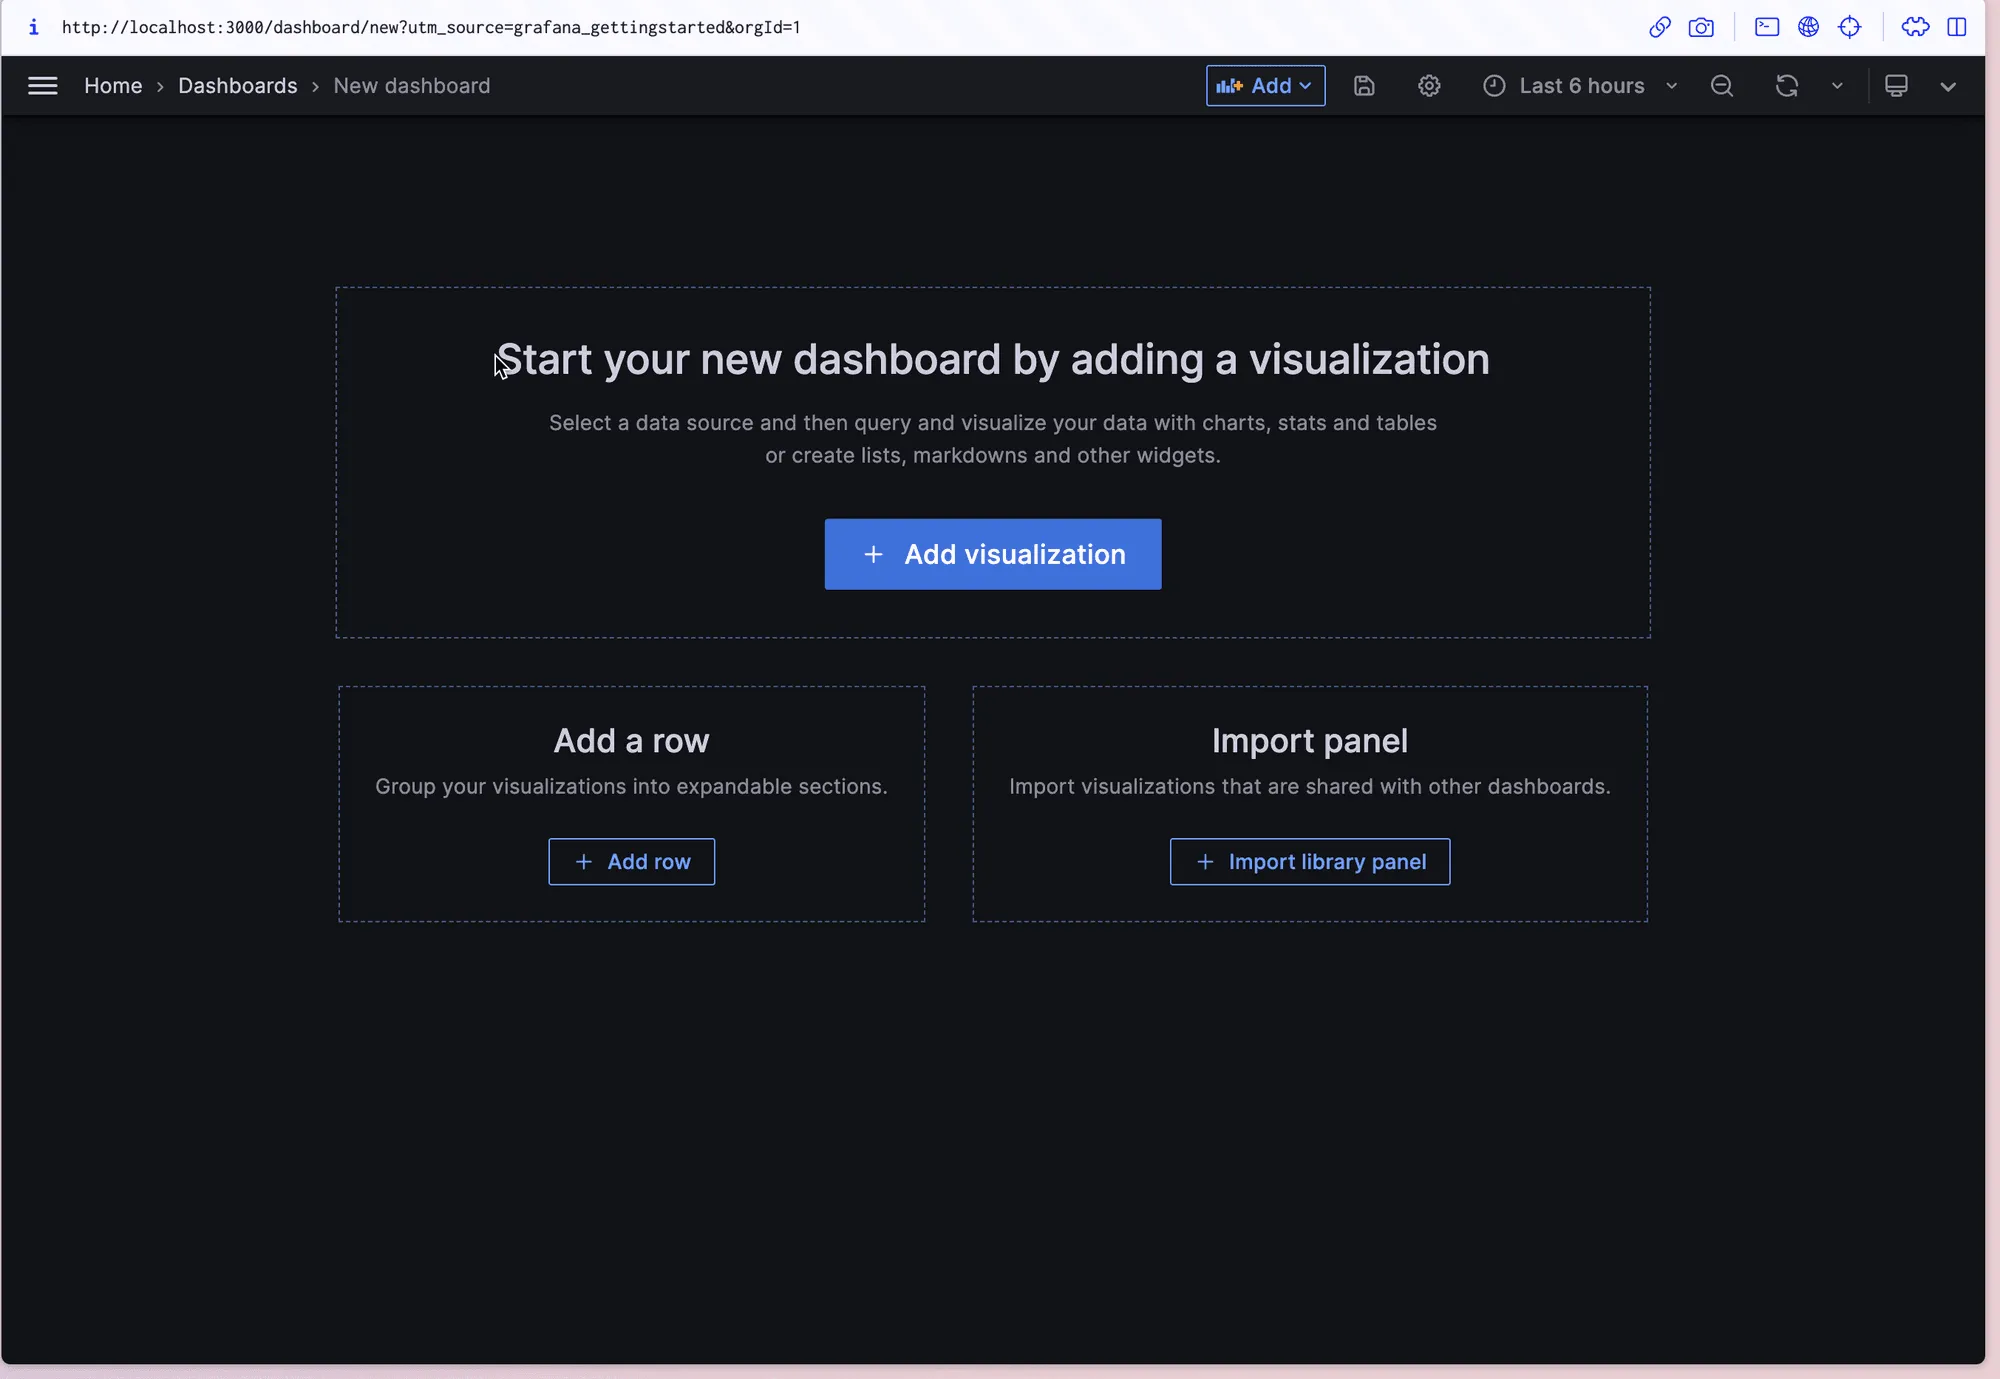
5. Create a dashboard:
- Click on the Grafana icon in the top left corner, click on “Create” and then “Dashboard”.
- Click on “Add new panel”.
- In the query field, enter a Prometheus expression, such as
100 - (avg by(instance) (irate(node_cpu_seconds_total{job="node",mode="idle"}[5m])) * 100), which corresponds to the CPU usage. - Adjust the graph settings as desired.
- Click on “Apply”.
6. Repeat step 5 for each metric you want to add to the dashboard.
Prometheus Metrics in Grafana
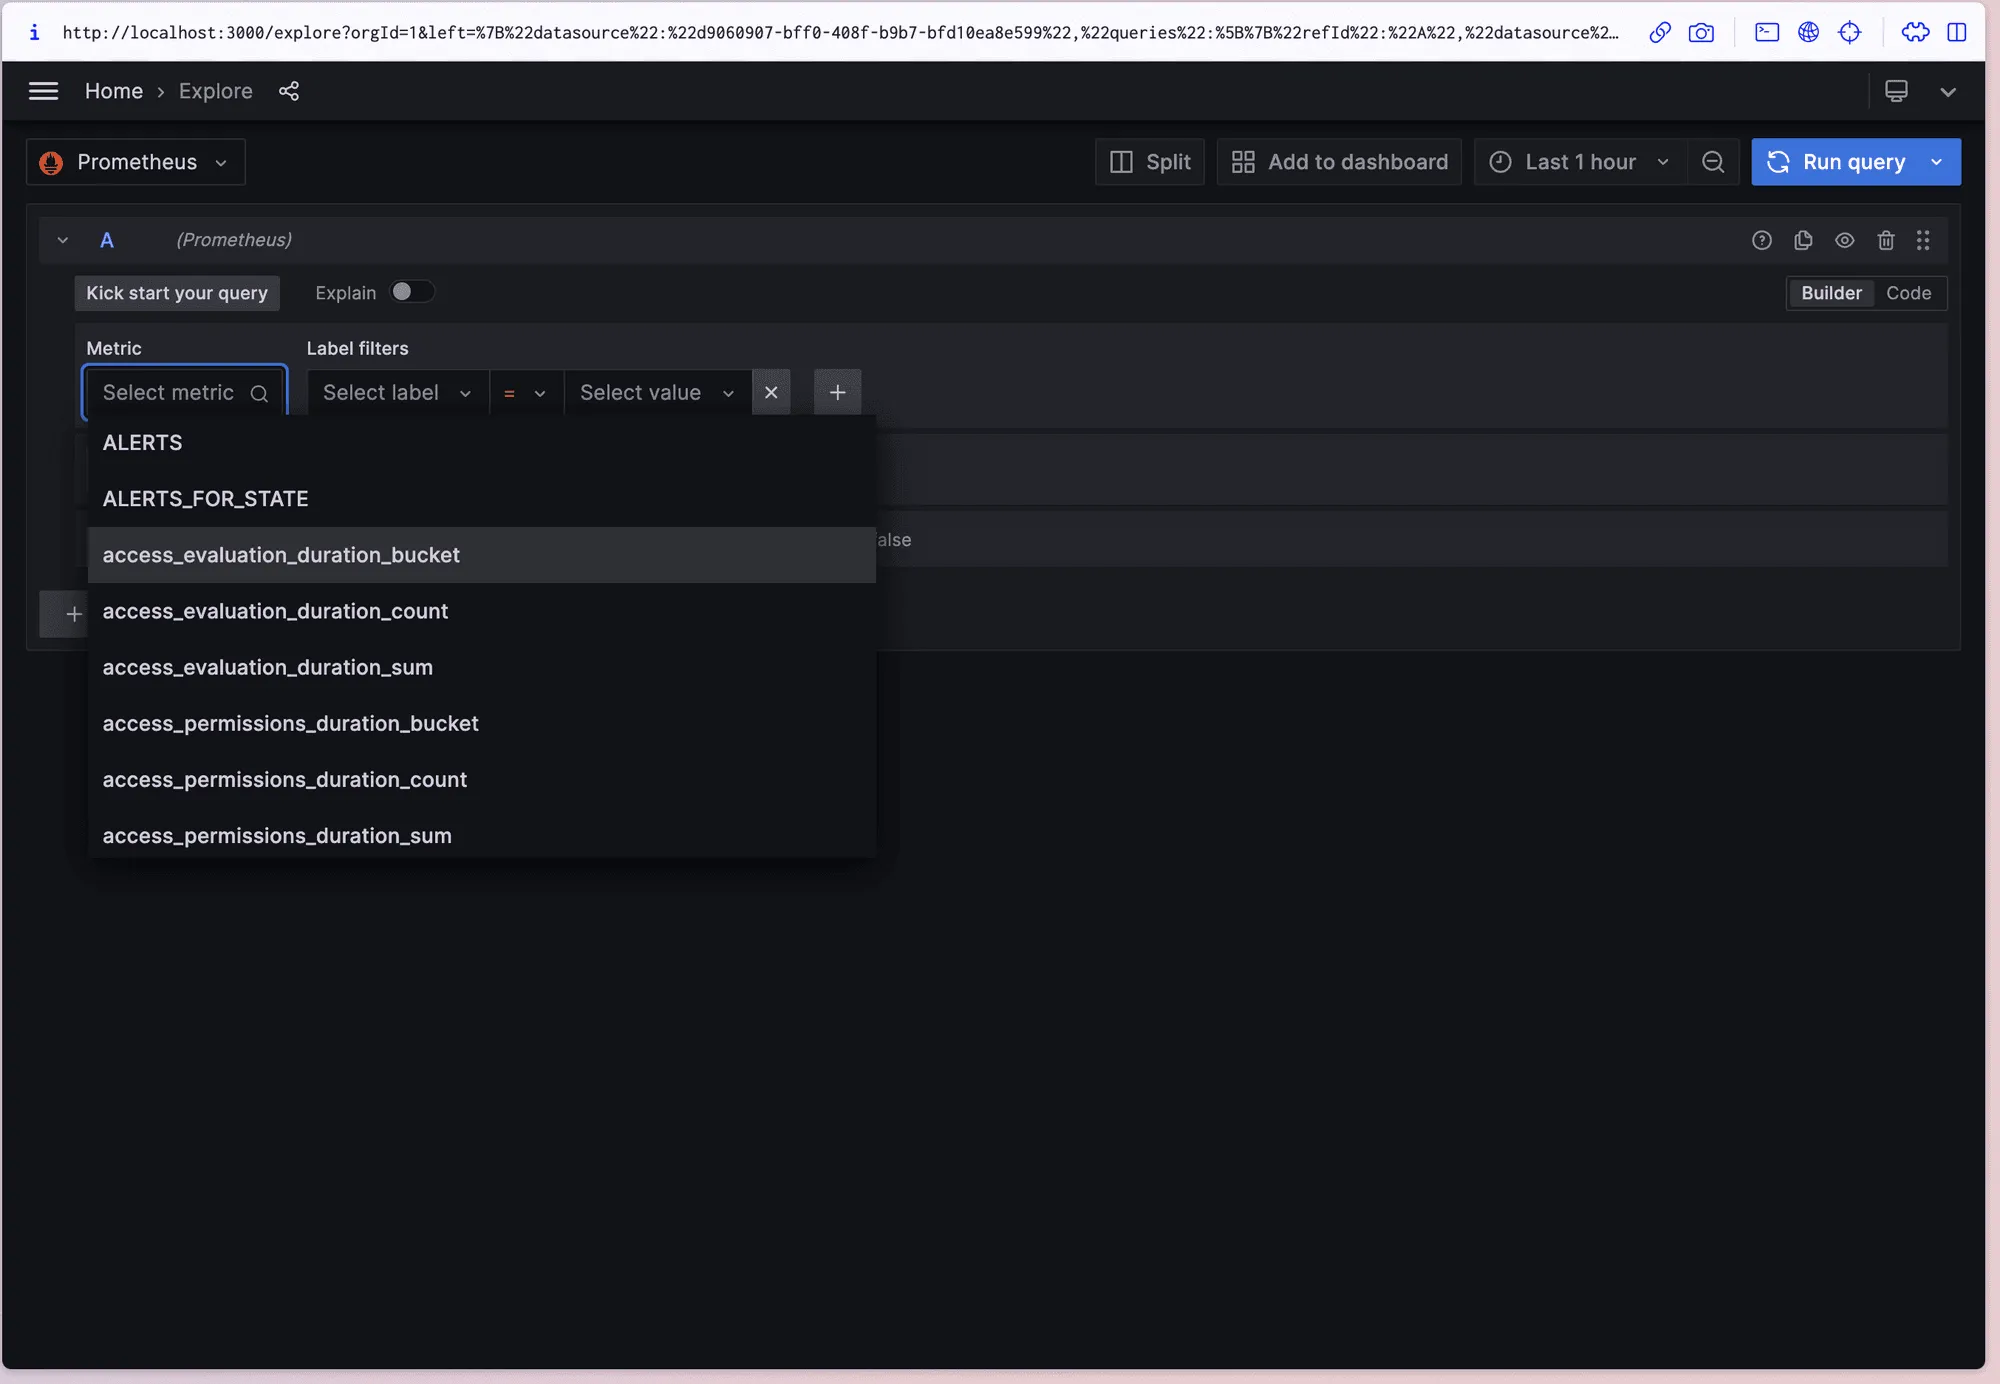
In your Grafana instance, go to the Explore view and build queries to experiment with the metrics you want to monitor.
Use the Prometheus-specific query builder to write and test PromQL expressions directly in Grafana’s Explore view.
Create dashboards to render system metrics monitored by Prometheus.
Grafana dashboards can also be represented as JSON models.
- If you want to share a dashboard, you can click on “Share dashboard” and then “Export for sharing externally” to get the JSON model.
- To import a dashboard, you can paste the JSON model into the “Import” field.
Grafana Support for Prometheus
Grafana has strong support for Prometheus, with the Grafana data source for Prometheus included since version 2.5.0 back in 2015. Here are some key ways Grafana makes working with Prometheus easier:
- Easy Integration: Grafana makes connecting to Prometheus simple, easing the setup for developers and teams.
- Simple Query Builder: It offers an easy-to-use query builder that helps users create complex queries for Prometheus data without hassle.
- Multi-Tenancy Support: Grafana allows you to create separate dashboards for different users or teams, making it easy to share Prometheus metrics while keeping things organized.
- Rich Visualization Options: Grafana offers a variety of ways to visualize Prometheus metrics, from graphs and tables to heat maps and logs—giving you flexibility in how you present your data.
Conclusion
Prometheus and Grafana solve different parts of the monitoring problem: Prometheus handles metric collection, storage, and alerting; Grafana handles display and exploration. Set them up once with the docker-compose config above and you have a working monitoring baseline for any service.
If you’d rather skip the self-hosted overhead, Last9 gives you Prometheus-compatible metrics storage and built-in Grafana dashboards in one managed platform.
FAQs
What is Prometheus?
Prometheus is an open-source monitoring system designed to collect and store time-series metrics data from various systems, applications, and hardware. It uses its own query language (PromQL) and provides alerting functions for proactive system monitoring.
What is Grafana?
Grafana is an open-source data visualization tool that allows you to create customizable dashboards to visualize data from different sources, including Prometheus. It offers various visualization options like graphs, tables, and heatmaps.
How do Prometheus and Grafana work together?
Prometheus collects and stores time-series data, while Grafana uses that data to create interactive dashboards and visualizations. Prometheus handles the data collection and querying, and Grafana displays the data in an easy-to-understand format.
Can Grafana connect to sources other than Prometheus?
Yes, Grafana supports multiple data sources, including Prometheus, InfluxDB, Elasticsearch, and others. You can integrate various systems into Grafana for a unified dashboard.
What is PromQL?
PromQL is Prometheus’s query language, used to extract and manipulate data stored in Prometheus. See our PromQL cheat sheet for common queries. It allows you to perform complex queries on time-series metrics, making it a powerful tool for monitoring and analysis.
How do I set up Prometheus with Grafana?
Setting up Prometheus with Grafana involves configuring Prometheus to collect metrics and adding Prometheus as a data source in Grafana. Once connected, you can create custom dashboards to visualize your metrics.
Does Grafana support alerting with Prometheus?
Yes, Grafana supports alerting with Prometheus. You can set up alerts based on Prometheus metrics, allowing you to monitor and react to any changes in your systems live.
Is Grafana free to use?
Yes, Grafana is open-source and free to use. It also offers enterprise versions with additional features and support for large-scale environments.

