

Prometheus works well for day-to-day monitoring. Dashboards load quickly, alerts fire on time, and your team depends on those metrics for routine checks and debugging.
Then you run into a familiar limitation: you need data from a few months back, but your Prometheus instance only stores a short window. Or you’re running Prometheus in many clusters, and jumping between them slows down investigations. Or someone asks for long-term comparisons, and you realize the older data isn’t available anymore.
Remote Write solves this by sending metrics to a long-term database as they’re scraped. Nothing changes in how Prometheus collects data — you simply add a destination where those metrics can live for much longer.
In this guide, we’ll walk through how to set up Remote Write, tune it for production traffic, and handle common issues. Whether you manage one Prometheus instance or a large fleet, this will help you build a setup that’s stable and easy to operate.
If you are new to the world of Prometheus and Metrics, do check our blog ⏤ What is Prometheus?
Quick Start: Get Running in 5 Minutes
Before we get into tuning or design choices, here’s the fastest way to bring Remote Write online. This is useful when you need Prometheus to ship metrics to long-term storage without thinking through every detail yet.
Add this block to your prometheus.yml:
remote_write:  - url: https://your-remote-storage/api/v1/write
    # Keep credentials in files    basic_auth:      username: prometheus      password_file: /etc/prometheus/secrets/password
    # Queue settings that work well for most production setups    queue_config:      capacity: 10000      max_samples_per_send: 2000      max_shards: 200      batch_send_deadline: 5s
    # Drop low-value metrics    write_relabel_configs:      - source_labels: [__name__]        regex: "go_gc_.*"        action: drop
Swap the URL with the endpoint from your backend (Thanos, Cortex, Levitate, Mimir, or any OTLP/Prometheus-compatible store).
Once you restart Prometheus, check if samples are being sent:
curl http://localhost:9090/metrics | grep prometheus_remote_storage_succeeded_samples_totalIf this number moves up, Remote Write is active.
Now we can look at what each part of this configuration actually does and how to adjust it for your setup.
How Remote Write Works
Remote Write doesn’t change how Prometheus scrapes or stores data locally. It adds a second path that ships those same samples to long-term storage. Under the hood, Prometheus does a few things in order:
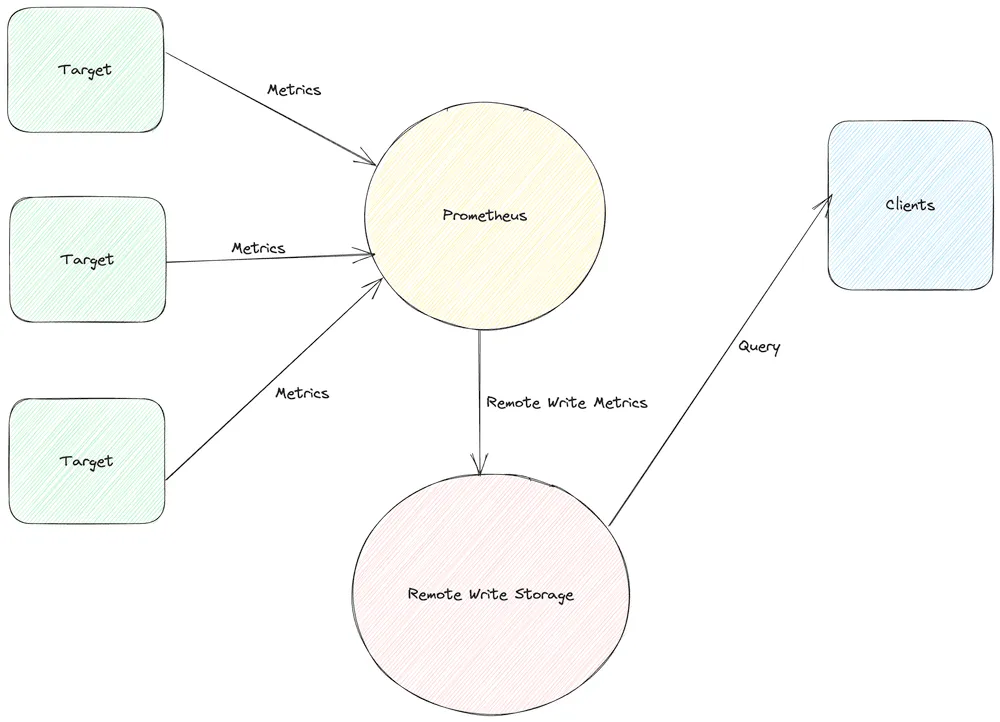
- Scrapes your targets the same way it always has.
- Stores each sample in the local Write-Ahead Log (WAL).
- Reads new entries from the WAL and groups them into batches.
- Pushes those batches to the remote endpoint over HTTP.
You can picture the flow like this:
Your Apps → Prometheus → Local Storage (~15 days) ↓ WAL → Queue → HTTP POST → Remote Storage (long retention)A useful detail: if the remote endpoint becomes unreachable, Prometheus doesn’t drop samples immediately. It continues to buffer data in the WAL for roughly two hours. When the backend is healthy again, Prometheus drains the backlog and sends everything it has stored. Only outages longer than the WAL buffer window put data at risk.
The payload sent to the remote system is encoded with Protocol Buffers and compressed with Snappy. Prometheus takes care of these details on its own — you only need to specify where the data should go.
Why Remote Write Becomes Necessary
Prometheus works well for short-term metrics, but several practical situations make external storage important.
Long-Term Retention Requirements
Prometheus keeps recent data and is optimized for short windows. Even with higher retention settings, disk growth and slower queries show up quickly.
Teams that maintain historical data for audits, planning, or comparison across quarters usually outgrow local retention.
Remote Write sends samples to a backend that’s designed to hold months or years of data while Prometheus continues to operate with a smaller, faster dataset.
Multiple Prometheus Deployments
Larger environments tend to run many Prometheus servers—one per cluster, region, or team. This leads to scattered dashboards, isolated datasets, and queries that can’t span instances.
Shipping metrics from each Prometheus to a shared backend gives a single place to explore data across all clusters without merging instances or rewriting setups.
Metric Data as a Recoverable Asset
Prometheus stores everything locally on disk. A node failure, disk loss, or accidental deletion removes all stored metrics.
For teams that rely on historical data—incident analysis, SLA validation, debugging long-running issues—this is a real gap.
Remote Write provides a second, durable copy of all samples so that data survives beyond the lifecycle of any Prometheus instance.
Scaling Limits
As active series counts rise, Prometheus eventually hits performance pressure: slower queries, higher memory usage, and increased disk I/O.
A common pattern is to let Prometheus keep only recent data—where fast lookups are important—and move older samples to a backend built to scale horizontally.
Remote Write makes this pattern straightforward without rearchitecting the entire monitoring setup.
The complete list of remote write configuration options can be found here.
What to Expect When Remote Write Is Enabled
Enabling Remote Write adds a few predictable changes to Prometheus’ resource usage and data flow. These are the main ones to be aware of.
Memory Usage Increases
Remote Write keeps additional data in memory:
- series metadata for label lookups
- queues that hold samples before they are sent
In most setups, memory use rises by around 20–30%.
For an instance that typically runs at ~2 GB, usage often moves toward ~2.5 GB.
Queue memory can be estimated with:
Memory = max_shards × (capacity + max_samples_per_send)Example configuration:
max_shards: 200capacity: 10000max_samples_per_send: 2000
→ 200 × 12000 = 2.4 million samples→ ~400–500 MB (at ~2 bytes/sample)
Helpful metrics:
prometheus_remote_storage_samples_pendingprometheus_remote_storage_queue_sizeWAL Buffer Behavior
Remote Write reads samples from the WAL.
Prometheus keeps roughly two hours of WAL segments, so this becomes the buffer window.
- short backend outages are covered by the WAL
- once the backend responds again, Prometheus sends the queued data
- data older than the WAL retention window is not available for resend
Some environments use multiple Remote Write endpoints to reduce the chance of gaps.
Increased Network Egress
Remote Write sends outgoing samples as protobuf messages compressed with Snappy.
Example workload:
1000 targets× 100 series each → 100,000 seriesScrape interval: 30s → ~3,333 samples/secondThis typically produces around 5–10 MB per minute of outgoing traffic per Prometheus instance.
Large deployments—multiple Prometheus servers or cross-region setups—see this traffic accumulate, which may matter for egress budgets or bandwidth limits.
Also, checkout our Prometheus Remote Write Optimizations guide!
Common Remote Write Configurations
Remote Write can be set up in several patterns depending on how metrics need to be routed or stored. Below are the configurations commonly used in real deployments.
Sending Metrics to a Single Storage Backend
A minimal setup that forwards all samples to one remote system:
remote_write:  - url: https://your-storage.example.com/api/v1/write
    basic_auth:      username: prometheus      password_file: /etc/prometheus/secrets/password
Useful when one backend handles all long-term retention.
Forwarding Metrics to More Than One Destination
Prometheus can push the same data to multiple endpoints. This helps when different storage tiers or failover setups are involved.
Examples include:
- primary storage plus a secondary copy
- warm storage plus archive storage
- separate systems for operations, analytics, or compliance
remote_write:  - url: https://primary-storage/api/v1/write    name: primary    queue_config:      capacity: 10000      max_samples_per_send: 2000
  - url: https://backup-storage/api/v1/write    name: backup    queue_config:      capacity: 5000      max_samples_per_send: 1000
Each destination runs its own queue and error handling.
Adding Labels to Identify the Source
When several Prometheus servers push into the same backend, external labels help identify where each sample originated.
global: external_labels: cluster: production-us-east environment: production datacenter: us-east-1aExample queries:
# Metrics from one clusterup{cluster="production-us-east"}
# Combined view across all clusterssum by (job) (up)
Filtering Which Metrics Get Sent Out
Not all metrics need long-term storage. Some are high-volume, noisy, or only useful locally.
write_relabel_configs makes it easy to keep or drop specific data before it leaves Prometheus.
remote_write:  - url: https://storage/api/v1/write    write_relabel_configs:      # Drop Go runtime and process-level metrics      - source_labels: [__name__]        regex: "go_.*|process_.*"        action: drop
      # Only send selected metrics      - source_labels: [__name__]        regex: "up|http_requests_total|http_request_duration_.*"        action: keep
      # Remove high-cardinality labels      - regex: "user_id|session_id|request_id"        action: labeldrop
This reduces network usage and long-term storage costs while keeping the signals that matter.
Tune for Your Environment
Remote Write uses a set of queue parameters that control how Prometheus reads data from the WAL and sends it to external storage. The defaults work for many setups, but larger or more sensitive environments usually need some tuning.
How the Queue Works
Remote Write relies on several parallel workers (shards).
Each worker pulls samples from the WAL, holds them in an in-memory buffer, and sends them to your backend over HTTP. If the backend slows down, the buffers start filling; if it responds quickly, workers drain the backlog.
This behavior is controlled through queue_config.
Key Parameters Used
capacity
Defines how many samples a worker can hold in memory at once.
A higher value gives more room during slow network periods or temporary backpressure. A lower value reduces memory usage but leaves less room for delays.
Useful when: network latency varies, or ingestion rates spike.
Example (larger buffer):
capacity: 15000max_samples_per_send
Controls how many samples are bundled into one HTTP request.
Larger batches reduce network overhead; smaller batches send data sooner.
Useful when: optimizing for throughput or latency depending on the workload.
Example (larger batches):
max_samples_per_send: 4000max_shards
Sets the upper limit on how many workers Prometheus is allowed to run.
More workers increase total throughput but also increase memory usage and parallel connections.
Useful when: Prometheus falls behind on sending data during peak load.
Example:
max_shards: 500min_shards
The number of workers Prometheus starts with.
Starting with more shards helps during startup or during sudden bursts of activity.
Useful when: scrape volume is high from the beginning.
Example:
min_shards: 50batch_send_deadline
How long Prometheus waits before sending a partially filled batch.
Short deadlines = faster delivery, more network requests.
Longer deadlines = fuller batches, better compression.
Example:
batch_send_deadline: 10sExample Configurations Based on Real Scenarios
High Throughput Environments (large clusters, heavy ingestion)
Designed for pushing large volumes without falling behind.
queue_config: capacity: 20000 max_samples_per_send: 5000 max_shards: 500 min_shards: 100 batch_send_deadline: 5sWhy this works: more workers, bigger buffers, and larger batches increase total send capacity.
Unstable or Slow Networks
Adds more tolerance for latency and reduces the number of active connections.
queue_config: capacity: 20000 max_samples_per_send: 4000 max_shards: 100 min_shards: 20 batch_send_deadline: 10sWhy this works: large buffers smooth out temporary delays; fewer shards reduce pressure on unreliable links.
Low-Memory Instances
Keeps queue size small and reduces the number of workers.
queue_config: capacity: 5000 max_samples_per_send: 1000 max_shards: 50 min_shards: 10 batch_send_deadline: 5sWhy this works: smaller buffers and fewer workers reduce RAM usage.
Fast Delivery (lower latency)
Good for systems where fresh data is more important than minimizing request count.
queue_config: capacity: 5000 max_samples_per_send: 500 max_shards: 200 min_shards: 50 batch_send_deadline: 1sWhy this works: smaller batches and quick deadlines send data almost immediately.
Monitor the Queue
These metrics give a clear view of how Remote Write behaves:
prometheus_remote_storage_samples_pending
Shows backlog. A steady increase means Prometheus is sending slower than it’s scraping.prometheus_remote_storage_shards
Shows how many workers are active. Constant scaling up indicates the backend is slow or the queue is stressed.prometheus_remote_storage_samples_dropped_total
Should stay at zero. Drops indicate queue pressure or send failures.prometheus_remote_storage_samples_retries_total
Occasional retries are normal; continuous retries point to backend or network issues.
Now, optimize Prometheus Remote Write instantly, right from your IDE, with AI and Last9 MCP. Bring real-time production context: queue metrics, throughput data, and remote write performance, into your local environment to tune configs faster.
Troubleshooting Common Problems
Remote Write issues usually fall into three broad areas: sending stalls, higher-than-expected memory use, or rising network costs.
Let’s talk about how each problem shows up, what usually triggers it, and the adjustments that help.
1. Metrics Stop Sending
A common failure mode is when Remote Write works for a while and then gradually stops pushing data. The backlog grows, samples_pending climbs, and the remote system receives nothing.
This usually points to one of a few underlying conditions:
- the remote endpoint isn’t reachable
- DNS, TLS, or firewall rules are blocking requests
- the queue is full and Prometheus has paused WAL reads
- workers keep rescaling because response times fluctuate
To confirm what’s happening, first test basic connectivity:
curl -I https://your-endpoint/api/v1/writeIf that responds correctly, check queue behavior:
prometheus_remote_storage_samples_pendingprometheus_remote_storage_shardsrate(prometheus_remote_storage_failed_samples_total[5m])The logs are also useful here; connection errors, resharding loops, or stalled sends show up clearly.
Fixes depend on the cause. If the endpoint is temporarily down, Prometheus will hold data in the WAL for roughly two hours and send it once the backend comes back.
Network issues need local debugging: DNS, TLS certificates, proxies, or firewall rules.
If the queue is at capacity, increasing throughput helps:
queue_config: max_shards: 400And if shard counts keep oscillating, pinning them to a stable range avoids churn:
queue_config: min_shards: 100 max_shards: 2002. Memory Usage Keeps Growing
Some setups see Prometheus memory climb steadily after enabling Remote Write. This usually comes from queue buffers and metadata storage.
Environments with lots of churn — high-cardinality metrics, many unique label combinations, or multiple remote write targets — use more memory than expected.
To understand what’s consuming memory, start with:
process_resident_memory_bytessum(prometheus_remote_storage_queue_size) by (url)rate(prometheus_tsdb_head_series_created_total[5m])These show overall memory, queue sizes per endpoint, and how quickly new series are created.
If queue buffers are the issue, lowering shard count or reducing buffer sizes helps:
queue_config: max_shards: 100 capacity: 5000When the cause is high-cardinality series, removing unbounded labels or unneeded histograms makes a noticeable difference:
write_relabel_configs: - source_labels: [__name__] regex: ".*_bucket" action: drop - regex: "user_id|session_id|trace_id" action: labeldropIt also helps to identify metrics creating the most series:
topk(20, count by (__name__) (up))Often a single metric family with user-specific or request-specific labels drives memory growth.
3. Network Costs Increase Unexpectedly
Remote Write sends every sample over the network, so environments with many Prometheus servers or cross-region links may notice bandwidth usage rise quickly.
The most common reasons are:
- batches that are too small (many small requests)
- sending metrics that aren’t used
- too many parallel workers hitting the backend
To check the pattern, look at request rate, batch size, and total bytes sent:
rate(prometheus_remote_storage_sent_batch_duration_seconds_count[5m])rate(prometheus_remote_storage_samples_total[5m]) / rate(prometheus_remote_storage_sent_batch_duration_seconds_count[5m])rate(prometheus_remote_storage_bytes_total[5m])If the cluster is making a high number of small requests, switching to larger batches and fewer workers reduces overhead:
queue_config: capacity: 20000 max_samples_per_send: 4000 max_shards: 100Teams often see network usage drop significantly after tightening batch size and shard count.
It also helps to remove metrics that don’t need long-term retention. After inspecting the highest-volume metric families:
topk(20, count by (__name__) (up))drop the ones that don’t provide value:
write_relabel_configs: - source_labels: [__name__] regex: "go_.*|process_.*|prometheus_.*" action: dropThis trims the data before it leaves Prometheus.
If the backend supports Remote Write 2.0, enabling it is also effective; improved encoding reduces bandwidth substantially.
How is Remote Write 2.0 Different
Remote Write 2.0 introduces a more efficient encoding format that reduces network usage, improves handling of native histograms, and adds better response reporting. It’s still marked experimental, but stable enough to use if your receiver already supports it.
What Remote Write 2.0 Changes
The main improvement is bandwidth reduction. The new schema and encoding cut egress by roughly 50–60% compared to the older format. This matters in large deployments or environments where cross-region traffic is expensive.
Remote Write 2.0 also brings two practical additions:
- Native histograms can be sent without converting them into multiple bucket series.
- Response metadata allows receivers to report which samples were written, making partial failures easier to detect.
If the backend doesn’t support 2.0, Prometheus automatically falls back to the previous version, so compatibility is not an issue.
When an Upgrade Makes Sense
The upgrade is worthwhile when Prometheus pushes large volumes of data, when egress costs matter, or when native histograms are part of the workload. New deployments can start with 2.0 from the beginning.
Cases where waiting is reasonable include receivers that haven’t implemented 2.0 yet, small installations where bandwidth isn’t a concern, or environments that prefer to adopt features only after they move out of experimental status.
How to Enable Remote Write 2.0
The steps are straightforward:
- Confirm that the remote endpoint advertises Remote Write 2.0.
You should see a response header such asX-Prometheus-Remote-Write-Version: 2.0.0. - Run Prometheus v2.40.0 or newer.
After restarting, verify that samples are still being written and check bandwidth usage:
rate(prometheus_remote_storage_succeeded_samples_total[5m])rate(prometheus_remote_storage_bytes_total[5m])Start Prometheus with the feature flag:
prometheus --enable-feature=remote-write-2.0 --config.file=prometheus.ymlIf any issue appears, removing the feature flag reverts the behavior and Prometheus will negotiate back to version 1.0 automatically.
What is Agent Mode?
Prometheus also offers agent mode, which removes local storage and query capabilities. It keeps only scraping and Remote Write.
This mode is designed for lightweight collectors — edge nodes, small VMs, or environments where Prometheus runs purely as a forwarder.
Agent mode is useful when:
- local queries and dashboards aren’t needed
- memory and disk resources are limited
- many small Prometheus instances exist only to collect metrics and ship them to a central system
However, it should not be used when local alerting or the Prometheus UI is required, since both depend on the local TSDB.
To enable it:
prometheus --config.file=prometheus.yml --enable-feature=agentThe configuration remains mostly unchanged:
global:  scrape_interval: 30s  external_labels:    cluster: edge-device-01
scrape_configs:  - job_name: node    static_configs:      - targets: ["localhost:9100"]
remote_write:  - url: https://central-storage/api/v1/write
In this mode, Prometheus keeps only a WAL, doesn’t expose the query API, and uses significantly fewer resources. Typical memory usage falls to a few hundred megabytes, with disk usage dropping to a small fraction of the server mode footprint. For distributed environments with many collectors, this pattern reduces operational overhead while still giving full visibility through a central backend.
Final Thoughts
Once you turn on Remote Write, Prometheus shifts from being a local metrics store to a component in a larger telemetry pipeline. At that point, performance depends on how well your queue behaves, how quickly your backend responds, and how much scrape volume you push through the WAL.
The tuning patterns in this guide help you keep up — adjusting shard counts, batch sizes, and retention windows based on what you see in samples_pending, shard churn, and bandwidth usage.
As you scale, keep an eye on four areas:
- how often queues stall or retry
- how quickly new series are created
- how much memory queue buffers consume
- how much network egress your Prometheus instances generate
These signals usually tell you whether to increase throughput, reduce cardinality, resize buffers, or adjust scrape intervals.
If you’re running your own backend (Thanos, Cortex, VictoriaMetrics), you have full control and can use the tuning patterns here to keep it stable. But if you don’t want to maintain a long-term storage layer or tune queue parameters yourself, this is where Last9 helps you.
Use Last9 With Remote Write
Levitate is Last9’s managed Prometheus storage that’s built specifically for Remote Write workloads. Instead of tuning max_shards, adjusting batch sizes, or managing a Thanos/Cortex cluster, you point Prometheus at a single endpoint and let Levitate handle the heavy lifting.
When you use Levitate:
- queue behavior is optimized based on your throughput
- long-term retention and downsampling are handled automatically
- query performance stays consistent as data grows
- you avoid running object storage, compaction, stores, queriers, or distributors
If you’re already running a self-hosted backend, you can add Levitate as a second Remote Write endpoint. That lets you test queries in parallel, compare performance, and switch over whenever you’re comfortable — no downtime, no migration scripts, and no need to interrupt your existing Prometheus deployment.
For teams that want to keep Prometheus simple, reduce operational work, and avoid storage maintenance, pointing Remote Write to Levitate is a straightforward alternative. And if you enjoy running your own setup, the tuning and troubleshooting patterns in this guide give you everything you need to keep it healthy.
Get Started with Last9 in just few minutes! Drop in your endpoint, keep your existing setup, get long-term storage and high-cardinality support.
FAQs
Does Remote Write replace Prometheus storage?
No. Prometheus still keeps recent data locally. Remote Write adds a parallel path that forwards samples to external storage for long-term retention or centralized querying.
How much data can Remote Write handle?
It can push millions of samples per minute when tuned properly. Throughput mainly depends on shard count, batch size, network latency, and receiver performance.
Will Prometheus drop data if the backend goes down?
Prometheus keeps about two hours of WAL data. If the backend recovers within that window, all samples are sent. Longer outages cause gaps unless a secondary Remote Write endpoint is configured.
How do I check if Remote Write is falling behind?
Watch:
prometheus_remote_storage_samples_pendingprometheus_remote_storage_shardsrate(prometheus_remote_storage_failed_samples_total[5m])A rising samples_pending value indicates the queue is lagging.
How much memory does Remote Write use?
Expect memory to increase by around 20–30%. Queues and label metadata add overhead, and high-cardinality metrics increase it further.
Can I filter which metrics are sent?
Yes. write_relabel_configs can drop metric names, remove high-cardinality labels, or keep only specific metrics. This reduces network traffic and storage costs.
Does Remote Write support native histograms?
Remote Write 2.0 does. Native histograms are sent directly without expanding into bucket series.
Is Remote Write 2.0 stable enough for production?
It’s marked experimental but widely used. Prometheus automatically falls back to version 1.0 if the backend doesn’t support 2.0.
Do dashboards or alerts need changes after enabling Remote Write?
No. Dashboards continue querying Prometheus locally. Remote Write only affects outbound data, not local querying.
Can Prometheus alert in agent mode?
No. Agent mode removes the TSDB and rule engine. It only scrapes and forwards metrics.
How do I monitor Remote Write health?
Look at:
prometheus_remote_storage_samples_pendingprometheus_remote_storage_shardsprometheus_remote_storage_samples_dropped_totalprometheus_remote_storage_bytes_total
These show queue pressure, retries, drops, and overall bandwidth usage.
What reduces Remote Write network costs most effectively?
Three common steps help:
- dropping high-volume, low-value metrics
- removing labels that create excessive cardinality
- increasing batch sizes to reduce request overhead
Does every Prometheus instance need Remote Write?
Not necessarily. It’s most useful in multi-cluster setups, environments needing long-term retention, and deployments requiring centralized dashboards or auditing.
Can Prometheus load-balance data across receivers?
Not on its own. Each configured endpoint gets the full stream. Load balancing must be handled by the receiver or an external load balancer.
How do I confirm that Remote Write 2.0 is being used?
Check the response headers:
curl -I https://your-endpoint/api/v1/writeLook for:
X-Prometheus-Remote-Write-Version: 2.0.0

