Software systems are all about changes, which can be internal or external. Having observability around the changes and their impact on the systems makes it much easier for teams to understand what caused the incident or degradation and take action in real time without wasting precious time.
Most of your outages are probably caused by a change and having observability around that will make a lot of difference https://t.co/qq6LsYvztv
— krishnanand n b (@krishnanandnb) October 28, 2023
All changes are caused by events; these can be deployment events, scale-up events, traffic patterns shifting from BAU, or even configuration changes affecting the state of the system. What if our monitoring system can track these events and then keep that context while monitoring the systems? That context will help us understand why something happened faster than finding a needle in a haystack.
Typically, you will emit golden signals or RED metrics from applications to monitor and track their performance with a monitoring system.
In this blog post, I will show you a scenario of how Levitate - our managed time series warehouse- empowers you to do more and observe change events. We will track canary releases via ArgoCD rollouts with Levitate.
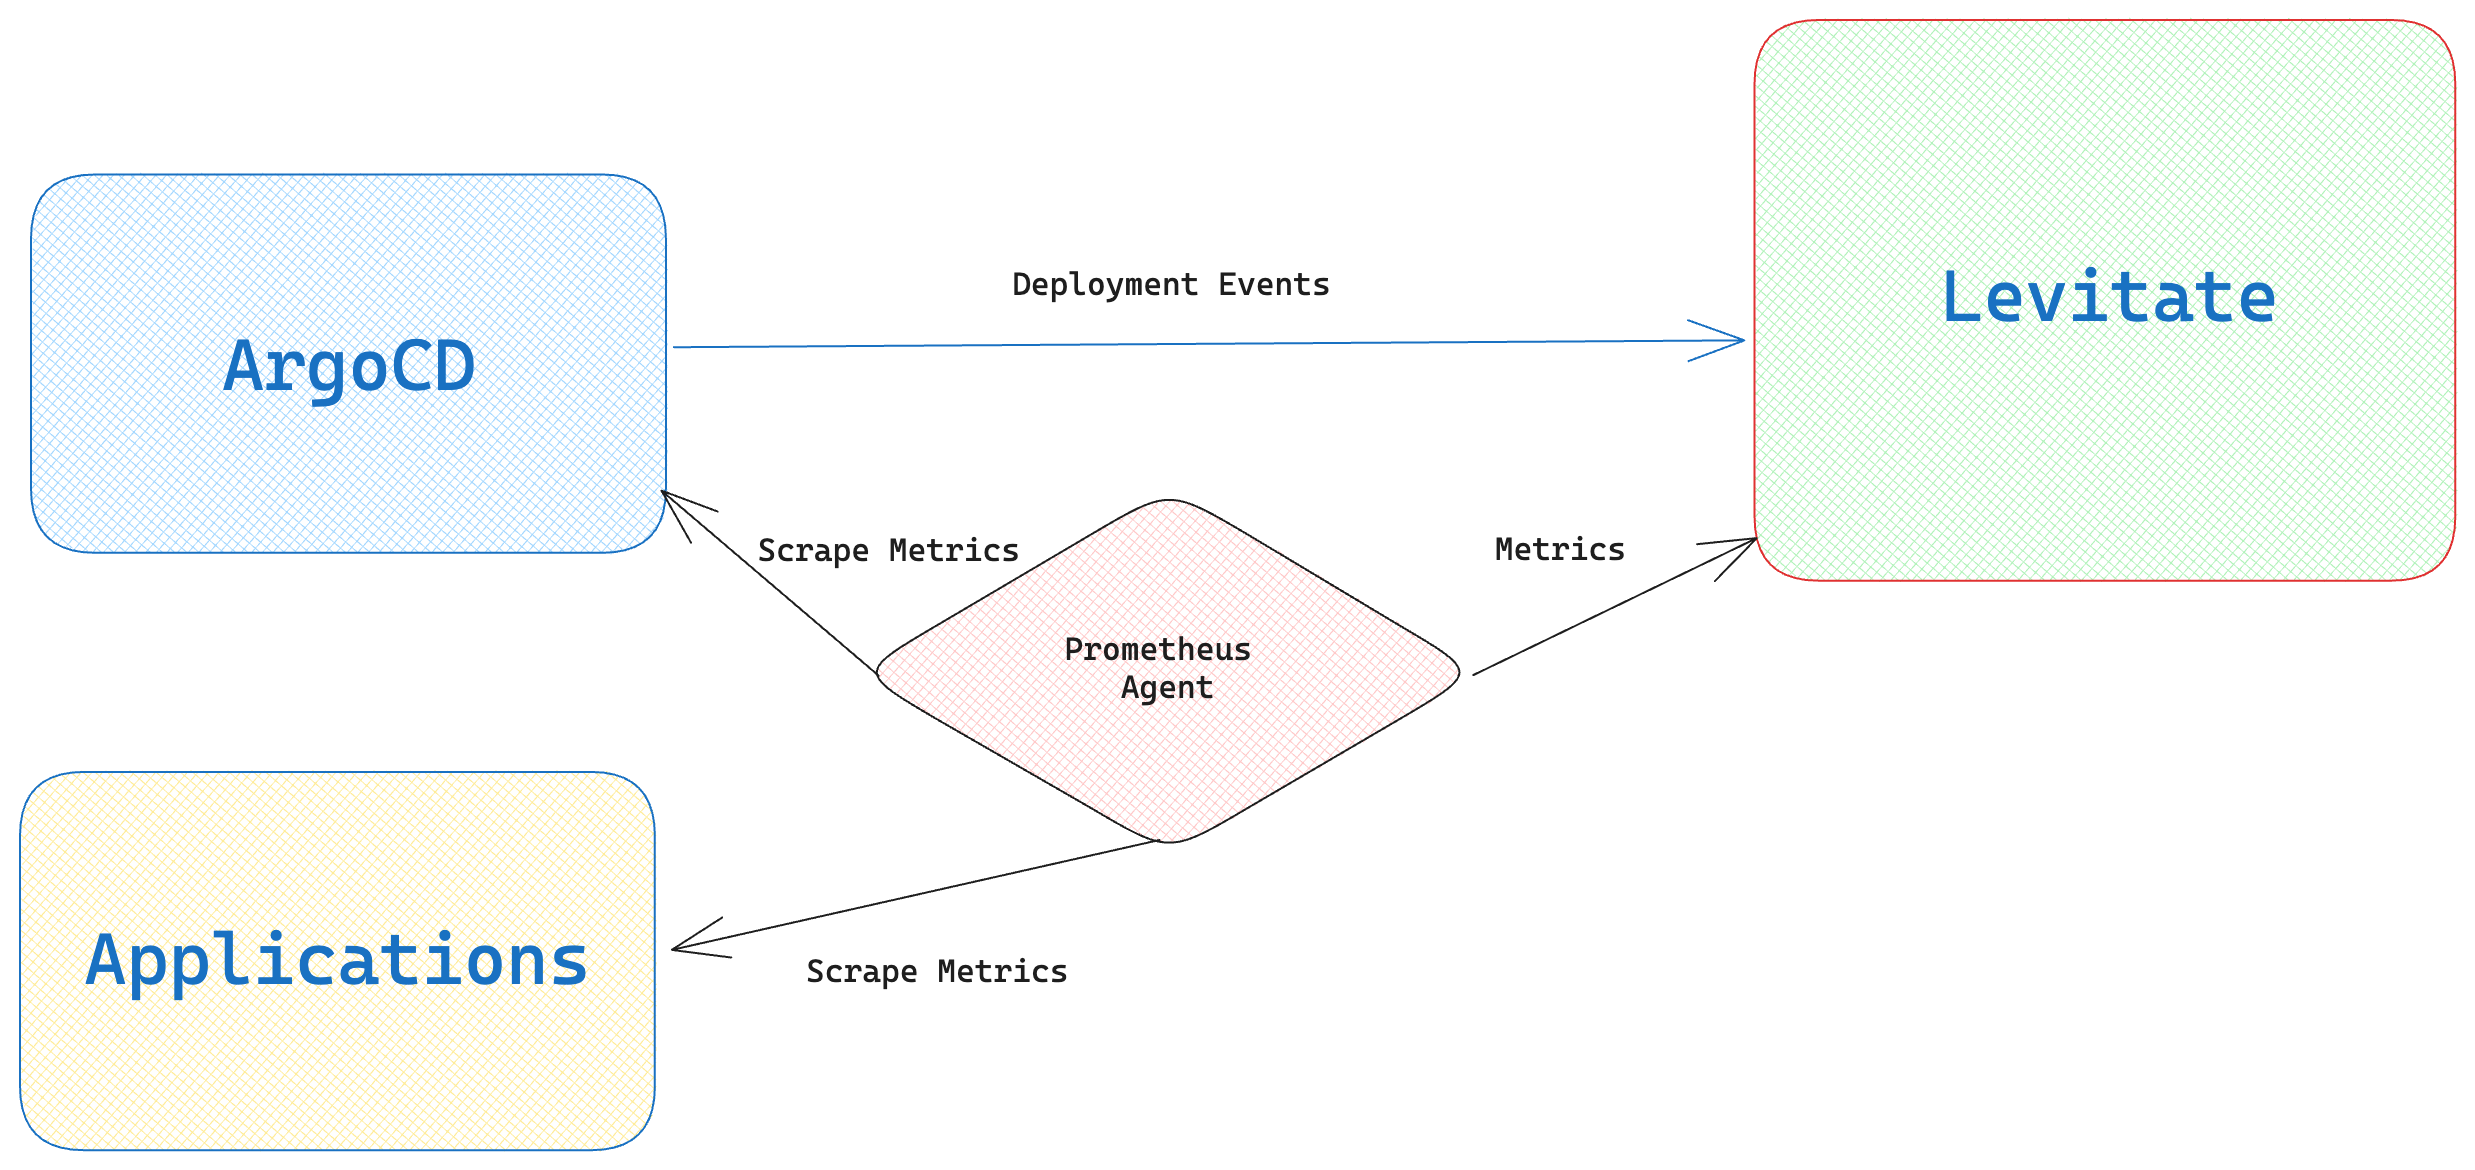
Levitate enables correlating events from various sources such as CI/CD, orchestrator, and external systems with other applications and infra metrics to provide contextual alerts and understand system behavior.
Setup
In this setup, I am using a typical canary rollout using Argo Rollouts via Helm charts, where the canary gets deployed progressively to more percentages of users like 20%, 40%, 60%, and so on. Anytime the performance of the canary degrades, I want to roll it back without affecting more users.
Each rollout goes via two stages as follows. We start and stop the rollout before going to the next stage.
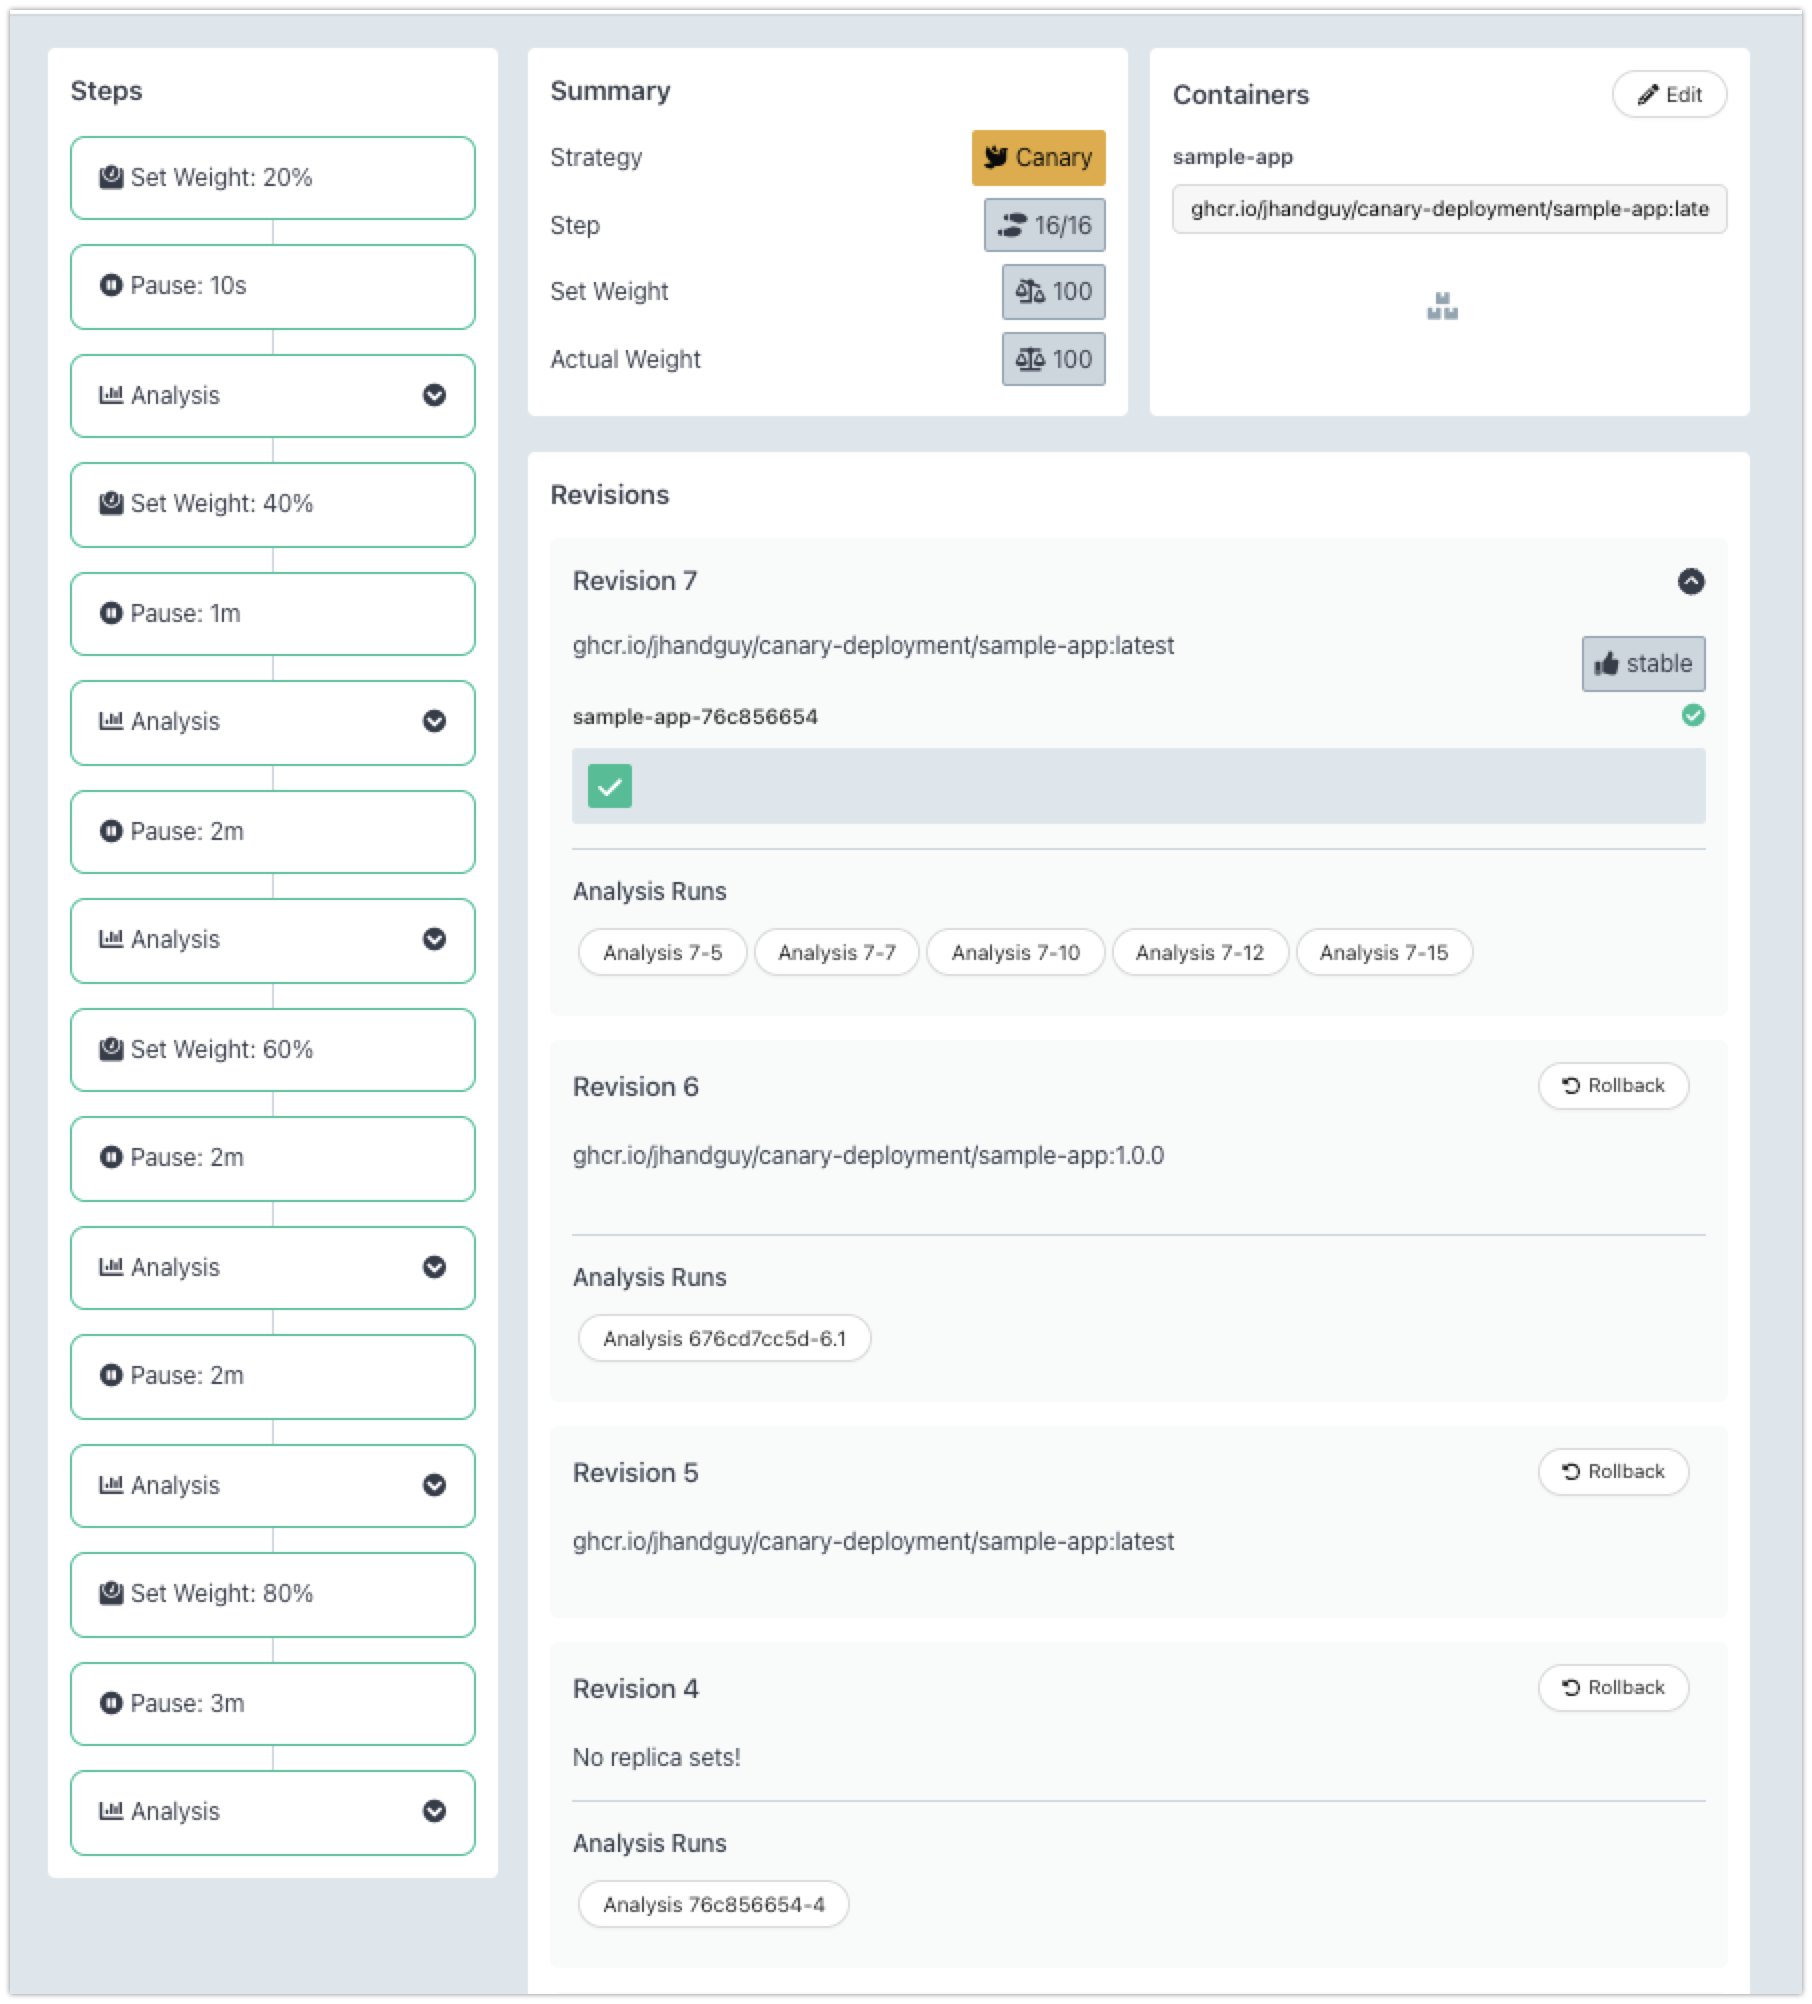
After rolling out the canary at each stage, we wait for a specified time to receive the requests from actual users and then analyze whether the step was successful. Typically, we want to ensure the users do not face any errors with the canary.
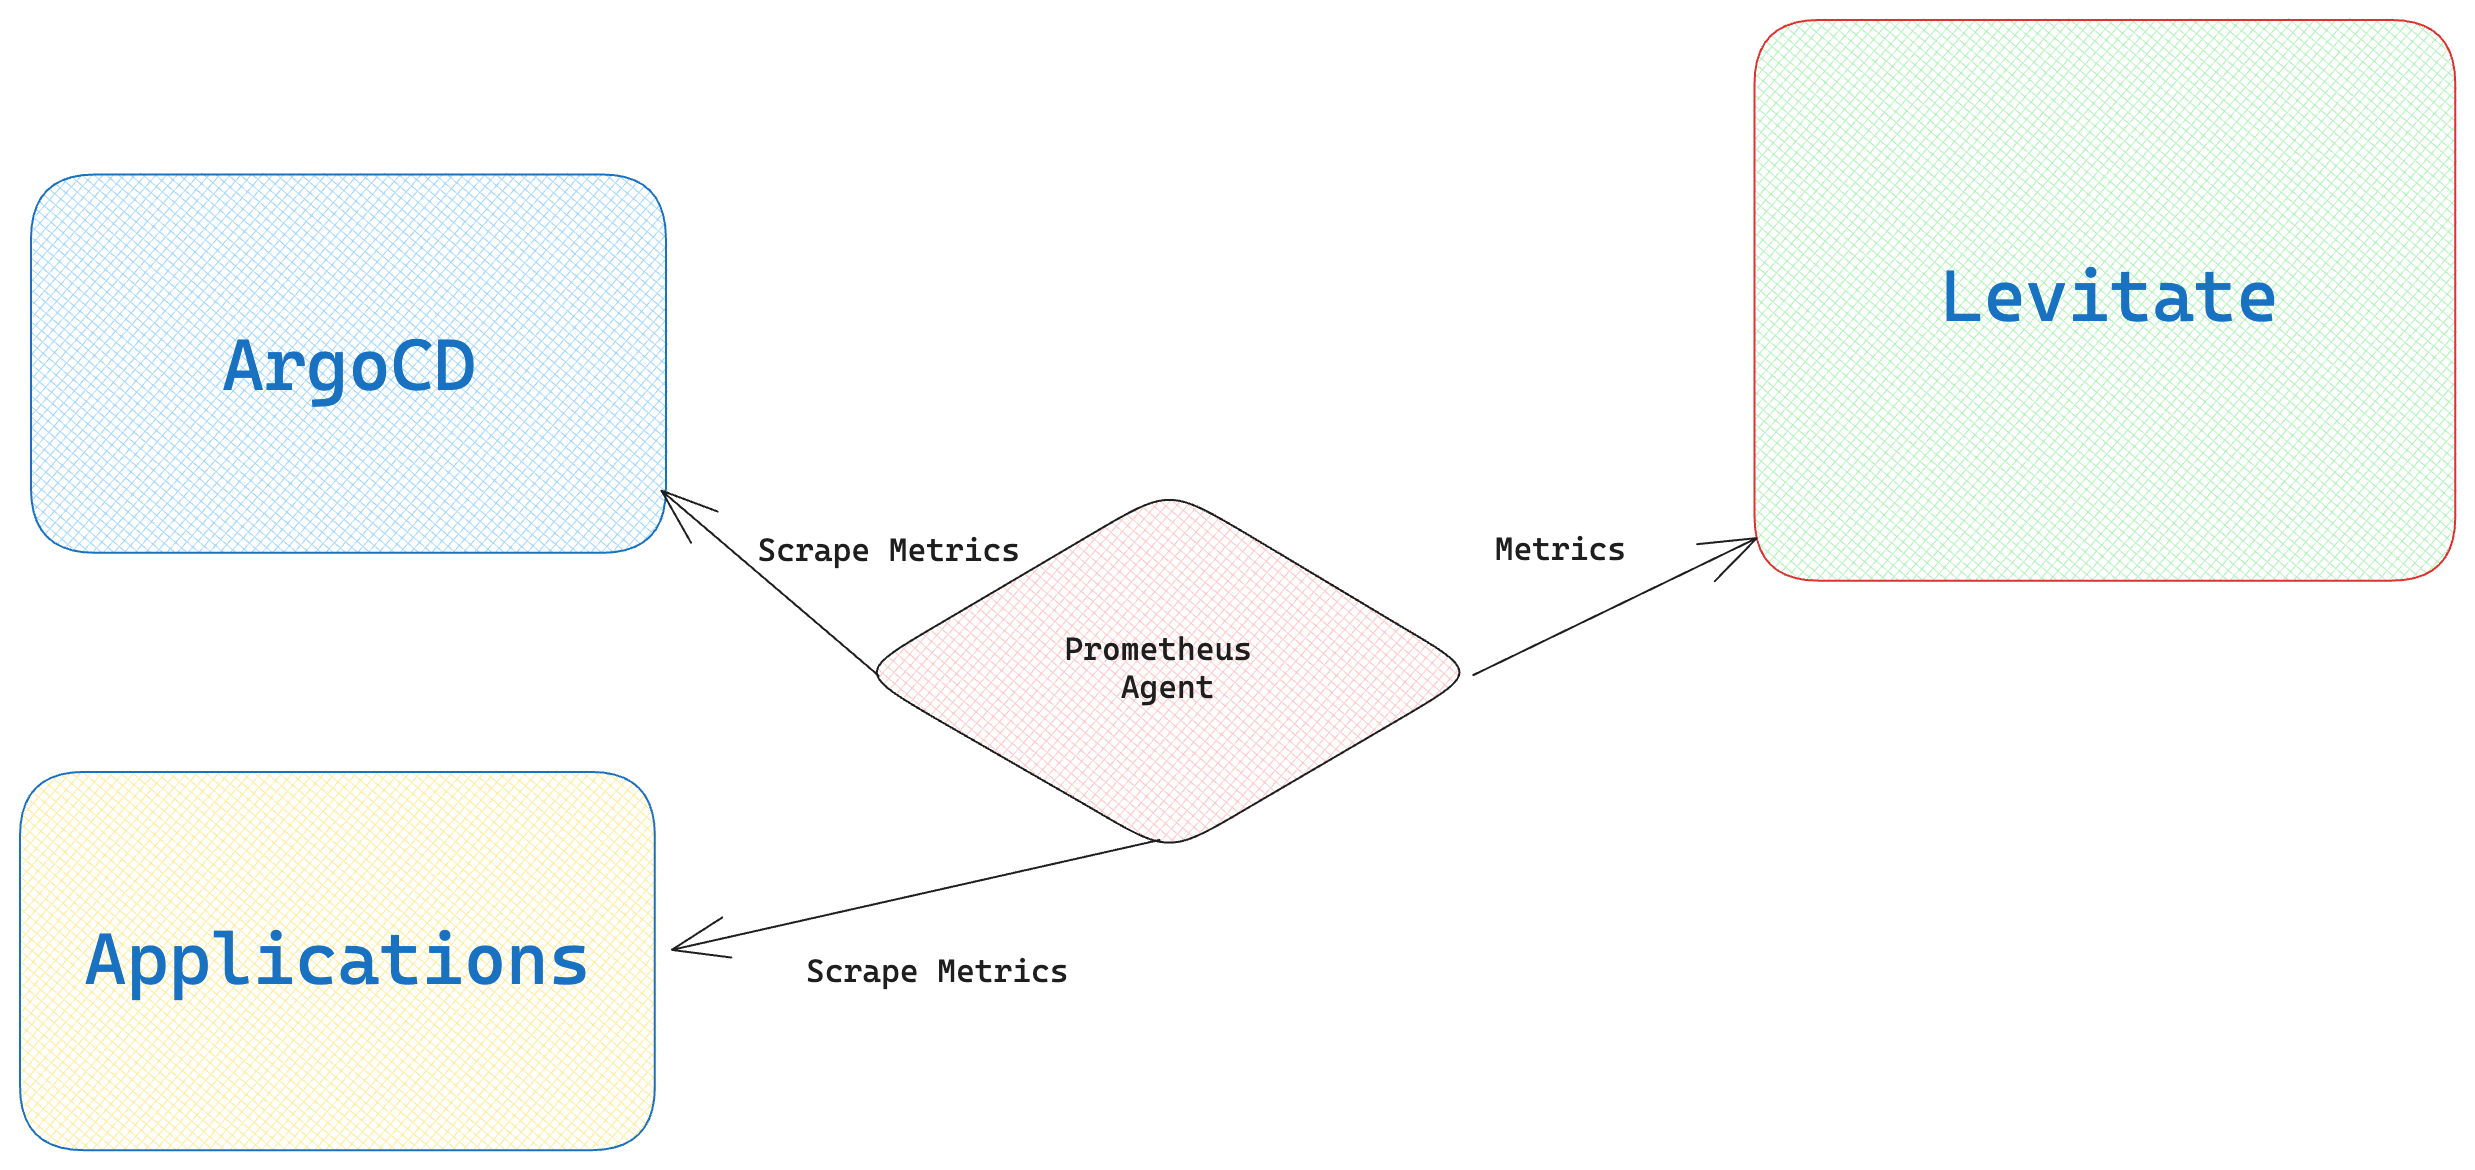
We already have RED metrics emitted from the application that goes to Levitate. These metrics tell us how the application performs at any rollout stage and during BAU.
Here is the complete code example to follow along: https://github.com/pree-dew/canary-deployment-with-argo-helm
Utilizing Levitate's Change Events
Levitate provides an API to consume "Change Events" over HTTP. This endpoint allows pushing the events to Levitate.
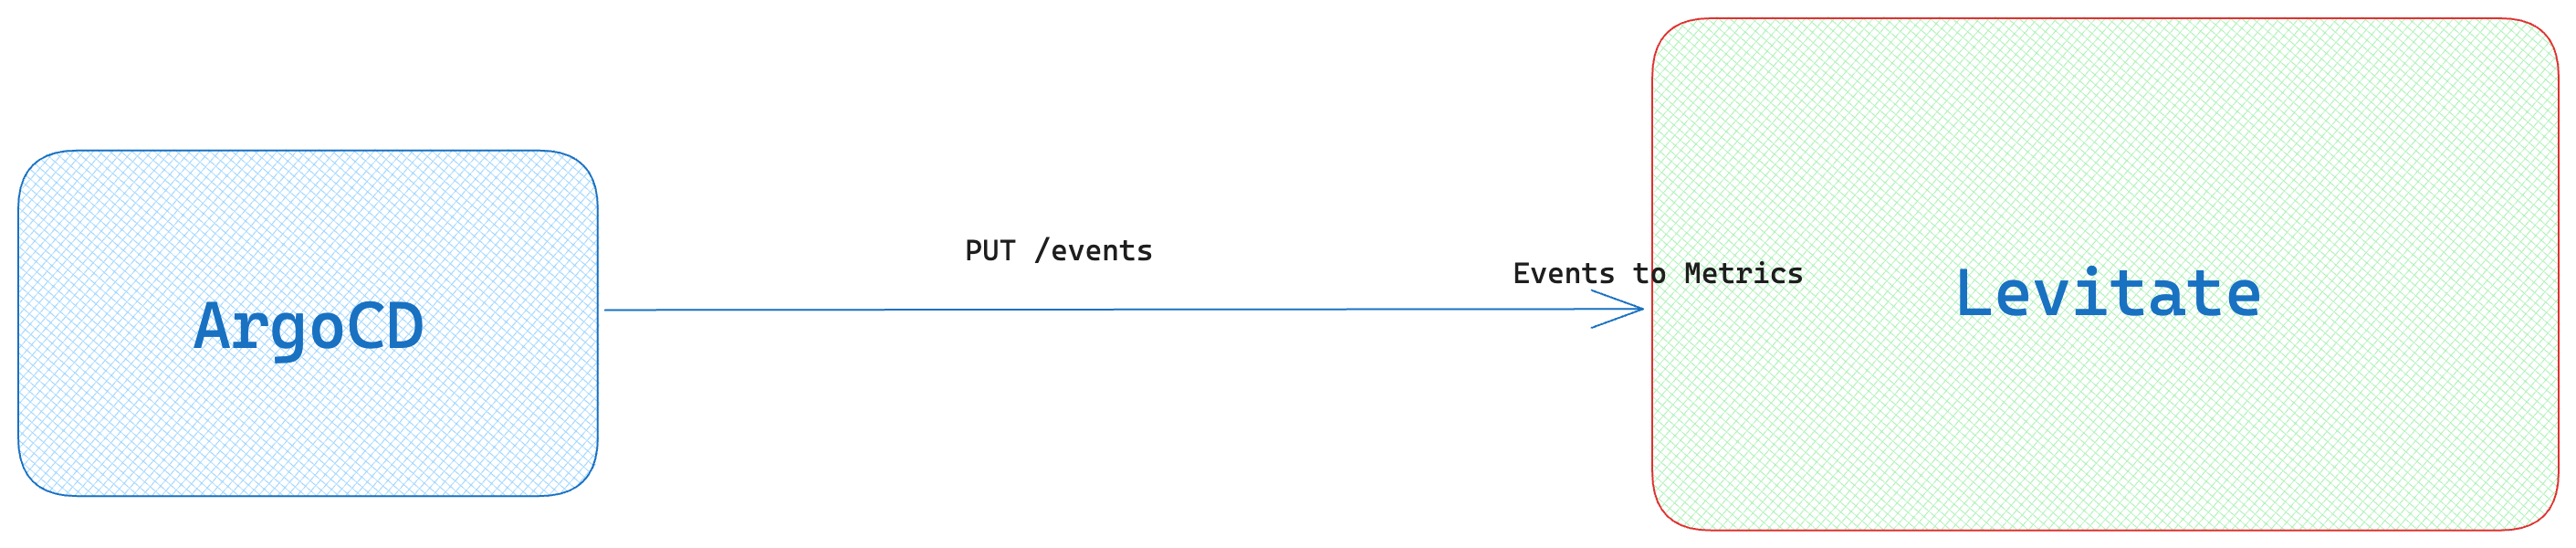
Levitate converts them into metrics and retains specific metadata sent with the API call. The converted metrics can then be combined with other application metrics using PromQL to build dashboards and alerts.
Each event has two states - start and stop. So we can mark an event as started and stopped.
We can push these events to Levitate as the canary rollout is happening via plain old curl commands.
curl -XPUT https://app.last9.io/api/v4/organizations/{org}/change_events \
--header 'Content-Type: application/json' \
--header 'X-LAST9-API-TOKEN: Bearer: <LAST9_API_WRITE_TOKEN>' \
--data-raw '
{
"timestamp": "<current_epoch_timestamp>",
"event_name": "<canary-deployment-step>",
"event_state": "start",
"workspace": "sample-service",
"namespace": "prod",
"entity_type": "service",
"data_source_name": "<levitate-data_source-name>"
}'
These curl calls are embedded in the analysis template for each canary.
kind: AnalysisTemplate
apiVersion: argoproj.io/v1alpha1
metadata:
  name: canary-step-20-start
spec:
  metrics:
  - name: test
    provider:
      job:
        spec:
          backoffLimit: 1
          template:
            spec:
              containers:
              - name: last9-event
                image: curlimages/curl:7.73.0
                command:
                    - /bin/sh
                    - -c
                    - |
                      curl -XPUT {{.Values.env.last9_url}} --data "{\"timestamp\": \"$(date -u +"%Y-%m-%dT%H:%M:%SZ")\", \"event_name\": \"{{ .Release.Name }}-20\", \"event_state\": \"start\", \"workspace\": \"sample-service\", \"namespace\": \"prod\", \"entity_type\": \"service\", \"data_source_name\": \"github-prathamesh-sonpatki-AMXD - ap-south-1 (system)\"}" -H "X-LAST9-API-TOKEN: Bearer {{.Values.env.last9_token}}"
              restartPolicy: Never

---
kind: AnalysisTemplate
apiVersion: argoproj.io/v1alpha1
metadata:
  name: canary-step-20-stop
spec:
  metrics:
  - name: test
    provider:
      job:
        spec:
          backoffLimit: 1
          template:
            spec:
              containers:
              - name: last9-event
                image: curlimages/curl:7.73.0
                command:
                    - /bin/sh
                    - -c
                    - |
                      curl -XPUT {{.Values.env.last9_url}} --data "{\"timestamp\": \"$(date -u +"%Y-%m-%dT%H:%M:%SZ")\", \"event_name\": \"{{ .Release.Name }}-20\", \"event_state\": \"stop\", \"workspace\": \"sample-service\", \"namespace\": \"prod\", \"entity_type\": \"service\", \"data_source_name\": \"github-prathamesh-sonpatki-AMXD - ap-south-1 (system)\"}" -H "X-LAST9-API-TOKEN: Bearer {{.Values.env.last9_token}}"
              restartPolicy: Never
All such events are converted into a metric named last9_change_events by Levitate with labels such as event_name and event_state a few others.
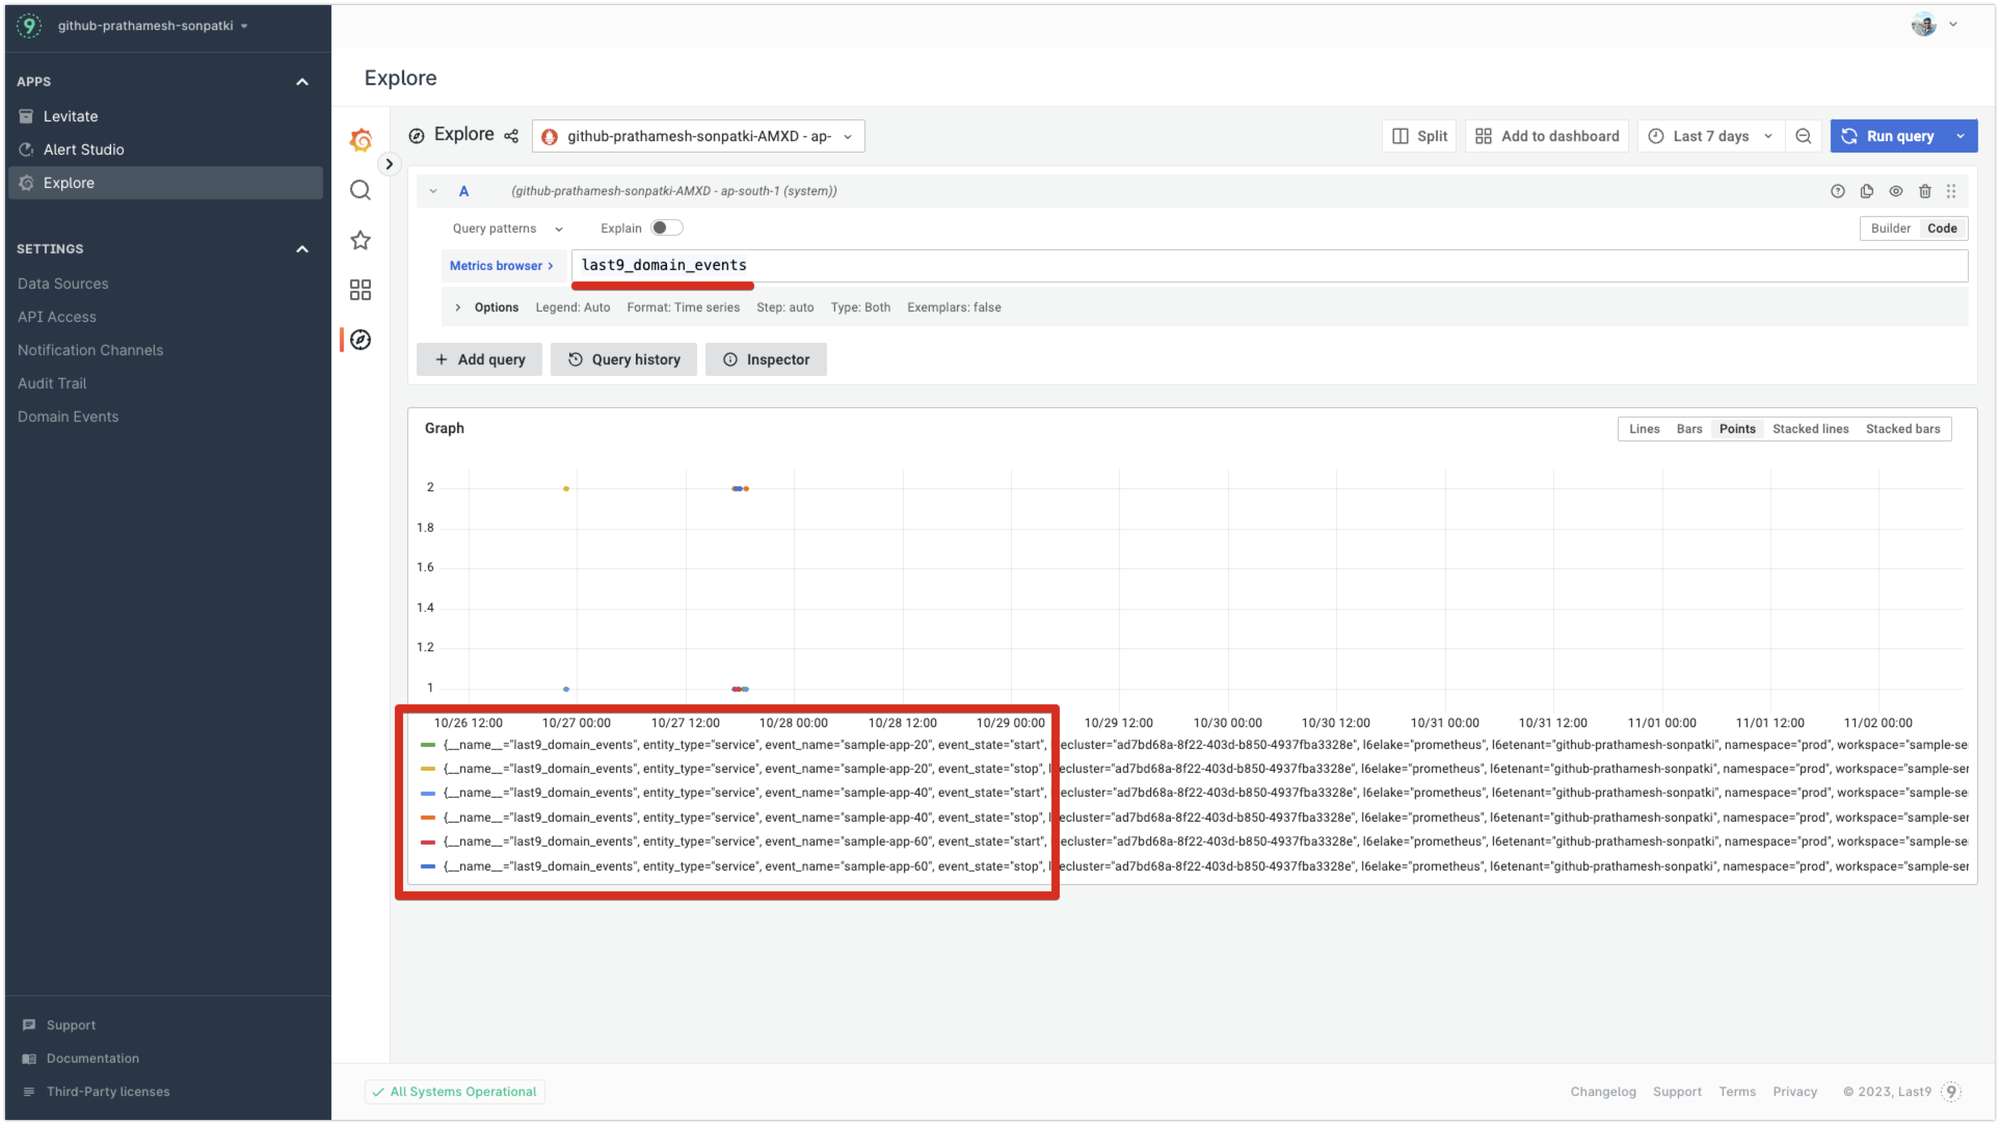
These change events can then be combined with other application metrics to perform specific operations during an event.
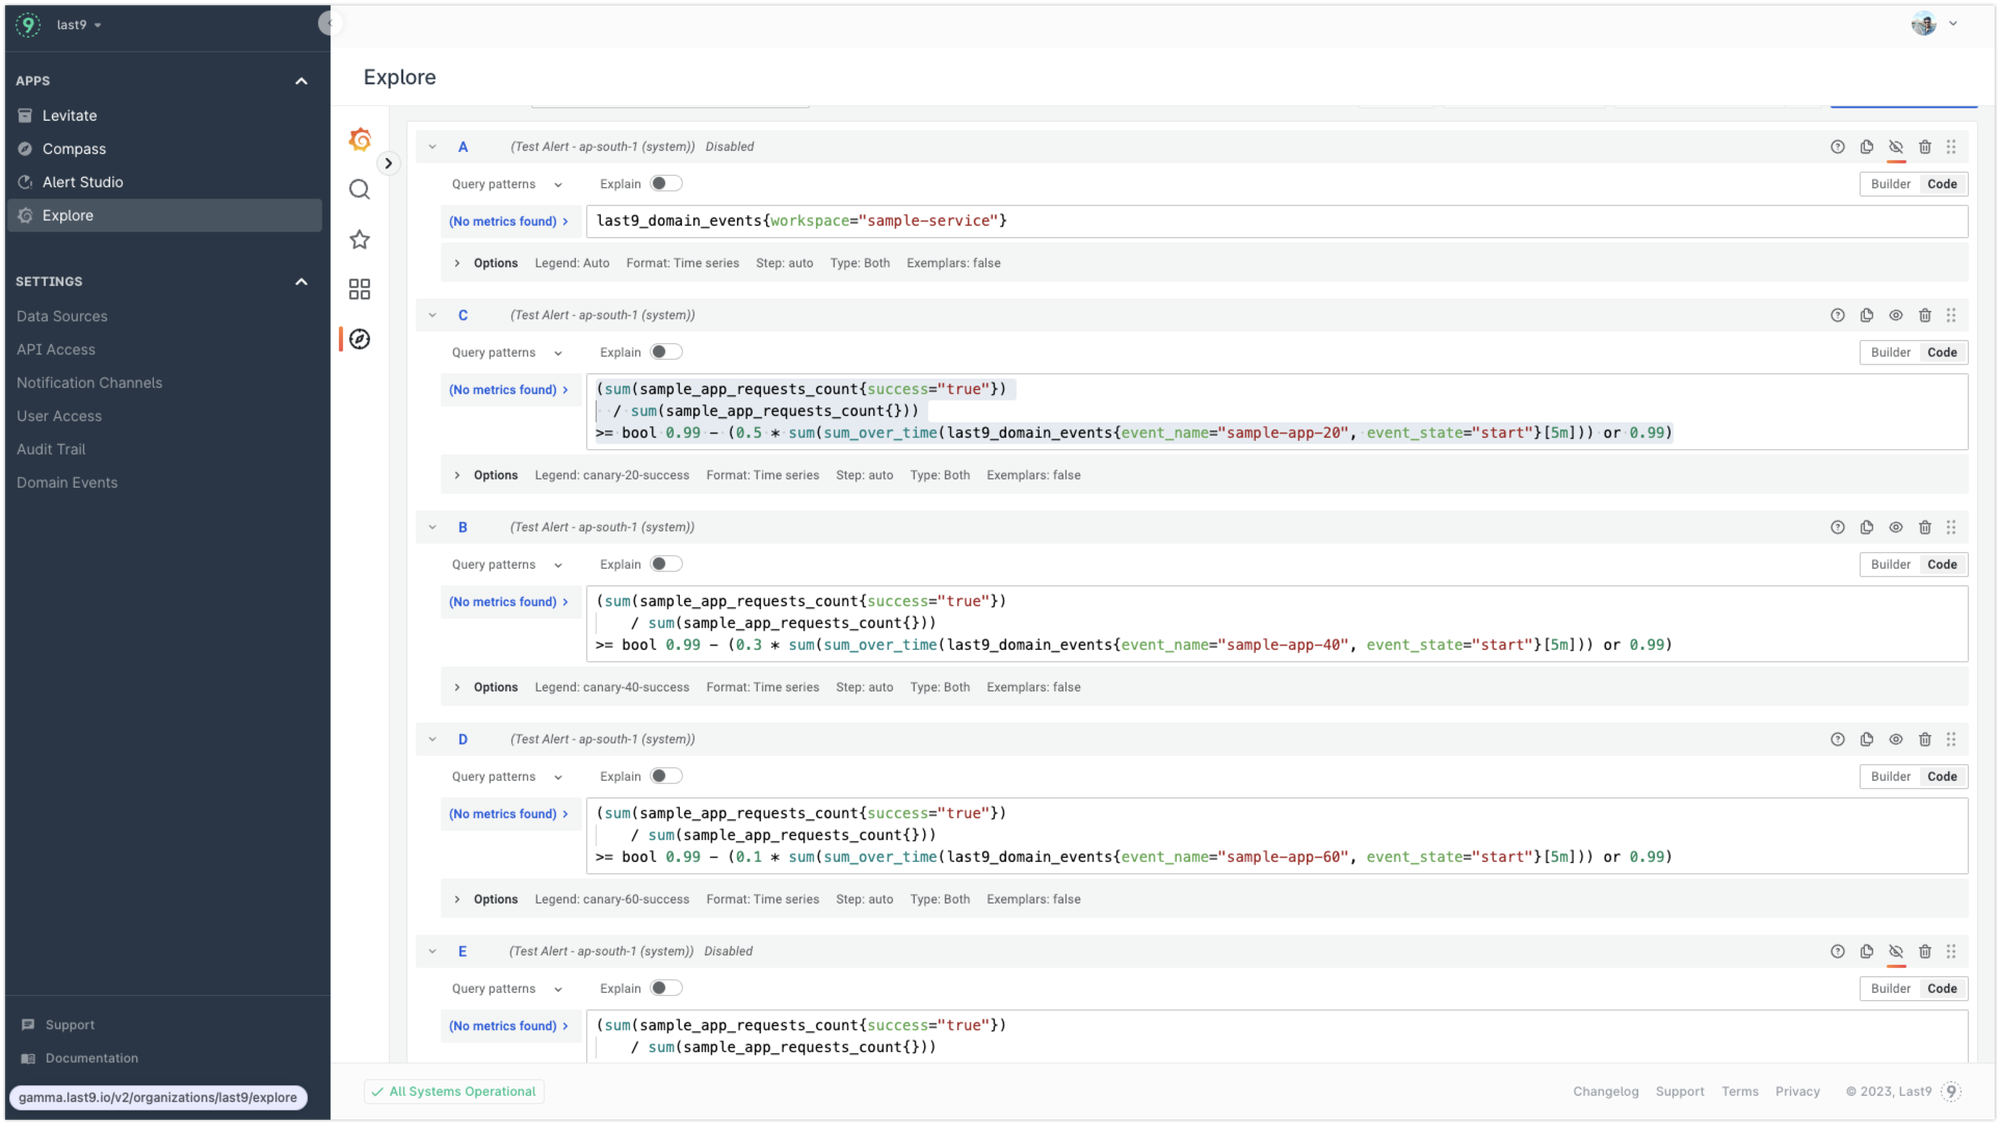
Here is an example of a PromQL query that tracks performance and whether the rollout to 20% of users was successful.
(sum(sample_app_requests_count{success="true"})
  / sum(sample_app_requests_count{}))
>= bool 0.99 - (0.5 * sum(sum_over_time(last9_domain_events{event_name="sample-app-20", event_state="start"}[5m])) or 0.99)
This can be extended to all rollouts of the canary, where we can track different error percentages for each rollout.
Connecting the dots
ArgoCD rollout has an analysis step after each rollout to determine whether the canary was a success. It can evaluate the canary depending on metrics present in a time series database. We leverage the contextual PromQLs prepared above to calculate whether the canary is successful.
Here is a sample analysistemplate.yaml.
---
{{- if .Values.prometheus.enabled }}
apiVersion: argoproj.io/v1alpha1
kind: AnalysisTemplate
metadata:
  name: {{ .Release.Name }}
  namespace: {{ .Release.Namespace }}
spec:
  metrics:
    - name: success-share
      interval: 1m
      successCondition: len(result) == 0 || result[0] > 0
      failureLimit: 0
      provider:
        prometheus:
          address: {{ .Values.prometheus.address }}
          query: |
            (sum(sample_app_requests_count{success="true"})
            / sum(sample_app_requests_count{}))
            > bool 0.99 - (
              0.5 * sum(
                sum_over_time(last9_domain_events{event_name="{{ .Release.Name }}-20", event_state="start"}[5m])
                ) or 0.99)
            or

            (sum(sample_app_requests_count{success="true"})
            / sum(sample_app_requests_count{}))
            > bool 0.99 - (
              0.3 * sum(
                sum_over_time(last9_domain_events{event_name="{{ .Release.Name }}-40", event_state="start"}[5m])
              ) or 0.99)

            or

            (sum(sample_app_requests_count{success="true"}[4m])
            / sum(sample_app_requests_count{}))
            > bool 0.99 - (
              0.1 * sum(
                sum_over_time(last9_domain_events{event_name="{{ .Release.Name }}-60", event_state="start"}[5m])
            ) or 0.99)
{{- end }}
That's all that is needed to track the status of the canary deployment. This setup is fully automated, and we don't need to do anything manually; we get the performance metrics of each rollout in Levitate for further analysis.
Here is a quick video showing the power of Levitate in tracking "Change Events" to measure the performance of the canary releases.
Want to give Levitate a spin? Get started for free!