

It’s December 31st.
Food delivery orders are going to go off the roof. Everyone in the engineering team knows it. Business teams are ready. Marketing has kicked off campaigns and discounts to get more folks to order. Customer Support is on standby.
The CEO wants to know if all systems are primed to manage the onslaught that’s about to happen. Last time, you had 3.5 million successful orders. But as an engineer, you know it should’ve been 7+ million. A bunch of orders could not be fulfilled. But this year is going to be better, right?
Then…
The Customer Support team tells you that some orders are not coming through, and there are complaints on… Twitter.
You wonder what it could be this time.
You have a theory… 👇
Now, Customer Support has escalated the issue. Apparently, most complaints are coming from iOS users. You kick yourself.
“Why didn’t I know that!”
“What am I not monitoring?”
“ Where should I be looking now?”
As you ponder these questions and check out iOS user behaviors, more complaints start flooding in.
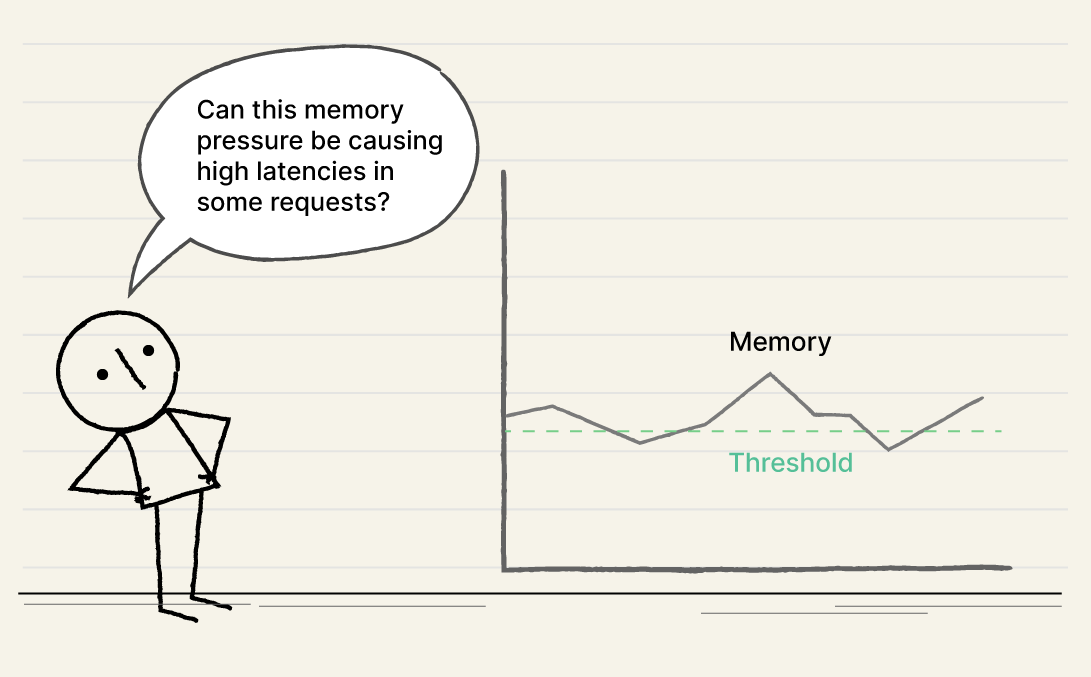
You notice memory pressure increasing on some pods of the ‘checkout’ service, and the delays on the ‘order’ service have also shot up. But how do you connect the dots with the degradation of iOS users? Is it the same device or region from where requests are coming?
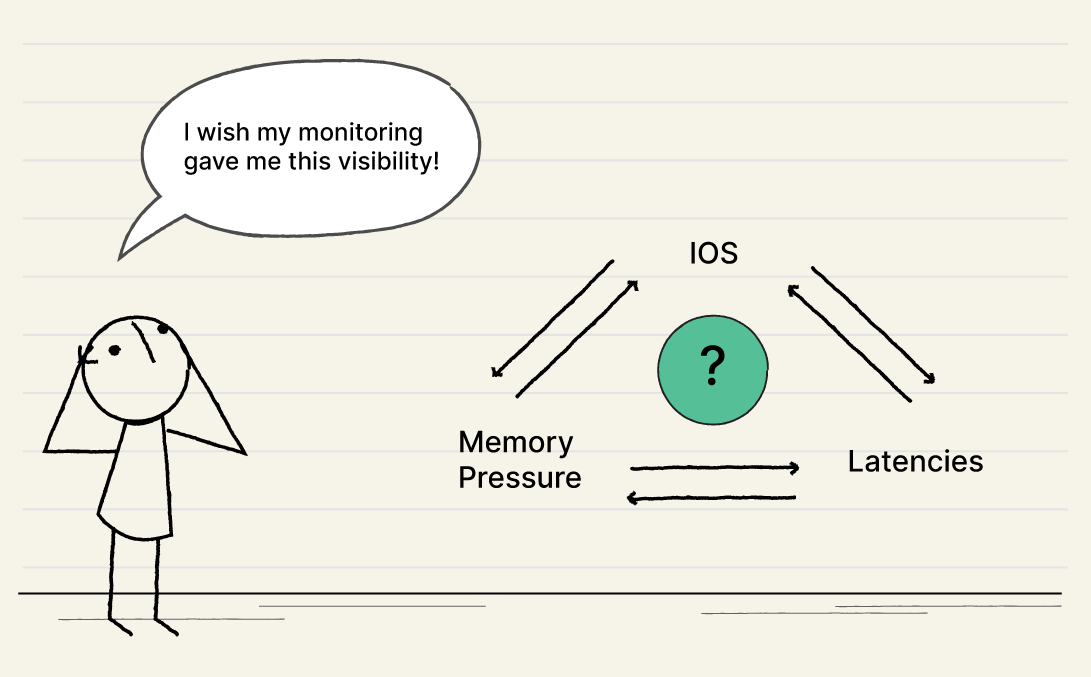
Wait, is Twitter more reliable as a monitoring tool than my own expensive $1 million monitoring systems?
Errr…
The reality hits you.
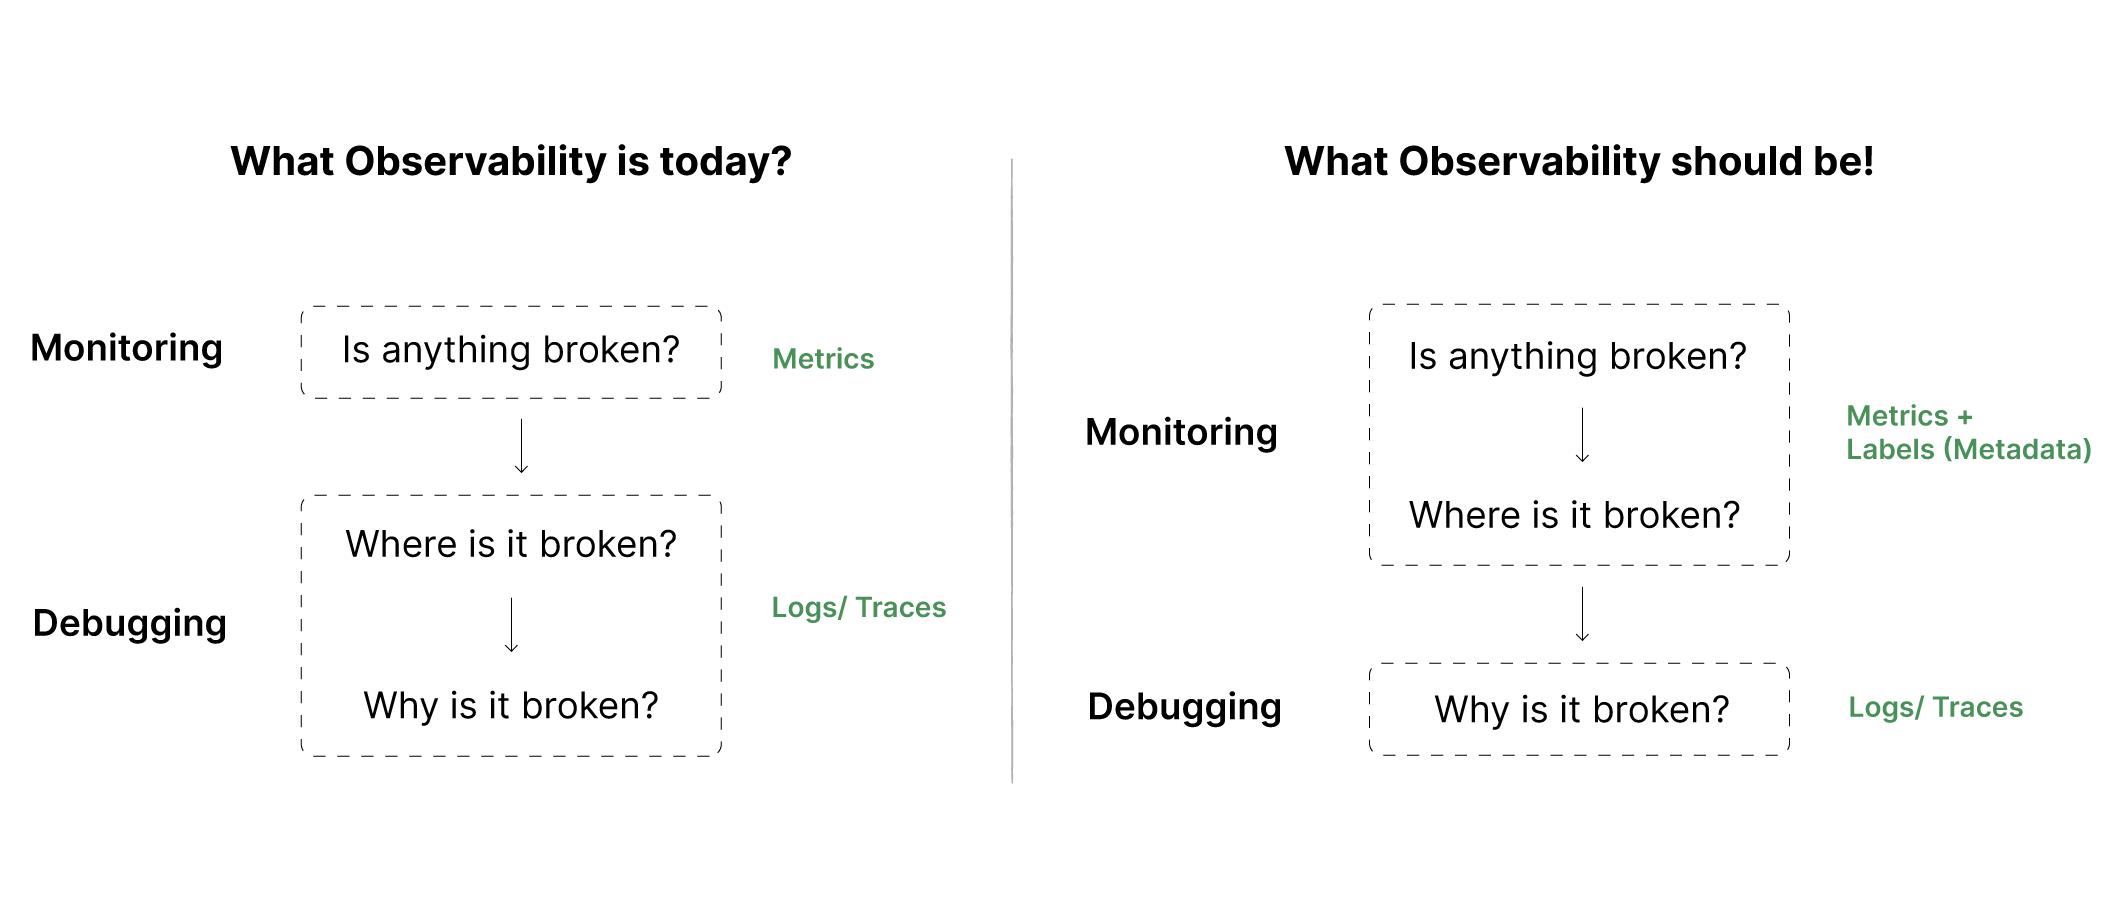
The Reality of Observability
Monitoring is the frontline of observability. Sadly, it’s being looked at as an afterthought. As systems get more complex and your observable entities grow, monitoring woes only compound in an organization. Systems never get easier. With time, they only get more complicated and convoluted.
The health of your monitoring determines revenues — it’s crucial for not just engineering to understand this but also for business and management teams to start taking notice.
Let’s get back to our story…
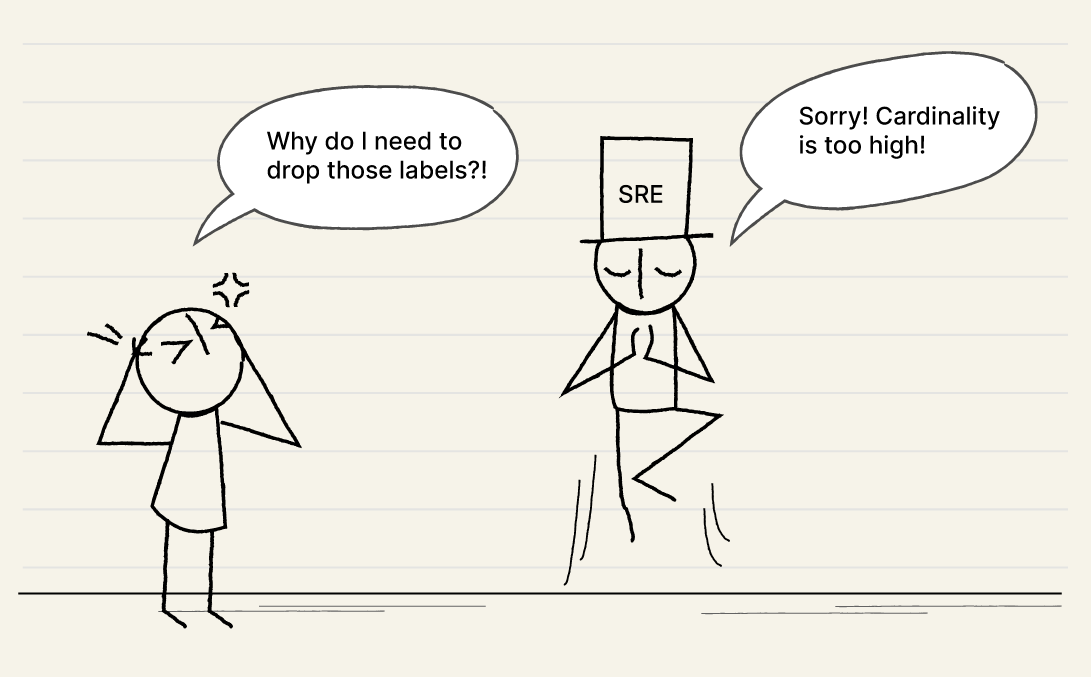
You eventually start gleaning through your dashboards to discover what is happening but can’t find what you are looking for. And then it hits you. Someone from the SRE team had asked you to drop a label a few weeks back because of…
High Cardinality.
The reality sinks in AGAIN.
You have no way to answer the Customer Support team anymore.
You have to read through endless Logs now…
WTF!
Here we go… AGAIN!
That dreaded word: CARDINALITY.
You’ve heard it countless times now. You realize cardinality means costs, and there’s pressure to bring costs down at all costs 😉. But on December 31st, you lose $200,000 just like that, and then you realize how this could all have been avoided.
Can you go back and add that label just for today? NO! All deployments are on freeze. Redeployments are costly as well.
How to Solve High Cardinality
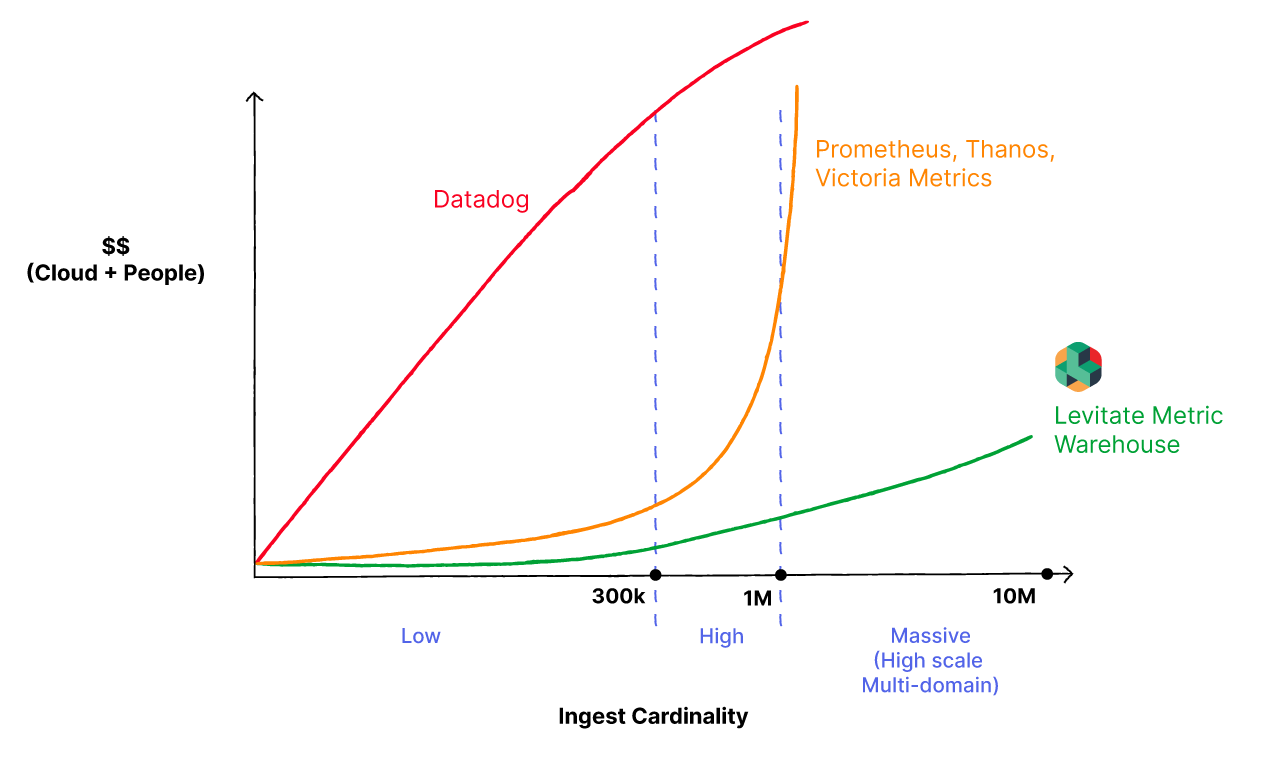
One simply does not ‘solve’ High Cardinality. Nor can you throw money at the problem for it to go away. The first step to tame High Cardinality data is to accept its inevitability. The more observable systems you have, the more your customers grow, and the more Cardinality data you will have. The only way to tame this High Cardinality data is to look at a Time Series Data Warehouse that will help you navigate Cardinality without exploding costs.
My colleague has written a detailed piece on what a TSDW is and how it can help here 👇
The first step to better monitoring is understanding your data and how your system behaves with its interconnected parts.
Monitor what you should, not what you can!
However, this can’t come at a cost. Most folks I talk to balk at Cardinality because it implies high costs. Some even don’t mind flying blind because of the costs associated with monitoring this data. This is why we build Last9 — A Time Series Data Warehouse designed to tame High Cardinality data at a fraction of your monitoring costs.
Last9 uses advanced Streaming Aggregation pipelines and workflows to tame High Cardinality data.
The Streaming Aggregation pipeline has the following distinct capabilities:
- Timestamp aware.
- Native PromQL based.
- Supports moving average-based calculations.
- No impact on accuracy because of redeployment and restarting of TSDB.
- Emits telemetry signals for monitoring streaming aggregations performance.
Once you realize Cardinality has grown but can’t change instrumentation since deployment is frozen because of the big-ticket event, you can define Streaming Aggregations on Last9 to split metrics. You can segment labels and ensure Cardinality does not crash your dashboards while ensuring you have access to the data you need at the time of your choice.
If you want to understand how Last9 differs from the rest and how it can manage what we call the “Cricket Scale”, please feel free to DM me. You can also schedule a demo.

