
Product
Creating Dashboards
Learn how to create custom dashboards with panels, visualization types, and query configurations in Last9

You can create dashboards in Last9 either from scratch or by promoting queries from the Logs and Traces explorers.
Creating a Dashboard from Scratch
- Navigate to Dashboards in the left sidebar
- Click Create Dashboard
- Enter a name for your dashboard
- Click Add Panel to add your first visualization
- Configure the panel query and visualization type (see below)
- Click Save to save the dashboard
Creating from Service Overview
You can add any performance chart from the Service Overview directly to a dashboard without writing a query. The underlying PromQL is extracted automatically.

- Navigate to Discover > Services and open a service
- On the Overview tab, hover over any chart panel
- Click the ⋮ menu in the top-right corner of the panel
- Select Add to Dashboard
- Choose to add to an existing dashboard or create a new one
- Provide a panel name and click Save
The following chart types are supported:
| Chart | Visualization added |
|---|---|
| APDEX Score | Time Series |
| Response Time | Time Series |
| Availability | Time Series |
| Throughput & Error Rate | Time Series |
| Error Distribution | Time Series |
Creating from Logs or Traces Explorer
You can promote aggregated queries from the Logs Explorer or Traces Explorer directly into dashboard panels.
- Build an aggregation query in the Logs Explorer or Traces Explorer
- Click the Add to Dashboard button
- Choose to create a new dashboard or add to an existing one
- Provide a descriptive panel name
- You will be redirected to the dashboard with your query added as a panel
For detailed instructions on building aggregation queries, see:
Panels
Panels are the building blocks of a dashboard. Each panel contains a query and a visualization.
Adding a Panel
- Open a dashboard and click Add Panel
- Choose a visualization type from the tabs at the top (Time Series, Bar Chart, Doughnut Chart, Gauge Chart, Stat, Table, Heatmap, or Status History)
- Select a telemetry type (Metrics, Logs, or Traces)
- Write your query using the appropriate query mode
- Configure panel options (legend, units, thresholds)
- Click Save to add the panel to your dashboard
Visualization Types
| Type | Description | Best For |
|---|---|---|
| Time Series | Line or area charts plotted over time | Monitoring trends, comparing metrics over time |
| Bar Chart | Vertical or horizontal bar charts, with optional stacking | Comparing categories, distribution analysis |
| Doughnut Chart | Pie/donut chart showing proportions | Percentage breakdowns, resource allocation |
| Gauge Chart | Dial indicator showing a single value against a range | Utilization metrics, threshold monitoring |
| Stat | Single prominent value display | Key metrics at a glance, counters |
| Table | Tabular data with sorting, filtering, and summaries | Detailed breakdowns, top-N analysis |
| Heatmap | Color-coded cells showing value density over time | Latency distributions, spotting outliers |
| Status History | Discrete state blocks per series over time | Up/down status, pass/fail checks over time |
Telemetry Types and Query Modes
Each panel supports different query modes depending on the selected telemetry type:
Metrics panels use PromQL:
rate(http_requests_total{service="api"}[5m])Logs panels support two modes — Builder for visual query construction, and LogQL for writing queries directly:
sum by (severity) (count_over_time({service="api"} [1m]))Traces panels use the Query Builder with filter and aggregate stages to query span data.
Query Modes
Each query can run in one of two modes:
| Mode | Description | Use Case |
|---|---|---|
| Range | Returns data points over a time range | Timeseries, bar charts, heatmaps |
| Instant | Returns a single data point at the current time | Stat panels, gauge panels, tables |
Panel Configuration
Chart Settings
These options are available under Chart Settings when editing a panel:
- Unit: Set the unit format for panel values (see Units below)
- Legend Type: Auto (uses the query name as the legend label) or Custom (lets you define your own legend label)
- Legend Placement: Bottom, Left, or Right
- Display Type: Line or Area (Time Series panels only)
Bar Chart Options
- Orientation: Vertical or horizontal bars
- Stacked: Enable stacking to show cumulative values
Table Settings
| Option | Description |
|---|---|
| Transpose | Swap rows and columns (max 20 columns when transposed) |
| Density | Compact or comfortable row spacing |
| Summary Footer | Display a summary row at the bottom |
| Summary Type | Aggregation for summary: sum, avg, min, max, first, last, count, p50, p90, p95, p99 |
| Thresholds | Color cells based on their values. Set a value, color, and target (Text or Background). Higher thresholds take precedence. Click + Add for multiple thresholds |
| Column Visibility | Show or hide individual table columns |
Units
Apply unit formatting to panel values. Select from the built-in units or type a custom unit:
| Unit | Format |
|---|---|
| Bytes (IEC) | KiB, MiB, GiB, TiB (factors of 1024) |
| Bytes (SI) | KB, MB, GB, TB (factors of 1000) |
| Bytes/sec (IEC) | KiB/s, MiB/s, GiB/s |
| Bytes/sec (SI) | KB/s, MB/s, GB/s |
| Nanoseconds | ns precision |
| Milliseconds | ms precision |
| Seconds | s precision |
You can also enter any custom unit (e.g., requests/s, %, ops) by typing directly into the unit field.
Layout
Panels can be repositioned by dragging the panel header and resized using the handles at the panel edges.
Sections
Add Section dividers to organize panels into named groups. Sections act as visual separators with a label, making it easier to navigate dashboards with many panels. You can drag panels between sections and reposition sections themselves by dragging.
Links
Links add navigation from a dashboard to another dashboard, a runbook, or any external page. Every link opens in a new tab.
Last9 supports three link surfaces. All three use the same editor.
| Surface | Where you configure it | Where it appears |
|---|---|---|
| Dashboard links | Dashboard Settings > Custom Links | The dashboard header menu |
| Panel links | Panel editor > Panel Links | The panel header menu |
| Data links | Panel editor > Data Links | When you click a data point on a chart |
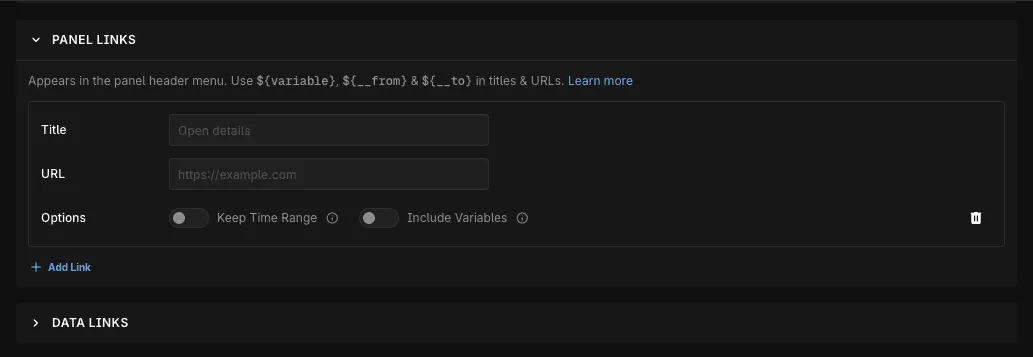
Adding a Link
- Open the Custom Links, Panel Links, or Data Links section
- Click Add Link
- Enter a Title — the text shown in the menu
- Enter the URL
- Under Options, optionally enable Keep Time Range and Include Variables
- Save the dashboard or the panel
Link Types
Dashboard links add a Type field with two choices. Panel links and data links are always a single URL.
- URL: a single address. The address can contain tokens, as described in Link Tokens.
- Dashboards with tags: a submenu that lists every other dashboard carrying all of the tags you select. The submenu is labelled with those tags. A dashboard gets its tags in Edit > Tags, and tags are case insensitive. If no dashboard matches, the link does not appear.
Link Options
| Option | Effect |
|---|---|
| Keep Time Range | Adds the dashboard time range to the URL as from and to parameters |
| Include Variables | Adds the selected dashboard variable values to the URL as parameters |
Both options skip a parameter that the URL already sets. For example, if the URL ends with ?from=now-1h, then Keep Time Range does not overwrite that value.
For a Dashboards with tags link, both options apply to every dashboard the submenu opens.
Link Tokens
A token is a placeholder that Last9 replaces with a live value. Tokens work in the Title field and in the URL field. Both ${name} and $name are accepted.
| Token | Resolves to |
|---|---|
${variable} | A dashboard variable value. Multiple values join with commas |
${variable:queryparam} | The same variable as var-name=value&var-name=value2 |
${__from}, ${__to} | The start and the end of the dashboard time range |
${__url_time_range} | The full range as from=...&to=... |
${__value.raw} | The value of the data point you clicked |
${__value.text} | The same value, formatted for display |
${__value.time} | The timestamp of the data point you clicked, in milliseconds |
${__series.name} | The name of the series you clicked |
${__field.labels.<label>} | A label on the data point you clicked, for example ${__field.labels.service} |
${__data.fields.<label>} | An alias of ${__field.labels.<label>} |
For example, this data link searches an internal runbook for the service behind the point you clicked, over the dashboard’s time range:
https://runbooks.internal.example.com/search?q=${__field.labels.service:percentencode}&${__url_time_range}Use :percentencode on any value that lands inside a query parameter, so a value containing a space or a slash still produces a valid URL.
To link to a view inside Last9, open that view, copy the URL from the address bar, and replace the part you want to make dynamic with a token. The address bar is the source for those query parameters.
Link Limits
- The data point tokens —
${__value.raw},${__value.text},${__value.time},${__series.name},${__field.labels.<label>}, and${__data.fields.<label>}— resolve in data links only. Only a data link carries a clicked point. A dashboard link or a panel link that uses one of these tokens never resolves. - If any token in a URL does not resolve, Last9 drops the link and does not show it. A title behaves differently: an unresolved token renders as blank text, and an empty title falls back to
Open link. - Last9 allows the
http:and thehttps:schemes only. It checks the scheme before and after token substitution, and rejects every other scheme.
Troubleshooting
Please get in touch with us on Discord or Email if you have any questions.