
Product
Change Events
Track deployment and configuration change events in Last9 to correlate them with service performance, error rates, and reliability metrics.
Why Change Events Matter?
Software systems and their observability are not just about the telemetry data emitted from these systems. The software systems also get affected by external change events. These events can be from domains such as deployment, configuration, or external 3rd party systems. Last9 allows tracking such change events along with other metrics, seamlessly providing more context to the system observability.
Every deployment, configuration tweak, and external change ripples through your system. Last9 Change Events capture these moments and overlay them directly onto your performance metrics, giving you the context to:
- Spot performance dips exactly when deployments hit
- Correlate configuration changes with error spikes
- Validate whether a new release is performing as expected
- Share complete system context with your team in one glance
This document will show how to start tracking change events with Last9.
How It Works
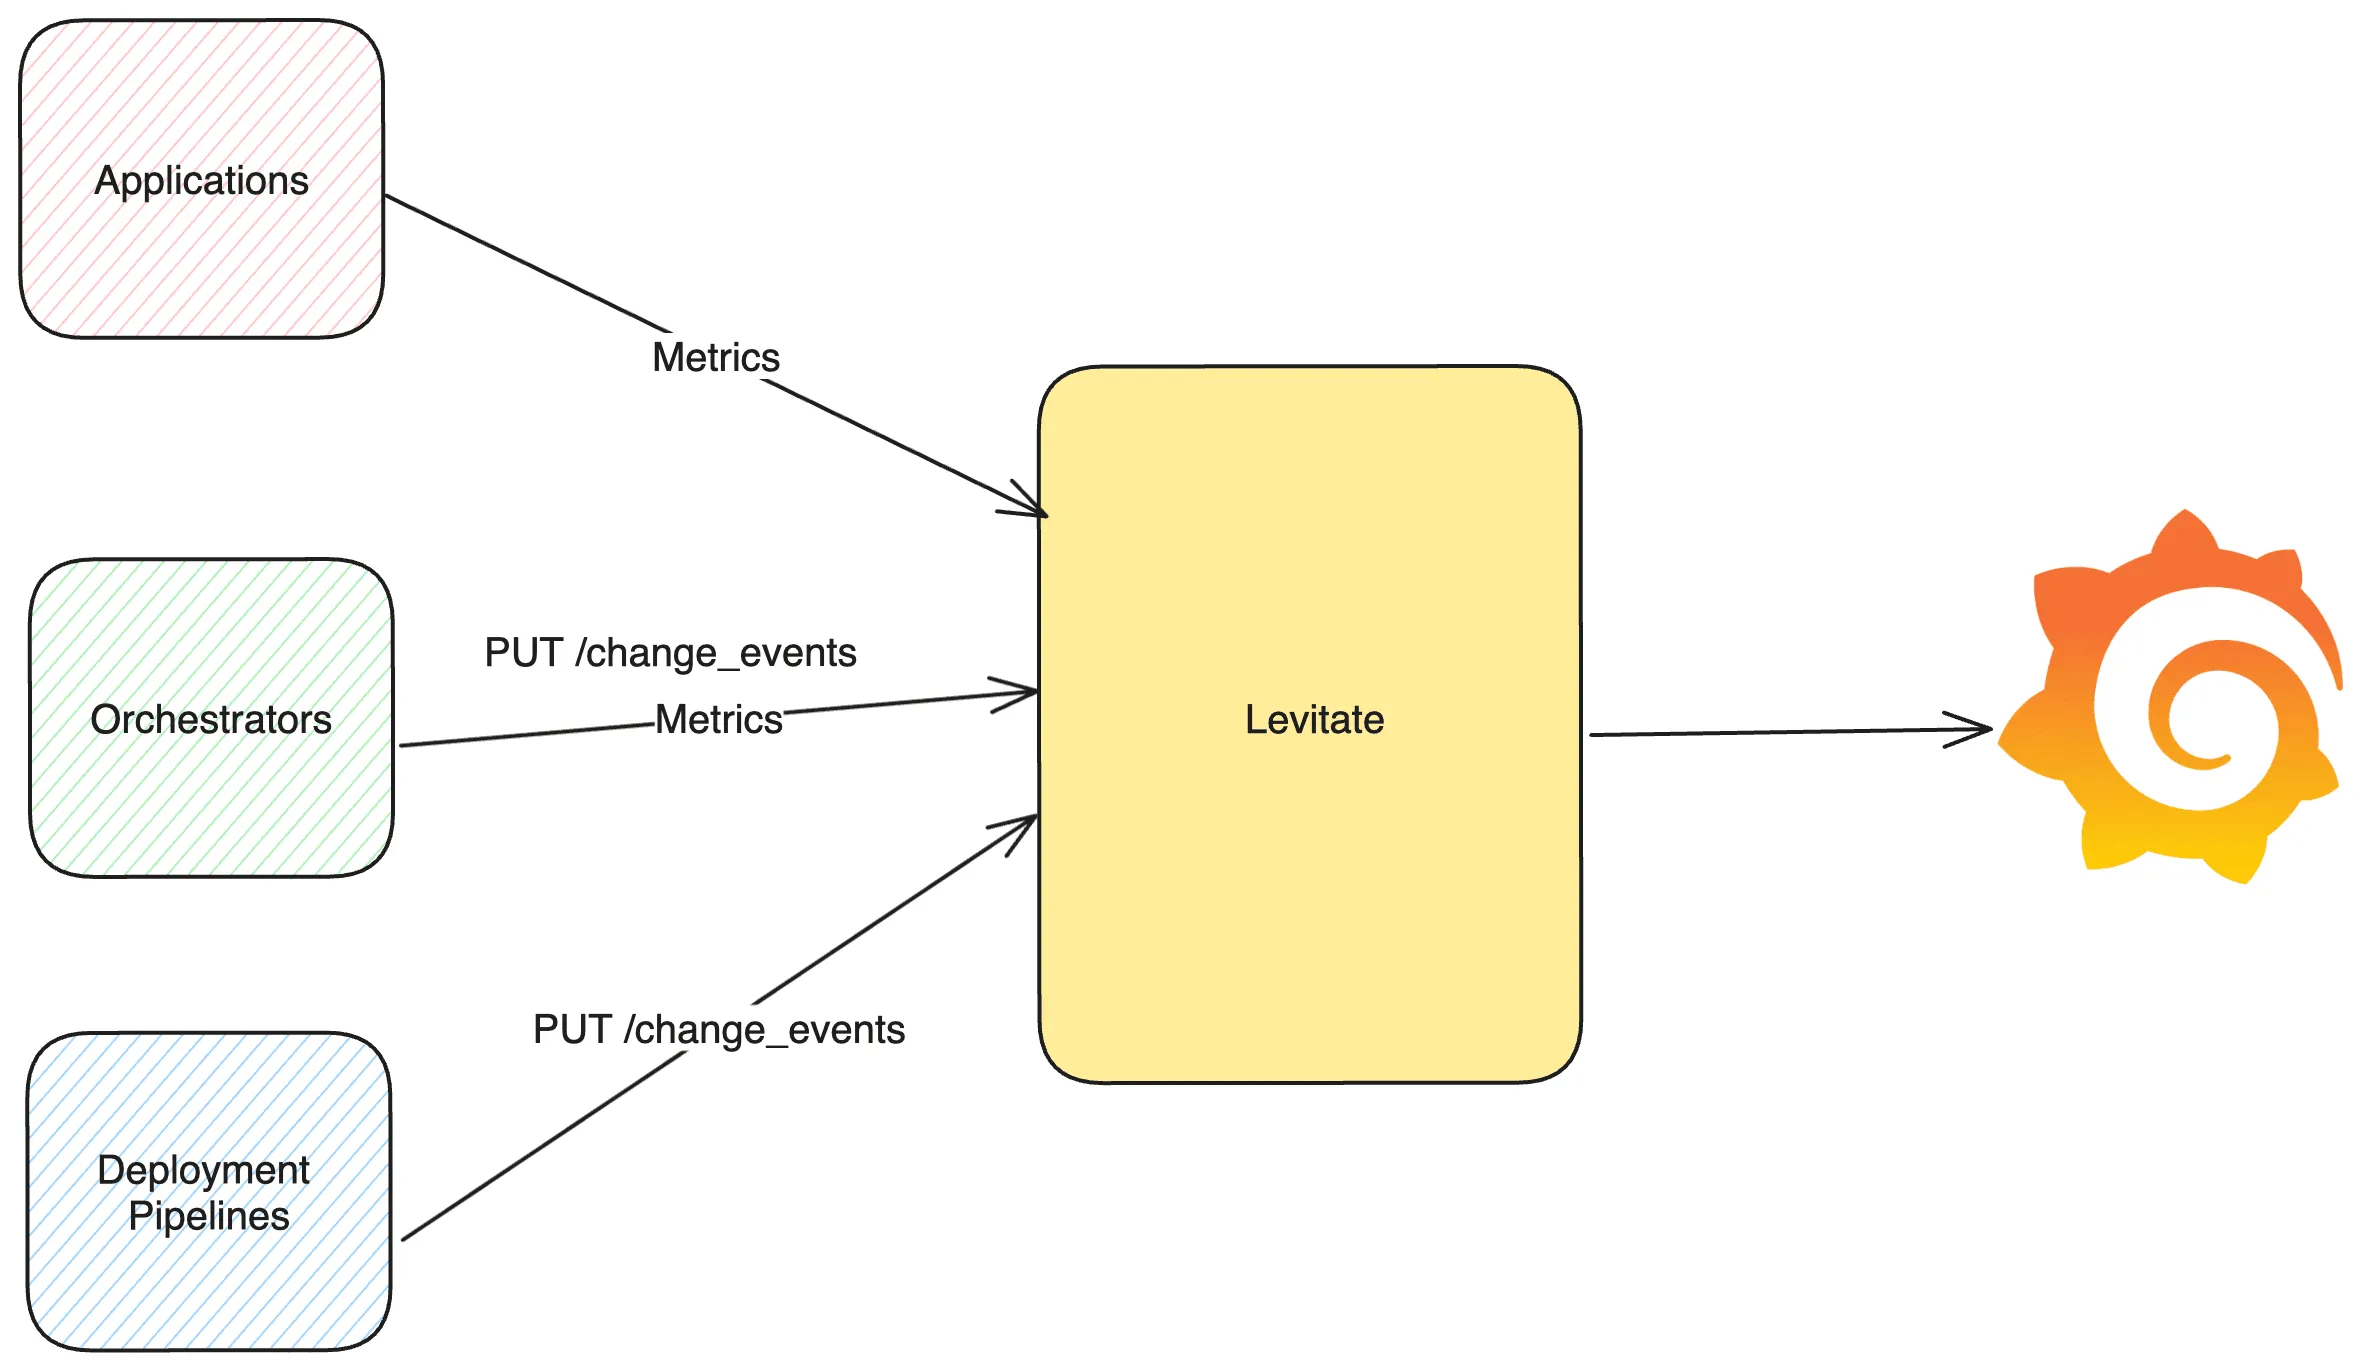
Last9 offers an HTTP API that can be used to track any domain change event. Each event has two states, start and stop, and both can be tracked with Last9. Once Last9 receives the event, it converts it into a metric that can be used with other metrics for querying using PromQL in Grafana dashboards or alerting.
The data flow for change events is as follows.
Last9 Change Events API
Last9 offers a REST HTTP endpoint that can be used to send the change events. The API endpoint is as follows.
curl -XPUT https://app.last9.io/api/v4/organizations/{org_slug}/change_events \--header 'Content-Type: application/json' \--header 'X-LAST9-API-TOKEN: Bearer <LAST9_API_WRITE_TOKEN>' \--data-raw '{ "timestamp": "2024-01-15T17:57:22+05:30", "event_name": "new_deployment", "event_state": "start", "data_source_name": "{your_cluster_name}", "attributes": { "service_name": "frontend", "deployment_environment": "production", "version": "v2.1.4", "team": "platform", "change_type": "hotfix" }}'API Parameters
| Field | Description | Required |
|---|---|---|
timestamp | ISO8601 formatted timestamp of the event. Defaults to current time if not provided | No |
event_name | Custom event identifier. Added as a label to the resulting time series | Yes |
event_state | start or stop — marks when deployments/changes begin and complete. Defaults to start if not provided | No |
attributes | Key-value pairs used as labels while converting the change event to a metric | No |
data_source_name | Name of the Last9 cluster where events will be stored. See Change Events Storage | No |
Last9 will convert the events into a metric named last9_change_events.
Visualize Change Events in Service Dashboards
After pushing a change event, navigate to your service dashboard. If service_name and deployment_environment match your APM data, the change event appears as a contextual overlay on all performance charts:

What you’ll see:
- Red vertical line marking your exact deployment time
- Rich context popup with all your event details (version, team, change type)
- Performance correlation across APDEX, response time, and throughput charts
- Error patterns before, during, and after changes
This lets you instantly answer questions like:
- Did response time spike after deployment?
- Is the new release performing as expected?
- Which specific configuration change caused the error spike?
Visualize Change Events in Grafana
The change events can also be visualized in Grafana just like any other metrics. Query change events using PromQL:
last9_change_events{event_name="new_deployment", deployment_environment="production"}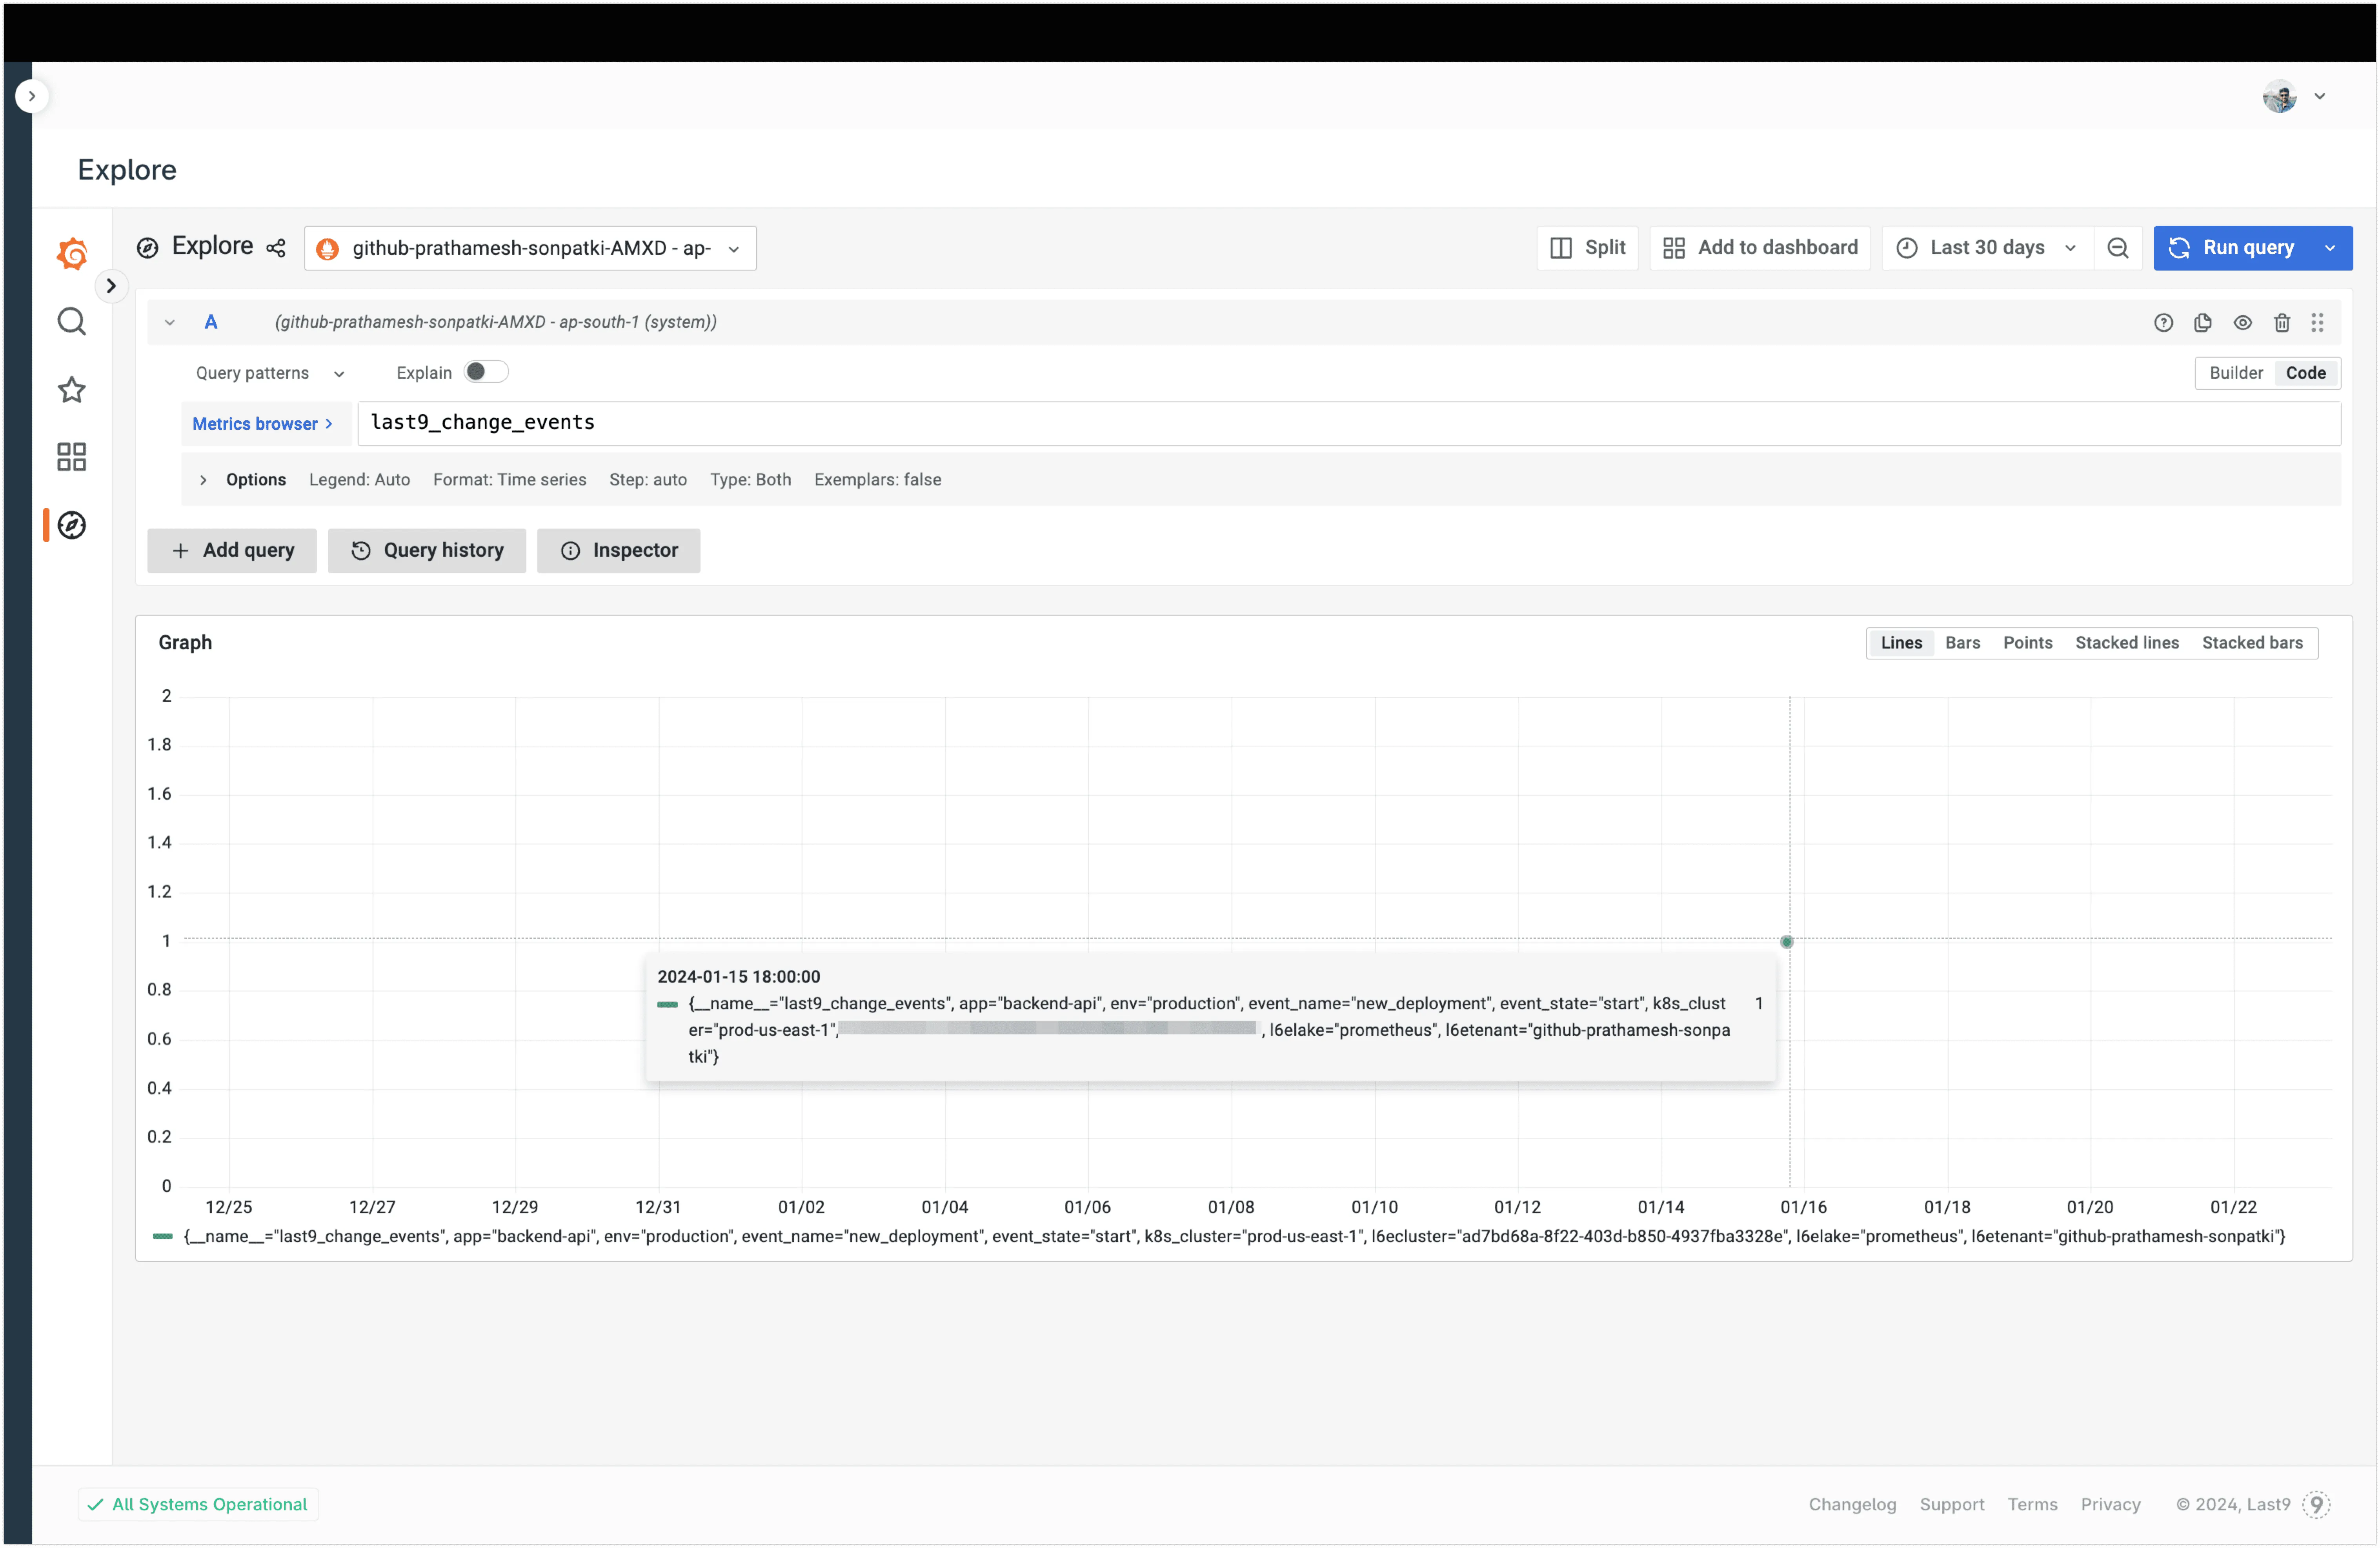
Change Events Storage
It is possible that you might be using multiple Last9 clusters. In such scenario, you can choose to store the change events in a Last9 cluster of your choice. The optional data_source_name attribute is used to specify the cluster where change event will be stored.
If this attribute is not passed, then Last9 will store the change event in a default cluster designated for change events. The default cluster for change events is set as follows.

You can override this by specifying the data_source_name in the request payload. Obtain the cluster name from the Data Sources section as follows.


Event Naming Best Practices
Use consistent, descriptive names for your events:
deployment_start/deployment_complete— for application deploymentsconfig_update_redis— for configuration changesfeature_flag_toggle— for feature flag changesdb_migration_start/db_migration_complete— for database migrations
Add meaningful context through attributes:
{ "service_name": "frontend", "deployment_environment": "production", "version": "v2.1.4", "team": "platform", "change_type": "hotfix"}Migrating to Last9 Change Events
If you’re already tracking deployments with another observability tool, the table below maps common concepts to their Last9 equivalents. This makes it straightforward to replace your existing deployment event calls with the Last9 API.
Concept Mapping
| Concept in other tools | Last9 equivalent |
|---|---|
| Events API / Custom Events / DORA Deployment API | PUT /api/v4/organizations/{org_slug}/change_events |
| Deployment markers / Annotations / Markers | Change Events with event_state: start and event_state: stop |
version / commit / build_id tag | attributes.version |
service / entityGuid / dataset slug | attributes.service_name |
env / environment tag | attributes.deployment_environment |
| Event tags / dimensions / properties | attributes (any key-value pairs) |
| GraphQL mutations / typed deployment fields | Single REST PUT with flexible JSON body |
| Visual-only annotations on dashboards | PromQL-queryable metric (last9_change_events) with automatic service dashboard overlays |
| Region annotations / time-range markers | Separate start and stop events for the same event_name |
What’s Different in Last9
-
Events become metrics. Unlike visual-only annotations or markers, Last9 converts every change event into a Prometheus metric (
last9_change_events). This means you can query, alert, and build recording rules on deployment events using PromQL — not just view them on a chart. -
No entity pre-registration required. Some tools require the target service to already exist before you can record a deployment against it. Last9 accepts events for any
service_nameimmediately. -
No timestamp restrictions. Some tools limit event timestamps to 18–24 hours in the past. Last9 accepts any valid ISO8601 timestamp.
-
Automatic service dashboard correlation. When
service_nameanddeployment_environmentmatch your APM data, change events automatically appear as overlays on APDEX, response time, throughput, and error charts — no manual dashboard configuration needed. -
Flexible attributes instead of rigid schemas. Instead of fixed fields like
deploymentTypeorentityGuid, Last9 uses open-endedattributes. Add any key-value pairs relevant to your workflow (team,change_type,rollback,ticket_id, etc.).
Example: Replacing an Existing Integration
If you’re currently sending deployment events via a POST to another provider’s API, the migration is typically a one-line change in your CI/CD pipeline. If you’re using GitHub Actions, the Last9 Deployment Marker action handles this for you without any custom curl steps.
# Replace your existing deployment event call with:curl -XPUT https://app.last9.io/api/v4/organizations/{org_slug}/change_events \--header 'Content-Type: application/json' \--header 'X-LAST9-API-TOKEN: Bearer <LAST9_API_WRITE_TOKEN>' \--data-raw '{ "event_name": "deployment", "event_state": "start", "attributes": { "service_name": "'"$SERVICE_NAME"'", "deployment_environment": "'"$DEPLOY_ENV"'", "version": "'"$GIT_SHA"'", "team": "'"$TEAM"'" }}'Native Integrations for Change Events
Alerting on Stuck States
A common pattern is to send a start event when an entity enters a state and a stop event when it leaves. You can use change events to alert when an entity has been stuck in a state longer than expected — for example, a job that has been queued for more than 4 hours.
How It Works
When you push a change event, Last9 stores it as a metric data point. The event’s original timestamp (from the API payload) is preserved as the sample timestamp in the time series database. If timestamp is omitted, the ingestion time is used instead.
timestamp(metric[window])returns the actual time the event was pushed.time() - timestamp(metric[window])correctly computes elapsed time since the event was pushed.
To also handle auto-resolution when the stop event arrives, combine the duration expression with an unless on(<entity_id>) clause.
The Correct Pattern
The PromQL expression computes how long each entity has been stuck, and returns no value (resolving the alert) for entities that have received a stop event.
( time() - timestamp( last9_change_events{ event_name="<your_event_name>", state="<your_state>", event_state="start" }[<lookback_window>] ))unless on(<entity_id_label>)last_over_time( last9_change_events{ event_name="<your_event_name>", state="<your_state>", event_state="stop" }[<lookback_window>])Set the alert rule threshold to greater than <seconds> — for a 4-hour threshold, use greater than 14400.
Alternative Pattern: count_over_time
If your system pushes a periodic heartbeat start event (rather than a single event on state entry), use the count_over_time subquery pattern instead. It counts how many 1-minute windows over the threshold period show the entity stuck, and is robust to multiple pushes.
count_over_time( ( last_over_time( last9_change_events{ event_name="<your_event_name>", state="<your_state>", event_state="start" }[5m] ) unless on(<entity_id_label>) last_over_time( last9_change_events{ event_name="<your_event_name>", state="<your_state>", event_state="stop" }[5m] ) )[<threshold_duration>:1m])Set the alert rule threshold to greater than or equal to <minutes> — for a 4-hour threshold, use greater than or equal to 240 (4 × 60 minutes) with [4h:1m] as the subquery window.
Example: Alert When a Job Is Stuck for More Than 4 Hours
Suppose your system sends change events with event_name="job_lifecycle" and an entity_id attribute identifying each job.
Send the start event when the job enters the queued state:
curl -XPUT https://app.last9.io/api/v4/organizations/{org_slug}/change_events \--header 'Content-Type: application/json' \--header 'X-LAST9-API-TOKEN: Bearer <LAST9_API_WRITE_TOKEN>' \--data-raw '{ "event_name": "job_lifecycle", "event_state": "start", "attributes": { "state": "queued", "entity_id": "job-abc123", "environment": "production" }}'Send the stop event when the job leaves the queued state:
curl -XPUT https://app.last9.io/api/v4/organizations/{org_slug}/change_events \--header 'Content-Type: application/json' \--header 'X-LAST9-API-TOKEN: Bearer <LAST9_API_WRITE_TOKEN>' \--data-raw '{ "event_name": "job_lifecycle", "event_state": "stop", "attributes": { "state": "queued", "entity_id": "job-abc123", "environment": "production" }}'Alert rule PromQL:
( time() - timestamp( last9_change_events{ event_name="job_lifecycle", state="queued", event_state="start" }[12h] ))unless on(entity_id)last_over_time( last9_change_events{ event_name="job_lifecycle", state="queued", event_state="stop" }[12h])Set the alert rule threshold to greater than 14400 (14400 seconds = 4 hours). The alert fires per entity_id once a job has been stuck in queued for more than 4 hours. It auto-resolves when the stop event is received.
Lookback Window Sizing
Each change event is written as a single sample in the time series database — there is no automatic refresh. As time passes, that sample ages. The lookback window in timestamp() and last_over_time() controls how far back Last9 looks for that sample.
If the window is smaller than the age of the sample, the series disappears from the query result entirely — the entity is no longer found, and the alert silently stops firing even though the entity is still stuck.
Example: A job got stuck 20 hours ago. Its start event sample is 20h old.
- With
[12h]: the sample is outside the window → job not found → alert never fires - With
[48h]: the sample is within the window → job appears → alert fires correctly
The lookback window must be larger than the maximum time an entity can be stuck before you want to detect it.
| Alert threshold | Minimum recommended lookback |
|---|---|
| 1h | 6h |
| 4h | 12h |
| 12h | 48h |
| 24h | 72h |
A lookback of 3–4× the alert threshold is a safe rule of thumb.
Auto-Resolution
When a stop event is received for a given entity_id, the unless on(entity_id) clause removes that entity from the firing set at the next evaluation. The alert resolves automatically — no manual intervention needed.
If a stop event is never sent (for example, the job crashes without a cleanup step), the alert will keep firing until a stop event is pushed manually.
Per-Entity Resolved Notifications
When “Group Timeseries Notifications” is disabled (the default), each entity gets its own independent notification lifecycle:
- A firing notification is sent when an entity crosses the threshold.
- A resolved notification is sent when that entity’s stop event arrives and it drops from the query result.
If “Group Timeseries Notifications” is enabled, all matching timeseries are batched into a single notification. The resolved notification is then only sent when all entities have resolved — a single long-stuck entity will suppress resolved notifications for all others that have already recovered.
Troubleshooting
Please get in touch with us on Discord or Email if you have any questions.