
Product
Discover Databases
Database-centric view of every datastore your services query — throughput, errors, and latency per database, derived from the trace spans your applications already emit
The Databases feature in Discover gives you a database-centric view of every datastore your services talk to. Instead of starting from a service and drilling into its database calls, start from the database itself: see which datastores carry the most load, which are erroring, and which services drive that traffic.
Discover Databases is built entirely from the database client spans your instrumented services already emit — the db.system and net.peer.name attributes on spans identify each datastore. There is nothing to install on the database server.
Prerequisites
Your services need OpenTelemetry instrumentation that records database client spans. Most language auto-instrumentations do this out of the box for common drivers. See the database integrations for instrumentation guides per database and language.
If a service’s database calls appear in its Traces, the databases it queries will appear here.
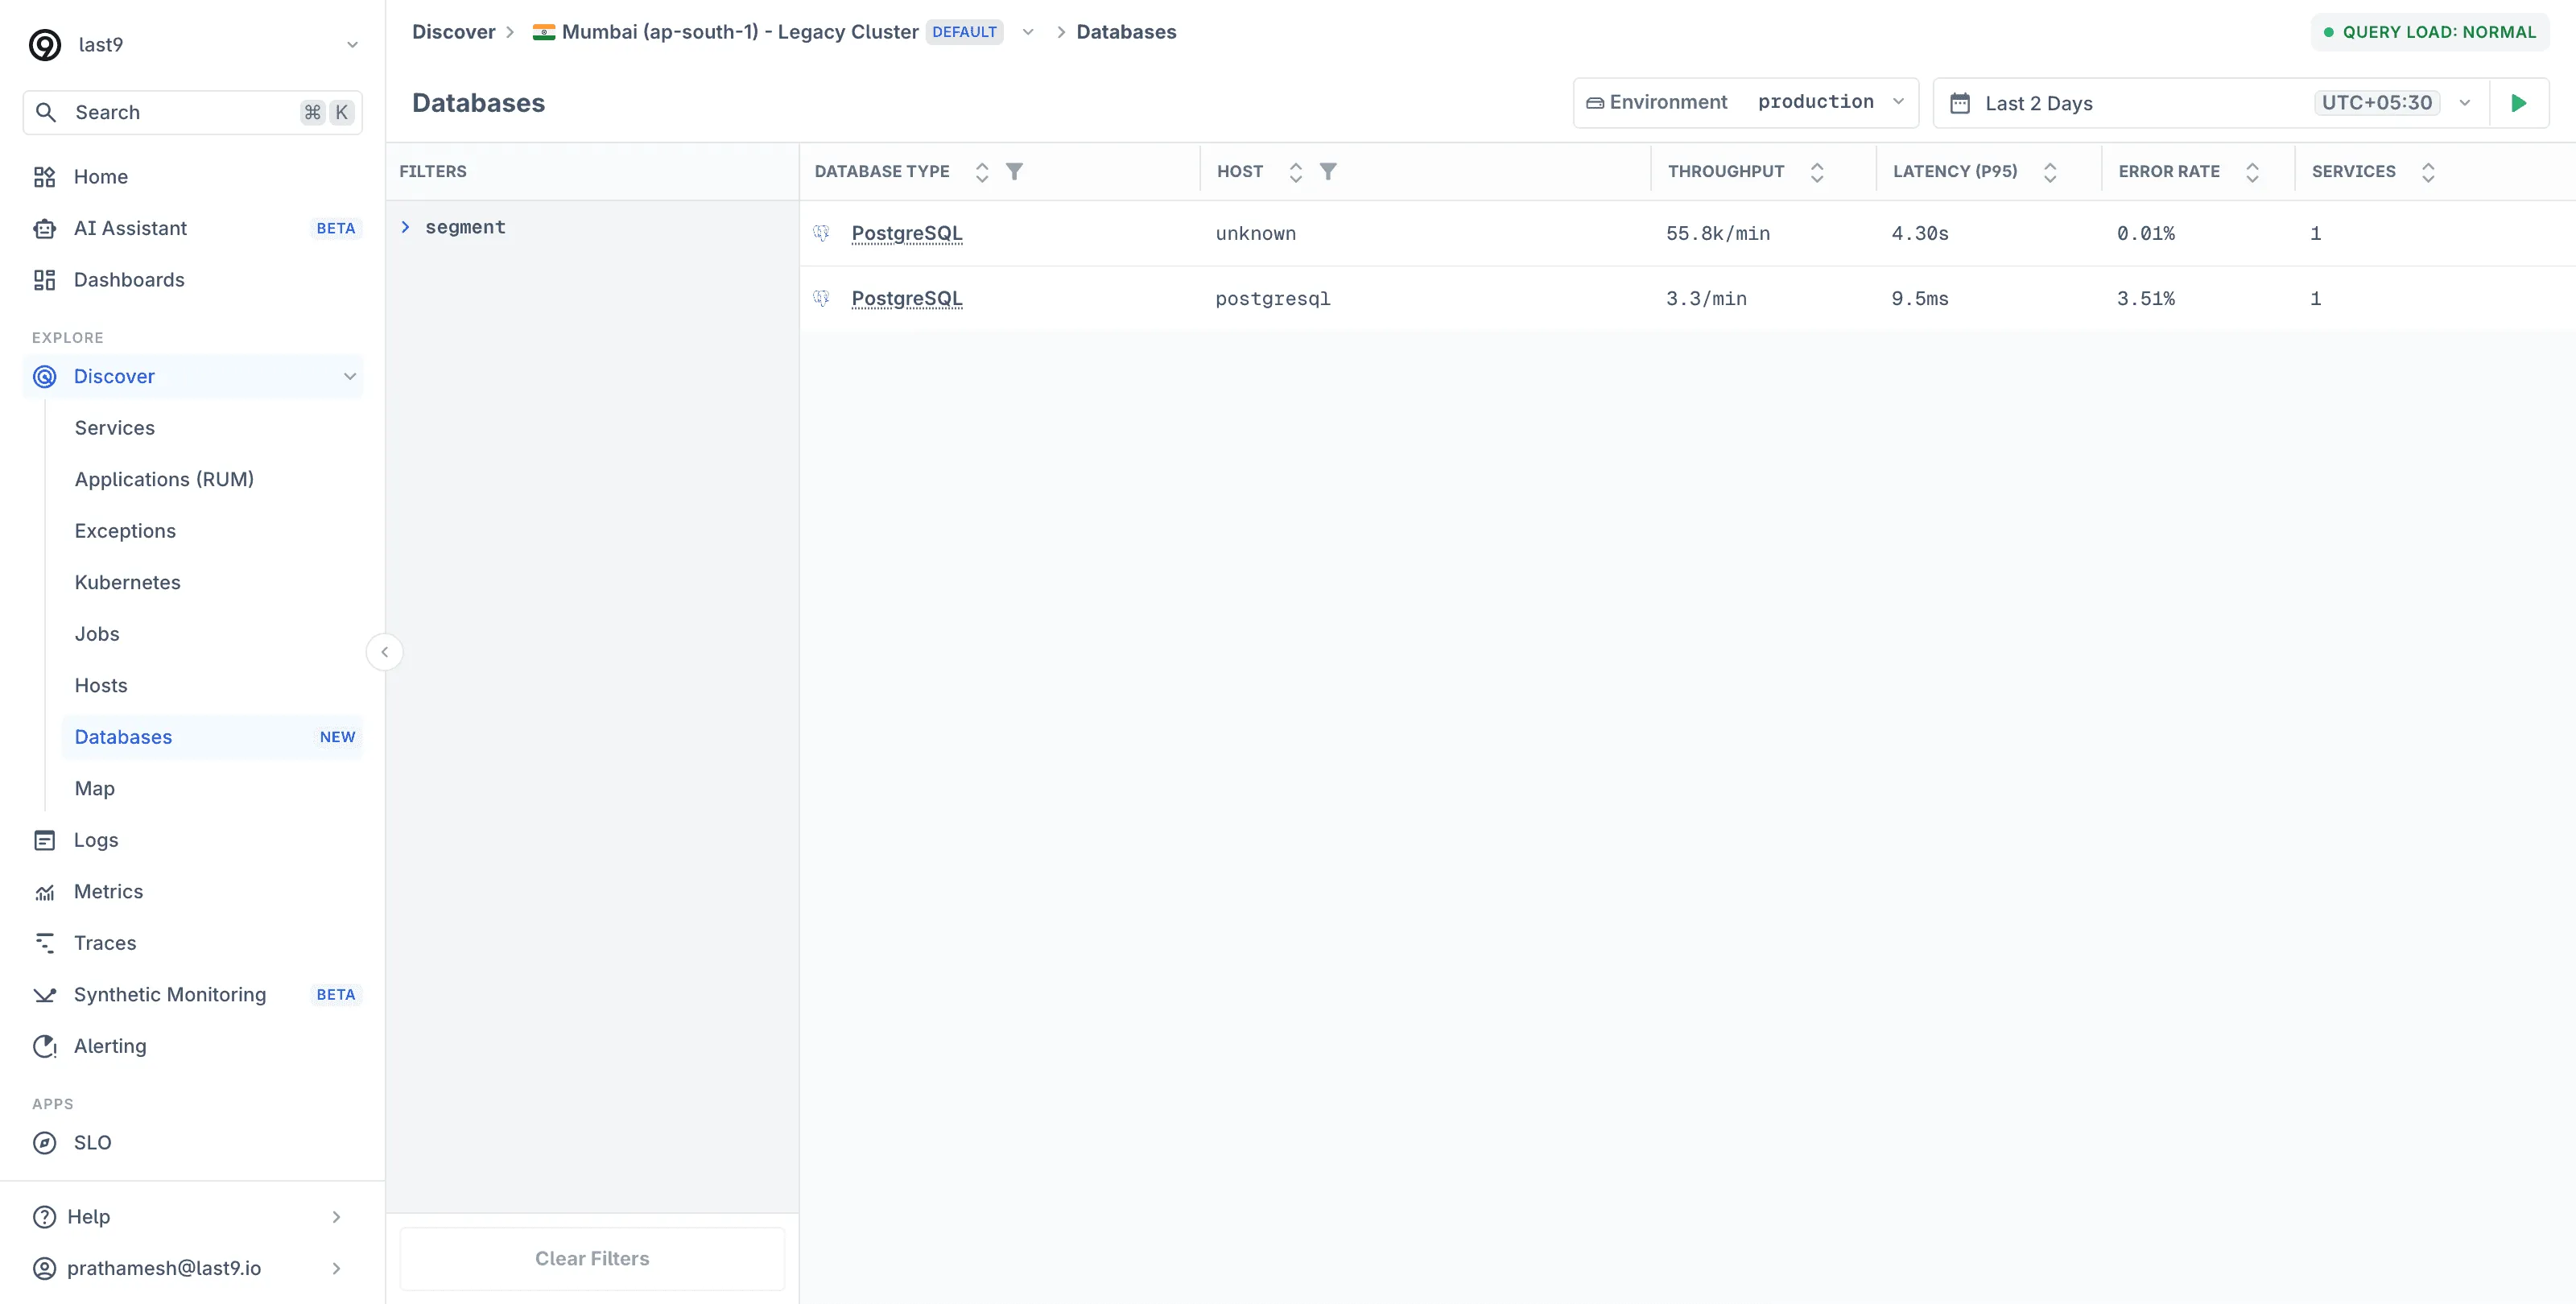
Understanding the Databases View
Open Discover → Databases to see the datastores detected from your trace data. Last9 automatically detects databases across technologies — MySQL, PostgreSQL, MongoDB, Redis, Aerospike, and any other system that database client spans report via db.system.
Each row in the list shows:
| Column | Description |
|---|---|
| Database Type | The datastore technology, from the db.system attribute |
| Host | The database host, from net.peer.name |
| Throughput | Query rate per minute |
| Latency (P95) | 95th-percentile query response time |
| Error Rate | Percentage of failed database calls |
| Services | Number of services querying this datastore |
Sort by any column, or use the left-side filters to narrow by database type or host.
Database Detail View
Click a database to open its detail view, organized into Overview, Queries, Services, Infrastructure, Logs, and Traces tabs.
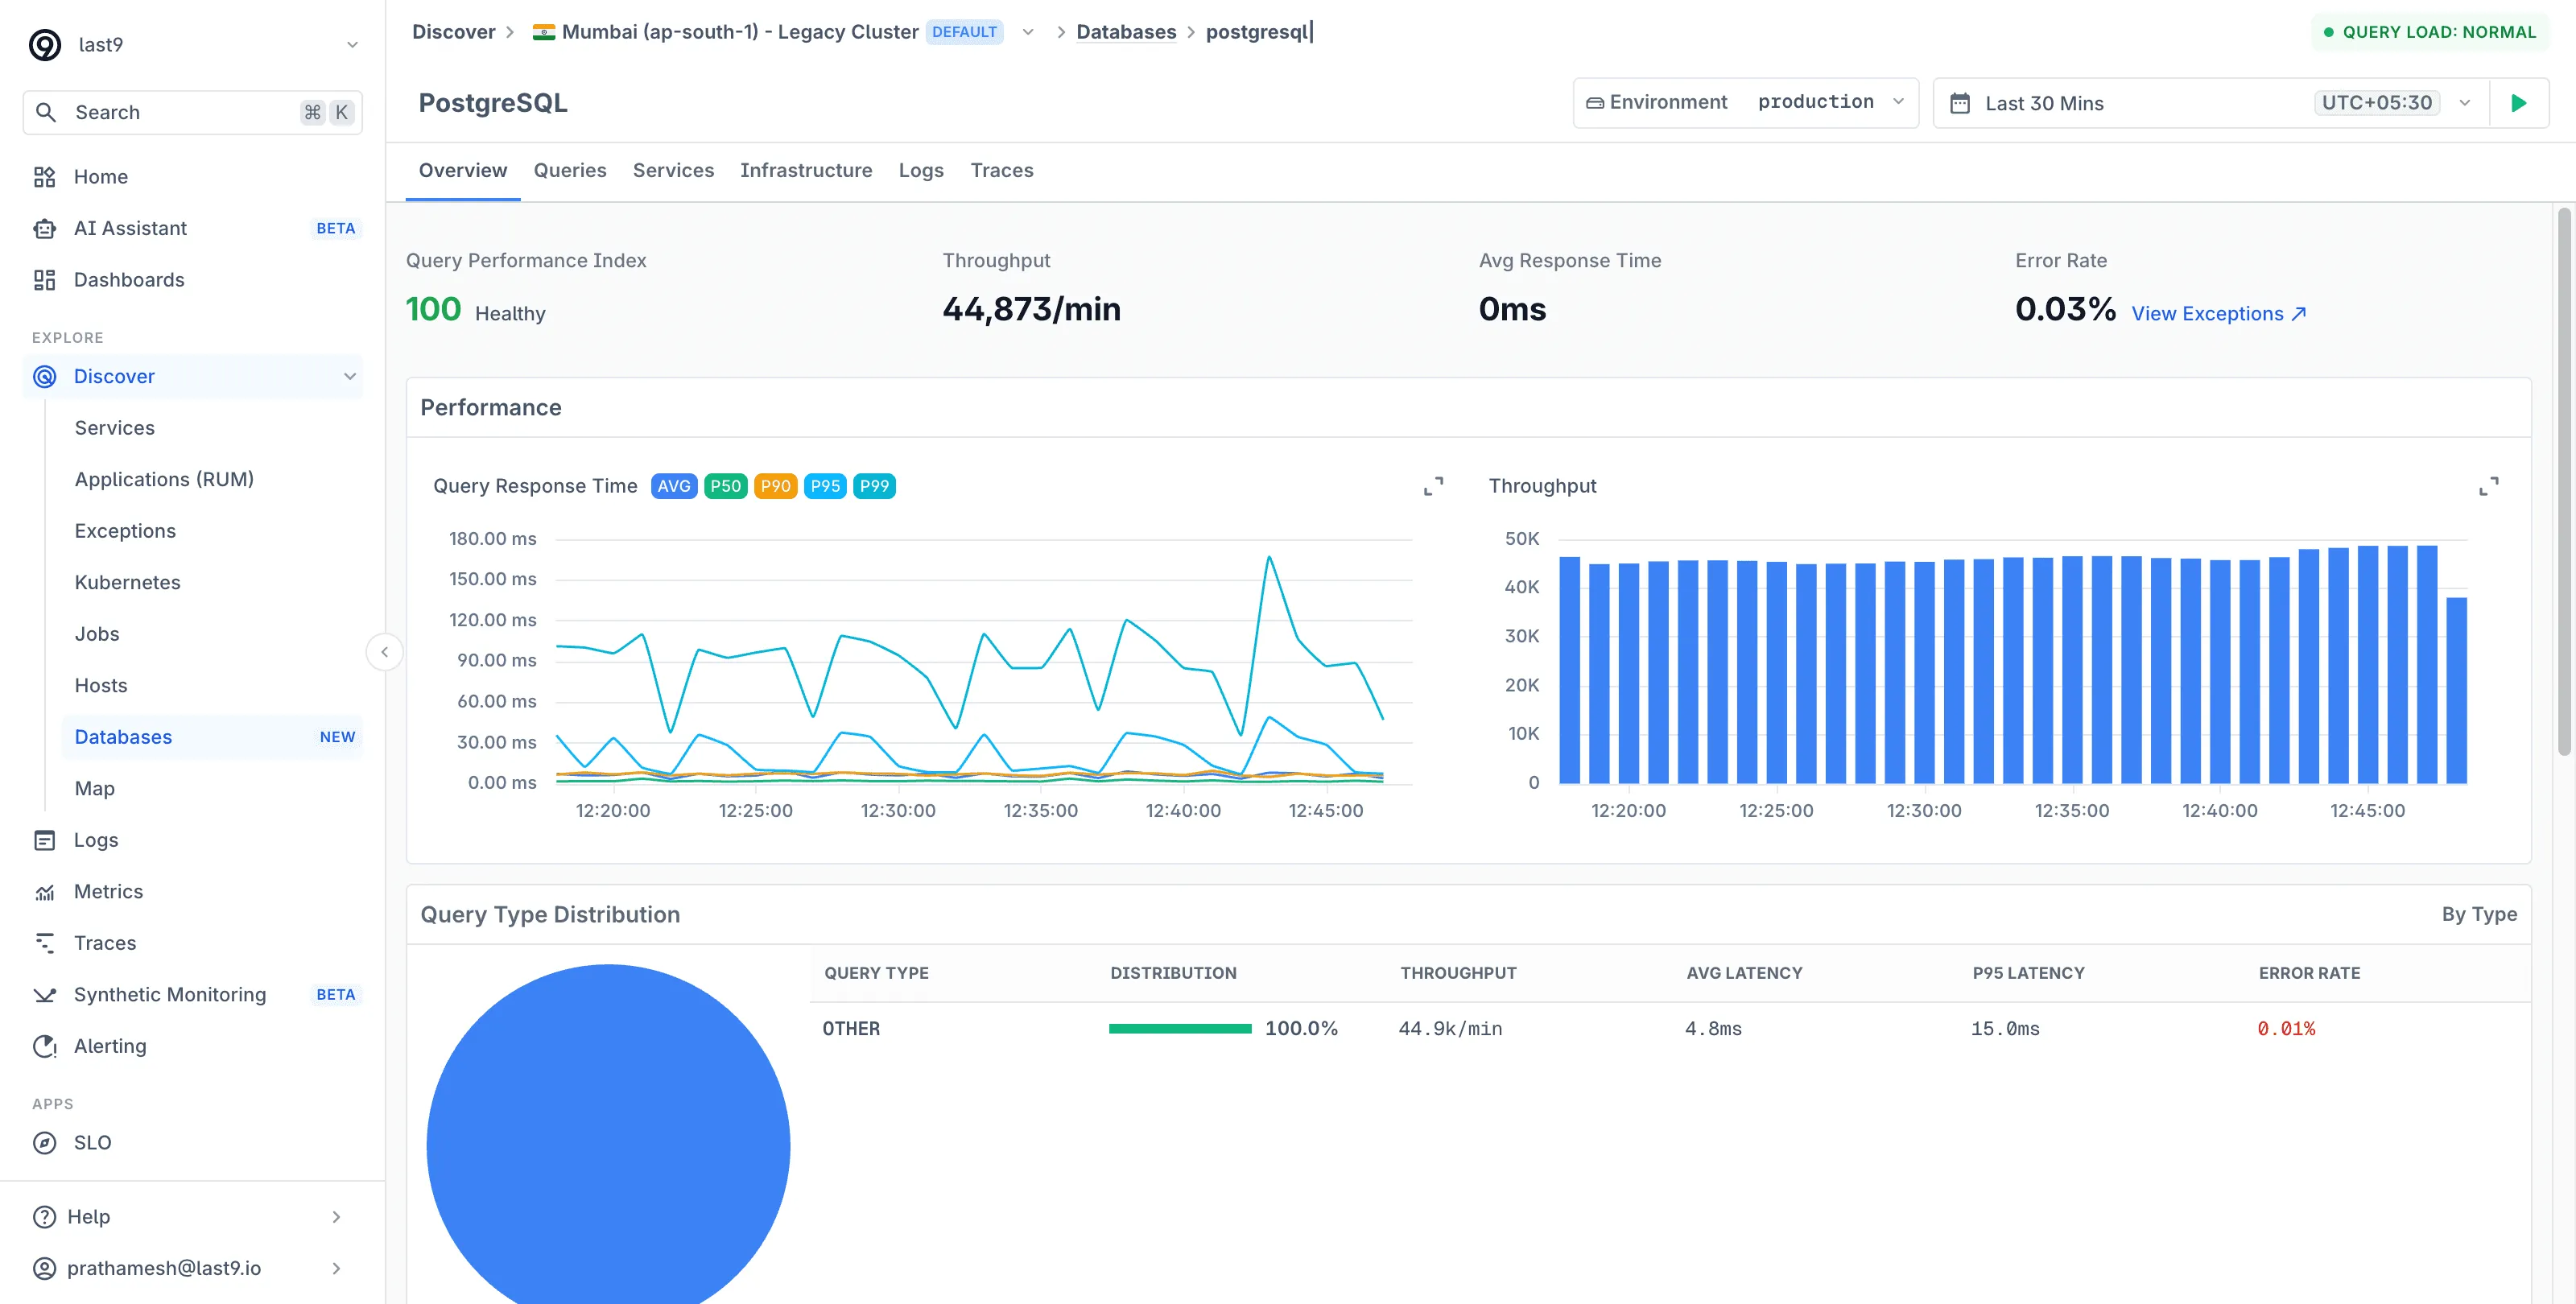
The Overview tab reports:
- Query Performance Index: A single health score for the datastore, with summary cards for throughput, average response time, and error rate
- Performance charts: Query response time (AVG, P50, P90, P95, P99) and throughput over the selected range
- Query Type Distribution: Per-operation breakdown with throughput, average and P95 latency, and error rate
- Top 10 Slowest Queries and Top 10 Most Frequent: Each query links to its correlated traces, pre-filtered by span name,
db.system, andnet.peer.name - Top 10 Services by Load: Which services drive the query volume — each links to that service’s Database tab
- Recent Slow Query Samples: Actual query text from traces, with execution time
From Database to Service and Back
Discover Databases and the per-service Database tab are two views of the same data:
- Start from a service when the symptom is service latency and you suspect a query.
- Start from a database when the symptom is datastore-wide — connection saturation, a slow replica, a hot table — and you need to know every service contributing load.
Best Practices
- Watch P95 per operation, not per database. A healthy average hides one slow
UPDATEpath. The per-operation breakdown isolates it. - Use the trace pivot for slow queries. A slow query’s correlated traces show the full request context — which endpoint triggered the query and what else the request did.
- Check fan-in before scaling up. If one database shows load from many services, the Top Services by Load table tells you whether one consumer is responsible before you reach for a bigger instance.
Troubleshooting
- A database is missing from the list: confirm the querying service emits database client spans — open the service’s Traces and look for spans with a
db.systemattribute. If the service itself is missing, see Discover Services prerequisites.
Please get in touch with us on Discord or Email if you have any questions.