
Product
Claude Code
Send Claude Code session telemetry — prompts, tool calls, API costs, and errors — to Last9 via OpenTelemetry.
Claude Code emits structured telemetry for every developer session: prompts submitted, tools invoked, API calls made, and costs incurred. Routing this data to Last9 lets you analyze AI usage patterns, track per-user spend, audit tool decisions, and alert on error rates — all within your existing observability stack.
Claude Code exports three OpenTelemetry signal types:
- Logs — individual events per prompt, API call, tool execution, and error
- Metrics — aggregated counters for cost, tokens, sessions, and code edits
- Traces (beta) — span-based correlation linking a prompt to all its API calls and tool executions
What gets exported
Logs (events)
Claude Code exports five event types as OpenTelemetry log records. All share a prompt.id UUID that lets you reconstruct the full sequence for a single user interaction.
| Event | Emitted when | Key attributes |
|---|---|---|
claude_code.user_prompt | User submits a prompt | prompt.length, session.id, user.email |
claude_code.api_request | Claude API responds | llm.usage.total_tokens, cost_usd, model, duration_ms |
claude_code.api_error | API call fails | error.message, http.status_code, retry_attempt |
claude_code.tool_result | Tool execution completes | tool.name, tool.success, duration_ms, bash.command |
claude_code.tool_decision | Permission prompt resolved | tool.name, tool.decision (accept/reject), decision.source |
Metrics
Claude Code exports eight counters as OpenTelemetry metrics. These are aggregated — no per-prompt IDs — making them low-cardinality and suitable for dashboards and alerts.
| Metric | Unit | Key attributes |
|---|---|---|
claude_code.session.count | count | session.id, user.email, app.version |
claude_code.cost.usage | USD | model, user.email |
claude_code.token.usage | tokens | type (input/output/cacheRead/cacheCreation), model |
claude_code.lines_of_code.count | count | type (added/removed) |
claude_code.pull_request.count | count | standard attributes |
claude_code.commit.count | count | standard attributes |
claude_code.code_edit_tool.decision | count | tool_name, decision (accept/reject), source, language |
claude_code.active_time.total | seconds | type (user/cli) |
Traces (beta)
Claude Code v2.1.139+ exports OTel spans when both CLAUDE_CODE_ENHANCED_TELEMETRY_BETA=1 and OTEL_TRACES_EXPORTER=otlp are set. Each user prompt starts a claude_code.interaction root span; API calls, tool executions, and hook runs become children.
| Span | Emitted for | Key attributes |
|---|---|---|
claude_code.interaction | One per user prompt | session.id, user.email, prompt.id |
claude_code.llm_request | Each Anthropic API call | gen_ai.request.model, gen_ai.response.id, input_tokens, output_tokens, cache_read_tokens, cache_creation_tokens, agent_id, parent_agent_id, llm_request.context |
claude_code.tool | Each tool invocation (parent span) | tool.name, prompt.id |
claude_code.tool.blocked_on_user | Time waiting on permission prompt | tool.name |
claude_code.tool.execution | Actual tool work | tool.name, success, duration_ms |
claude_code.hook | Hook executions (requires detailed beta tracing) | hook.name, hook.event |
Subagent attribution. When the Task tool spawns a subagent, the subagent’s claude_code.llm_request spans carry:
agent_id— unique identifier of the subagent (absent on main-thread spans)parent_agent_id— identifier of the agent that spawned this one (absent for main session and for direct children of main)llm_request.context—interactionfor main-thread calls,standalonefor subagent calls
Prerequisites
- Last9 account — Sign up at app.last9.io
- Claude Code — Installed and authenticated (
claude --versionshould work) - OTLP credentials — Get your endpoint and auth header from Integrations → OpenTelemetry
Setup
-
Get your Last9 OTLP credentials
Navigate to Integrations → OpenTelemetry in your Last9 dashboard. Copy:
- OTLP Endpoint (e.g.,
https://otlp-aps1.last9.io:443) - Authorization header (e.g.,
Basic <base64-token>)
- OTLP Endpoint (e.g.,
-
Set environment variables
Add the following to your shell profile (
~/.zshrc,~/.bashrc, or equivalent):# Required: enable Claude Code telemetryexport CLAUDE_CODE_ENABLE_TELEMETRY=1# Export logs, metrics, and traces to Last9export OTEL_LOGS_EXPORTER=otlpexport OTEL_METRICS_EXPORTER=otlpexport OTEL_TRACES_EXPORTER=otlp# Last9 OTLP destinationexport OTEL_EXPORTER_OTLP_ENDPOINT="https://<your-last9-otlp-endpoint>"export OTEL_EXPORTER_OTLP_HEADERS="Authorization=Basic <your-last9-auth-token>"export OTEL_EXPORTER_OTLP_PROTOCOL=http/json# Required for metrics: Last9 expects cumulative countersexport OTEL_EXPORTER_OTLP_METRICS_TEMPORALITY_PREFERENCE=cumulative# Required for traces (currently beta) — also enables subagent agent_id/parent_agent_id span attributesexport CLAUDE_CODE_ENHANCED_TELEMETRY_BETA=1# Identify your sessionsexport OTEL_SERVICE_NAME="claude-code"export OTEL_RESOURCE_ATTRIBUTES="deployment.environment=local,team=<your-team>"export CLAUDE_CODE_ENABLE_TELEMETRY=1export OTEL_LOGS_EXPORTER=otlpexport OTEL_EXPORTER_OTLP_ENDPOINT="https://<your-last9-otlp-endpoint>"export OTEL_EXPORTER_OTLP_HEADERS="Authorization=Basic <your-last9-auth-token>"export OTEL_EXPORTER_OTLP_PROTOCOL=http/jsonexport OTEL_SERVICE_NAME="claude-code"export CLAUDE_CODE_ENABLE_TELEMETRY=1export OTEL_METRICS_EXPORTER=otlpexport OTEL_EXPORTER_OTLP_ENDPOINT="https://<your-last9-otlp-endpoint>"export OTEL_EXPORTER_OTLP_HEADERS="Authorization=Basic <your-last9-auth-token>"export OTEL_EXPORTER_OTLP_PROTOCOL=http/jsonexport OTEL_EXPORTER_OTLP_METRICS_TEMPORALITY_PREFERENCE=cumulativeexport OTEL_SERVICE_NAME="claude-code"Then reload your shell:
source ~/.zshrc -
Start a Claude Code session
claude "summarize what this repo does"- Logs flush within 5 seconds of each event
- Metrics flush every 60 seconds by default
-
Verify data is arriving
- Logs — navigate to Logs in Last9, filter by
service.name = claude-code - Metrics — navigate to Metrics, search for
claude_code_cost_usage_total
- Logs — navigate to Logs in Last9, filter by
Configuration reference
Core
| Variable | Default | Description |
|---|---|---|
CLAUDE_CODE_ENABLE_TELEMETRY | 0 | Set to 1 to enable all telemetry |
OTEL_LOGS_EXPORTER | none | otlp to export logs to Last9 |
OTEL_METRICS_EXPORTER | none | otlp to export metrics to Last9 |
OTEL_TRACES_EXPORTER | none | otlp to export traces to Last9 (requires CLAUDE_CODE_ENHANCED_TELEMETRY_BETA=1) |
CLAUDE_CODE_ENHANCED_TELEMETRY_BETA | 0 | Set to 1 to enable trace export, plus agent_id/parent_agent_id span attributes (beta) |
OTEL_EXPORTER_OTLP_ENDPOINT | — | Last9 OTLP endpoint URL |
OTEL_EXPORTER_OTLP_HEADERS | — | Authorization=Basic <token> |
OTEL_SERVICE_NAME | claude-code | Service name tag on all signals |
OTEL_RESOURCE_ATTRIBUTES | — | Comma-separated key=value resource tags |
Logs
| Variable | Default | Description |
|---|---|---|
OTEL_LOGS_EXPORT_INTERVAL | 5000 | Flush interval in milliseconds |
OTEL_LOG_USER_PROMPTS | 0 | Set to 1 to include full prompt text |
OTEL_LOG_TOOL_DETAILS | 0 | Set to 1 to include tool input parameters |
Metrics
| Variable | Default | Description |
|---|---|---|
OTEL_METRIC_EXPORT_INTERVAL | 60000 | Flush interval in milliseconds |
OTEL_EXPORTER_OTLP_METRICS_TEMPORALITY_PREFERENCE | delta | delta or cumulative |
OTEL_METRICS_INCLUDE_SESSION_ID | true | Include session.id label (increases cardinality) |
OTEL_METRICS_INCLUDE_VERSION | false | Include app.version label |
OTEL_METRICS_INCLUDE_ACCOUNT_UUID | true | Include user.account_uuid label |
What you can do in Last9
Cost and spend tracking (metrics)
claude_code.cost.usage is a counter broken down by model and user.email. In Last9 Metrics, query the rate to get spend per minute, or sum it over a time window for daily/weekly totals:
- Dashboard total team spend across all models
- Break down by
user.emailto see per-developer cost - Alert when cumulative cost crosses a budget threshold
Token efficiency (metrics)
claude_code.token.usage tracks input, output, cache read, and cache creation tokens separately. Compare cacheRead / input ratio to measure prompt cache efficiency — a high ratio means less spend per interaction.
Session replay via prompt.id (logs)
Every log event shares a prompt.id UUID. Filter Last9 Logs by a specific prompt.id to reconstruct the full sequence for one user interaction:
user_prompt → api_request → tool_decision → tool_result → api_requestUseful for debugging slow sessions or unexpected tool rejections.
Tool usage audit (logs)
claude_code.tool_decision events record every permission decision with tool.decision = accept | reject and decision.source. Surface which tools are most frequently rejected and whether your --allowedTools policies are working.
Code output tracking (metrics)
claude_code.lines_of_code.count and claude_code.commit.count let you measure developer output attributable to Claude Code sessions — useful for adoption reporting.
Error rate monitoring (logs + alerts)
claude_code.api_error events include http.status_code and retry_attempt. Create a Last9 alert on error rate spikes to catch Claude API degradation before users report it.
Team-level tagging
For organizations with multiple teams, use OTEL_RESOURCE_ATTRIBUTES to tag sessions by team or project. Add to your shell profile (~/.zshrc, ~/.bashrc, or equivalent):
export OTEL_RESOURCE_ATTRIBUTES="deployment.environment=production,team=platform,project=infra-agent"All signals from that session carry team and project labels, enabling per-team cost breakdowns in Last9.
User attribution with AWS Bedrock
When your organization uses Claude Code via AWS Bedrock, authentication is handled by AWS IAM instead of Anthropic OAuth. In this case, Claude Code never sets the user.email span attribute — sessions appear as unknown in Last9’s Coding Agents view.
To restore per-developer attribution, set user.email as a resource attribute in your shell profile:
# Add to ~/.zshrc or ~/.bashrc — shell expansion works hereexport OTEL_RESOURCE_ATTRIBUTES="deployment.environment=local,team=<your-team>,user.email=$(git config user.email)"After reloading your shell (source ~/.zshrc), Last9 stores these as resource attributes. The Coding Agents dashboard reads user.email from resource attributes for Bedrock users and from span attributes for OAuth users — both cases are handled automatically.
Verify it’s working:
# Check the env var expanded correctly — no spaces in any valueecho $OTEL_RESOURCE_ATTRIBUTES# Should print: deployment.environment=local,team=platform,user.email=you@company.comRoll out org-wide
managed-settings.json and server-managed settings are both different, system-level configuration from the project/user settings.json referenced above — Claude Code’s telemetry pipeline ignores OTEL_* in the latter, but honors it in both of the former. If your org is on a Claude Team or Enterprise plan, either lets you enable Last9 telemetry for every developer at once instead of each person editing their own shell profile.
Server-managed settings (no MDM required)
If your org is on Claude for Teams or Claude for Enterprise, an Owner or Primary Owner can push this from Admin Settings → Claude Code → Managed settings in the claude.ai console — no device-management infrastructure needed:
{ "env": { "CLAUDE_CODE_ENABLE_TELEMETRY": "1", "OTEL_LOGS_EXPORTER": "otlp", "OTEL_METRICS_EXPORTER": "otlp", "OTEL_TRACES_EXPORTER": "otlp", "CLAUDE_CODE_ENHANCED_TELEMETRY_BETA": "1", "OTEL_EXPORTER_OTLP_ENDPOINT": "https://<your-last9-otlp-endpoint>", "OTEL_EXPORTER_OTLP_HEADERS": "Authorization=Basic <your-last9-auth-token>", "OTEL_EXPORTER_OTLP_PROTOCOL": "http/json", "OTEL_EXPORTER_OTLP_METRICS_TEMPORALITY_PREFERENCE": "cumulative" }}Save, then have each developer fully restart Claude Code — OTel config requires a restart even though most settings apply live. A subset of these env vars trigger a one-time security-approval dialog on each developer’s next launch; they need to accept it:
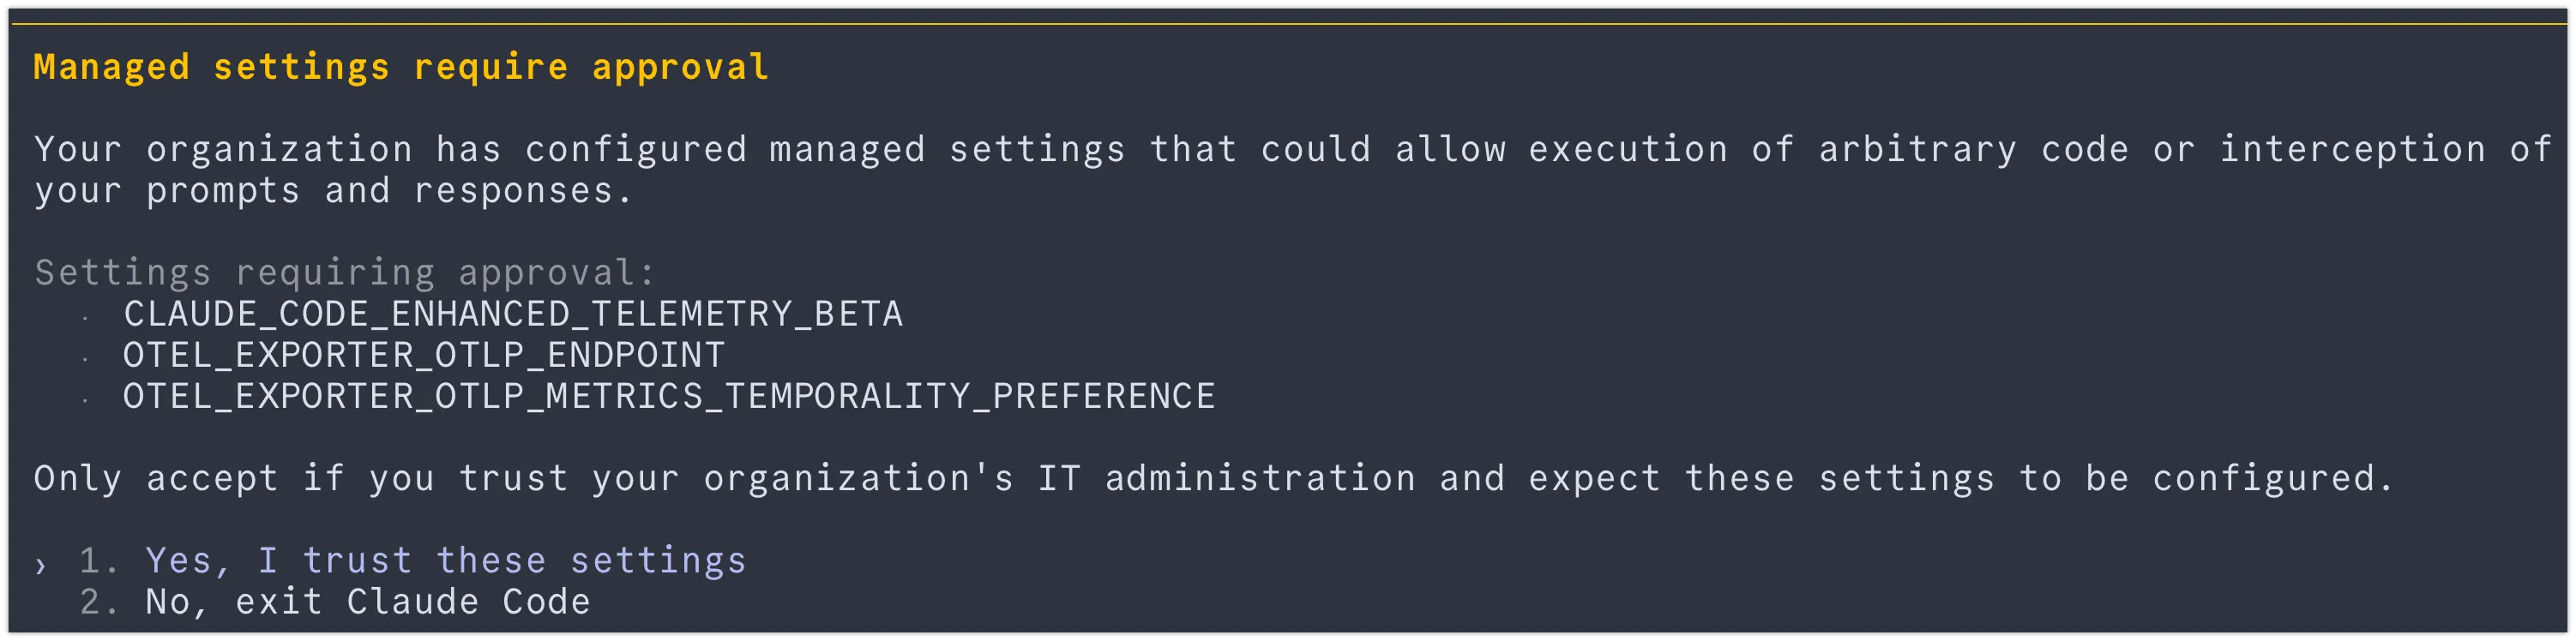
Only these three vars from the example above triggered approval in testing — CLAUDE_CODE_ENABLE_TELEMETRY, the exporter-selection vars, OTEL_EXPORTER_OTLP_HEADERS, and OTEL_EXPORTER_OTLP_PROTOCOL did not.
Endpoint-managed settings (MDM / Group Policy)
Push the same env block via MDM, Group Policy, or a system managed-settings.json file. This is the only centralized path for Bedrock/Vertex/Foundry orgs, and works alongside server-managed settings for orgs that already have device management in place. Managed settings apply org-wide and cannot be overridden by user or project settings.
File locations:
- macOS:
/Library/Application Support/ClaudeCode/managed-settings.json - Linux/WSL:
/etc/claude-code/managed-settings.json - Windows: registry
HKLM\SOFTWARE\Policies\ClaudeCode— pushable via Group Policy without a full MDM product if devices are AD-joined
Use the same JSON shown above as the file contents (drop CLAUDE_CODE_ENHANCED_TELEMETRY_BETA if you don’t want traces).
No MDM access
If your team doesn’t manage devices centrally and can’t use server-managed settings (e.g. a Bedrock org), export the same variables from a shared dotfiles repo or onboarding script that every team member sources, instead of each developer copying values by hand.
Verify the rollout
Confirm the env vars reach the process that launches claude:
env | grep -E "CLAUDE_CODE_ENABLE_TELEMETRY|OTEL_"Then confirm data lands in Last9 using the Logs, Metrics, and Traces verification steps above.
Shared schema with Cowork and Office Agents
Claude Cowork and Claude Office Agents reuse the Claude Code OTel event schema via the Claude Agent SDK. If you are sending telemetry from more than one of these products to Last9, events land in the same log stream and can be distinguished by:
service.name—claude-codevscoworkvsoffice-agentsterminal.type—clifor Claude Code,coworkfor Cowork sessionsworkspace.host_paths— only present in Cowork events
You can build a single Last9 dashboard covering all three products by grouping on service.name.
Troubleshooting
-
No logs in Last9 after running Claude Code
- Confirm
CLAUDE_CODE_ENABLE_TELEMETRY=1is set in the same shell session where you runclaude—exportdoes not persist across tabs or new sessions - Set
OTEL_EXPORTER_OTLP_PROTOCOL=http/json— Last9’s endpoint requires HTTP, not gRPC (the OTel SDK default) - Check that
OTEL_LOGS_EXPORTER=otlp(notnoneorconsole) - Wait at least 10 seconds — the default export interval is 5s and there may be one flush delay
- Rolling this out to a whole org? See Roll out org-wide — a common cause here is env vars set in a machine’s shell profile that a managed-settings rollout hasn’t actually reached yet, especially on Windows enterprise accounts
- Confirm
-
No metrics appearing
- Set
OTEL_EXPORTER_OTLP_METRICS_TEMPORALITY_PREFERENCE=cumulative— Claude Code defaults to delta temporality but Last9 requires cumulative counters - Set
OTEL_EXPORTER_OTLP_METRICS_PROTOCOL=http/jsonif the global protocol var is not being picked up - Metrics flush every 60 seconds by default — wait at least 90 seconds before checking
- Metric names in Last9 use underscores:
claude_code.cost.usagebecomesclaude_code_cost_usage_total
- Set
-
No traces appearing in Last9
- Both
CLAUDE_CODE_ENHANCED_TELEMETRY_BETA=1ANDOTEL_TRACES_EXPORTER=otlpmust be set. The beta flag alone does not export traces; the exporter flag alone does not enable the tracing pipeline - Verify in the shell that will launch
claude:env | grep -E "CLAUDE_CODE_ENHANCED|OTEL_TRACES"should print both lines - Restart
claudeafter editing your shell profile — env vars only load at process start - Traces flush in ~5 second batches; wait at least 10 seconds before querying
- In Last9 Traces, filter
service.name = claude-code. If you only see logs/metrics, the trace pipeline is not exporting
- Both
-
Subagent calls not appearing nested under the parent Task tool span
- This is expected in Claude Code v2.1.142. Subagent
claude_code.llm_requestspans live in a separate trace with their ownsession.id - Use
agent_id(present on subagent spans, absent on main thread) to identify subagent activity - Filter
llm_request.context = standaloneto isolate subagent LLM calls;interactionfor main thread
- This is expected in Claude Code v2.1.142. Subagent
-
401 / authentication errors
- Verify the header format:
Authorization=Basic <token>(no extra quotes, noBearerprefix) - Regenerate the token from Integrations → OpenTelemetry if it has expired
- Verify the header format:
-
Events appear but
user.emailis missing or shows asunknownuser.emailis only set as a span attribute when authenticated via Anthropic OAuth (not API key, not AWS Bedrock)- Run
claude --versionto confirm you are logged in - Using AWS Bedrock? See User attribution with AWS Bedrock — set
user.emailviaOTEL_RESOURCE_ATTRIBUTESin your shell profile instead
Please get in touch with us on Discord or Email if you have any questions.