
Prove what your
coding agents return.
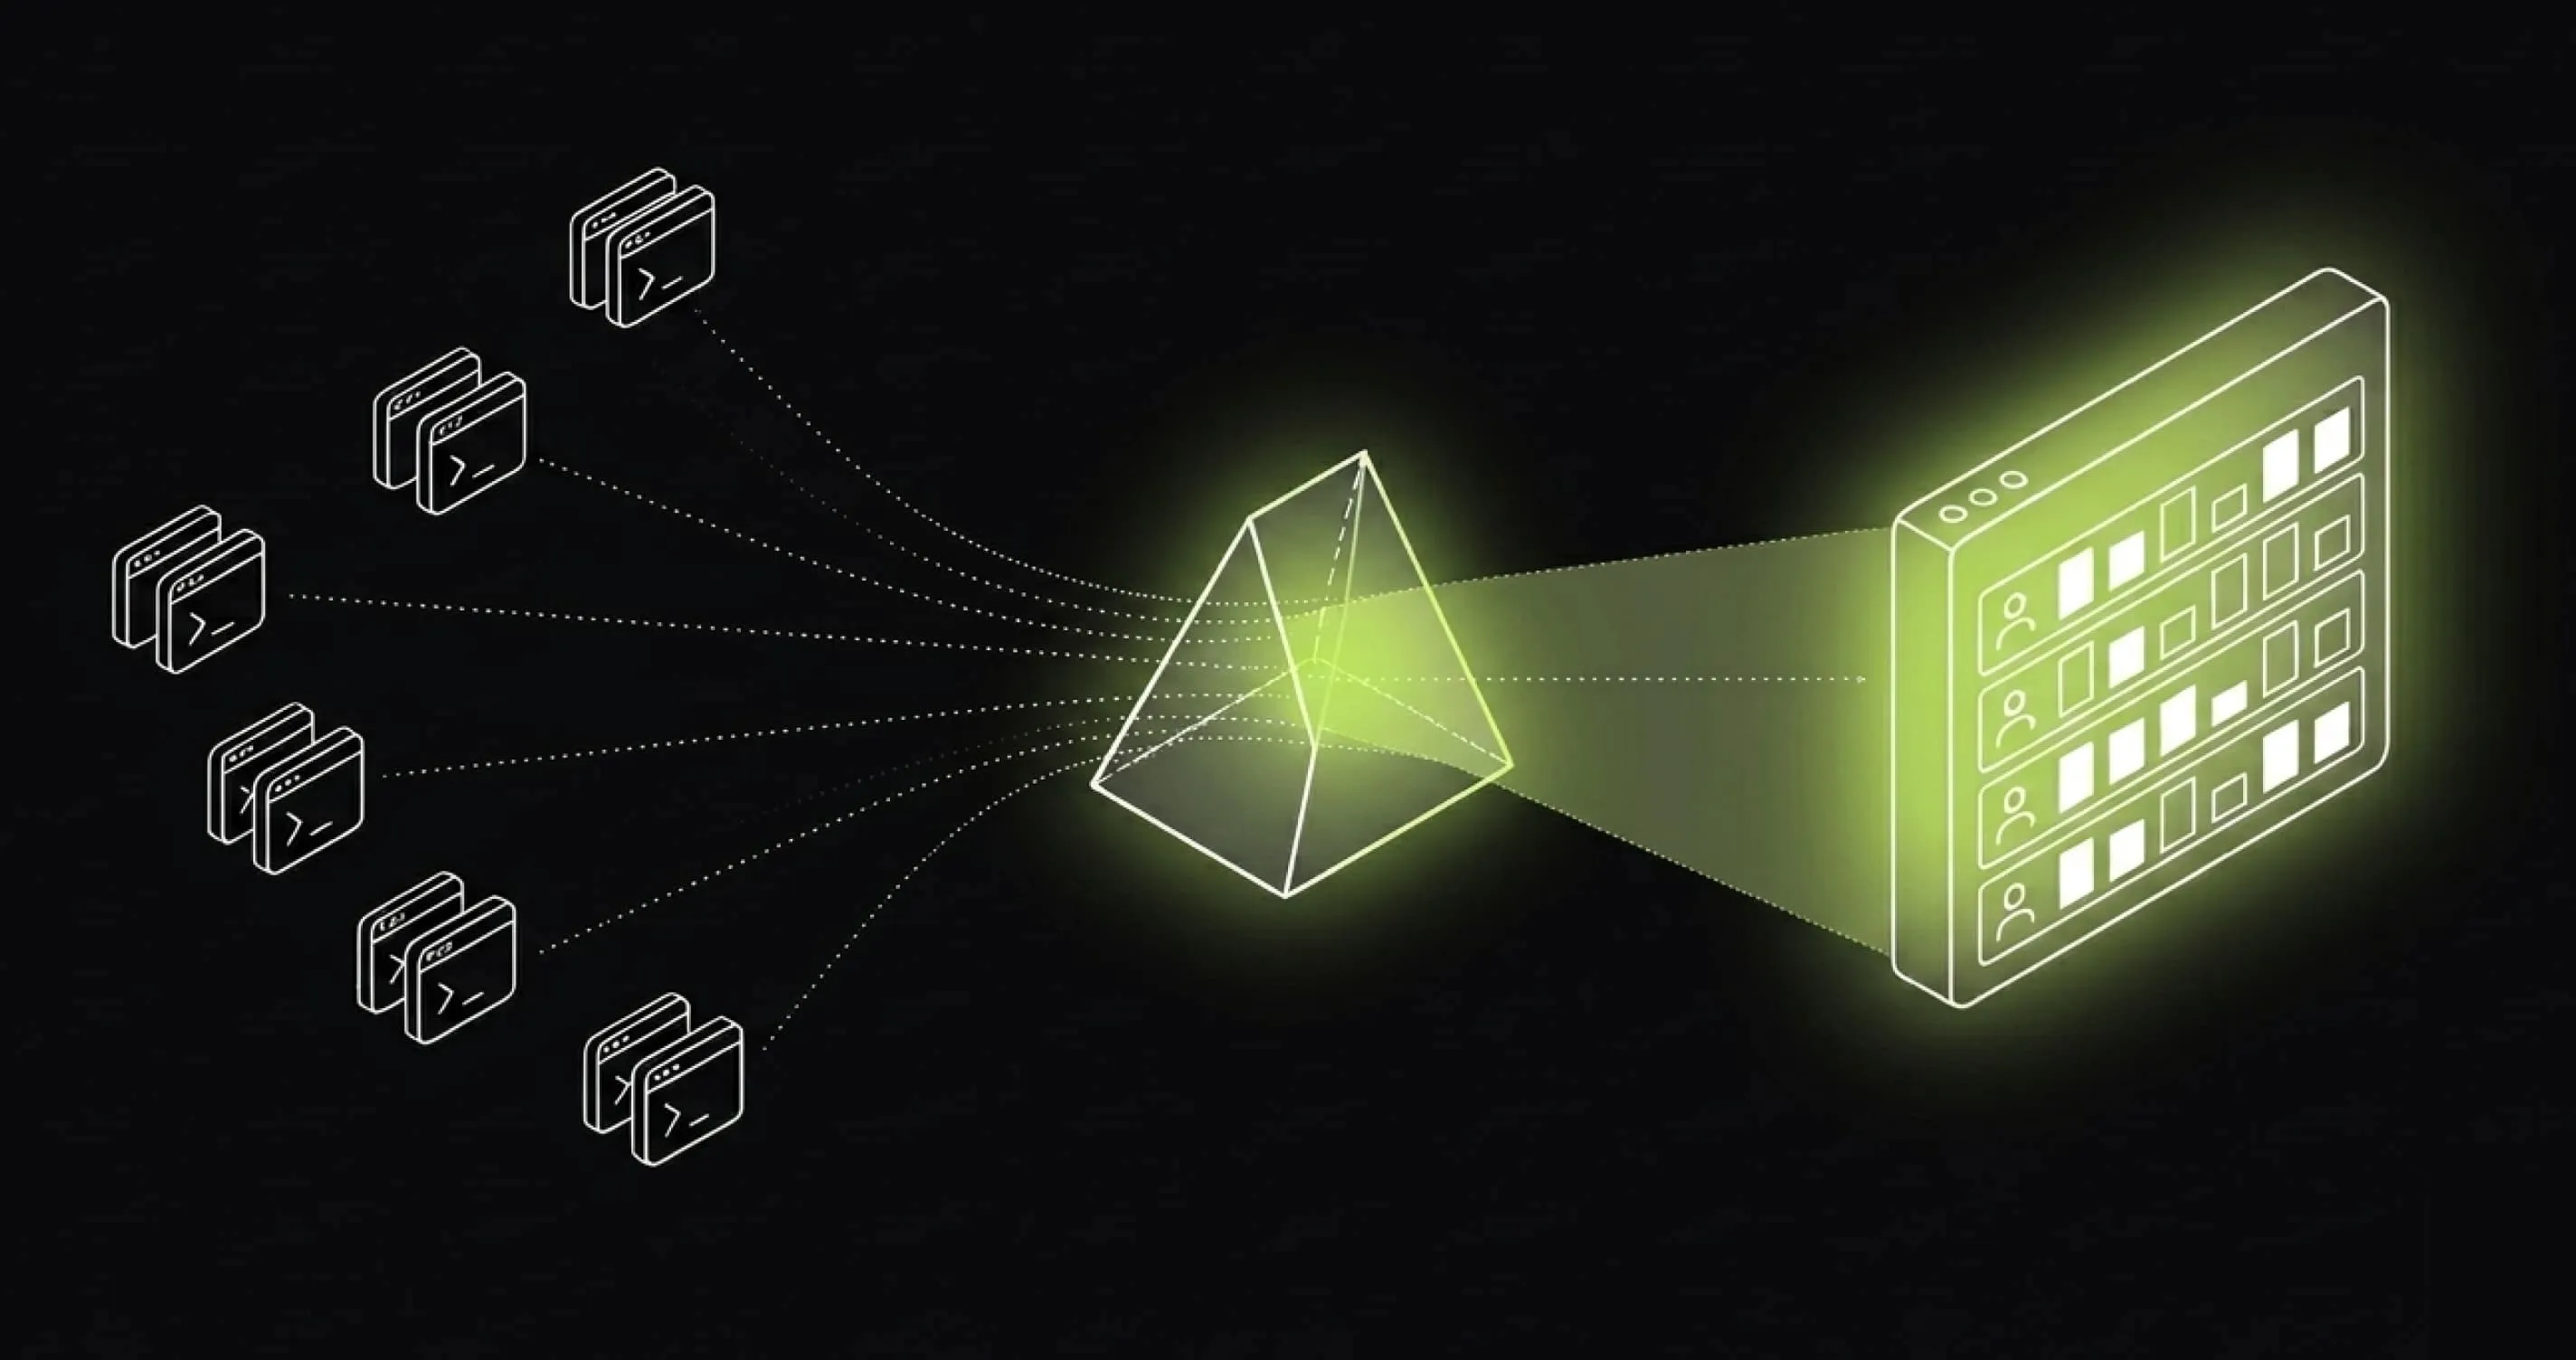
Your agents already emit OpenTelemetry. Last9 turns it into cost and output per developer, team, model, and agent. Evidence, not estimates.
- All major agents
- Claude Code, Cursor, Codex, Gemini CLI, Cline, goose & more
- Per developer
- cost, tokens, lines shipped — tied to an email, not a host
- One config block
- per agent — they already emit OpenTelemetry
- Same stack
- agent telemetry lands next to your production metrics
The problem
The spend is committed.
The ROI is a shrug.
You rolled out coding agents because the upside looked real. Two quarters in, the bill is a line item finance tracks — and the renewal conversation is coming.
The invoice has no names on it
Total spend is the only number you can prove today. No developers, no teams, no output attached to it.
Adoption is anecdotal
“The backend team loves it” doesn't survive a CFO meeting. You need session counts and active developers, by team, over time.
Token burn without shipped lines is invisible
You can't see whose sessions consume the budget without producing code — or whether the expensive model is worth its rate.
Three agents, three vendor dashboards
Claude Code on one squad, Cursor on another, Codex in the terminal. Each vendor shows its own slice. None show your org.
"Trust us, it's working" was fine for the pilot. It doesn't fund next year. Last9 gives you the cost-and-output evidence — per developer, per team, per agent.
How it works
The agents are already instrumented.
Most coding agents emit OpenTelemetry natively — sessions, API requests with cost, tokens by type, lines added and removed, tool decisions, errors. Last9 ingests each agent's schema as-is. No traffic proxy, no IDE plugin to maintain. Ship the config through managed settings and every developer's sessions land tagged with their email and team.
- Claude Code · Cursor · Codex · Gemini CLI · Cline · goose native OpenTelemetry, per session
- Last9 — attribution: developer email · team · model · agent
Every event carries
user.emailand yourteamresource attribute — whether developers hit the vendor API directly or run through AWS Bedrock. Sessions resolve to a person, not a host. - Cost & output, per developer dashboards · PromQL · alerts on token spend
Agent coverage
What each agent reports.
Agents don't all emit the same things, and we don't pretend they do. Claude Code and Cline report dollar costs; the rest report tokens. We show cost where the agent reports it and tokens where it doesn't — not invented dollars.
-
Claude Code
USDDollar cost per request, tokens by type and model, lines added/removed, commits, tool accept/reject decisions, subagent spans
Setup guide → -
Cline
USDCost, tokens, cache hit rates, tool calls, and code generated vs accepted vs rejected
Setup guide → -
Cursor
tokensToken usage by model, hook events, per-developer email, optional Admin API polling — via cursorscope
Setup guide → -
Codex CLI
tokensTokens, turn-level latency, tool invocations, model API calls — from codex exec and the TUI
Setup guide → -
Gemini CLI
tokensTokens including cached, tool calls, subagent runs, file operations, API latency
Setup guide → -
goose
tokensSessions, tokens, and tool activity via standard OpenTelemetry SDK variables
Setup guide → -
GitHub Copilot
tokensCopilot Chat in VS Code (OTel) and Copilot SDK custom agents — invoke_agent traces, tool calls, token usage
Setup guide → -
Your agent
?If it emits OpenTelemetry, it already works — point it at your Last9 endpoint. If it doesn't, tell us which agent and we'll build the integration.
Request an agent →
Setup
One config block per agent.
Environment variables for most agents, one command for Cursor, one config file for Codex. Distribute through managed settings and attribution is org-wide on day one — no per-developer drift.
Read the integration docsexport CLAUDE_CODE_ENABLE_TELEMETRY=1
export OTEL_LOGS_EXPORTER=otlp
export OTEL_METRICS_EXPORTER=otlp
export OTEL_EXPORTER_OTLP_ENDPOINT="https://<your-last9-otlp-endpoint>"
export OTEL_EXPORTER_OTLP_HEADERS="Authorization=Basic <your-last9-auth-token>"
export OTEL_EXPORTER_OTLP_PROTOCOL=http/json
export OTEL_EXPORTER_OTLP_METRICS_TEMPORALITY_PREFERENCE=cumulative
export OTEL_RESOURCE_ATTRIBUTES="deployment.environment=local,team=<your-team>"npx @last9/cursorscope setup --last9 \
--otlp-base <your-last9-otlp-endpoint> \
--auth-token "$LAST9_OTLP_TOKEN"
# registers Cursor hooks in ~/.cursor/hooks.json
# and starts the background ingestoranalytics_enabled = true
[otel.exporter.otlp-http]
endpoint = "https://<your-last9-otlp-endpoint>/v1/logs"
protocol = "binary"
headers = { Authorization = "Basic <your-last9-auth-token>" }
[otel.metrics_exporter.otlp-http]
endpoint = "https://<your-last9-otlp-endpoint>/v1/metrics"
protocol = "binary"
headers = { Authorization = "Basic <your-last9-auth-token>" }export GEMINI_TELEMETRY_OTLP_ENDPOINT="https://<your-last9-otlp-endpoint>"
export OTEL_EXPORTER_OTLP_HEADERS="Authorization=Basic <your-last9-auth-token>"export CLINE_OTEL_TELEMETRY_ENABLED=true
export CLINE_OTEL_METRICS_EXPORTER=otlp
export CLINE_OTEL_LOGS_EXPORTER=otlp
export CLINE_OTEL_EXPORTER_OTLP_PROTOCOL=http/protobuf
export CLINE_OTEL_EXPORTER_OTLP_ENDPOINT="https://<your-last9-otlp-endpoint>"
export CLINE_OTEL_EXPORTER_OTLP_HEADERS="Authorization=Basic <your-last9-auth-token>"export OTEL_EXPORTER_OTLP_ENDPOINT="https://<your-last9-otlp-endpoint>"
export OTEL_EXPORTER_OTLP_HEADERS="Authorization=Basic <your-last9-auth-token>"
export OTEL_EXPORTER_OTLP_PROTOCOL=http/protobuf
export OTEL_SERVICE_NAME=gooseAfter setup you get:
- Every session tagged with developer email and team
- Cost and token spend by model, queryable with PromQL
- Lines added and removed where the agent reports them
- Alerts on token spend — same engine as your production alerts
What you can finally answer
Questions the budget review will ask.
- What did we spend on coding agents last month — by team?
- Which developers are active daily, and which seats sit idle?
- Whose sessions burn tokens without shipping lines?
- Is Opus earning its rate over Sonnet on this team?
- How much of our spend goes to subagents we never see?
- Which agent ships more code per dollar for the same team?
Honest limits
What we won't show you.
-
No “hours saved”
We don't invent productivity multipliers. We show cost and output — sessions, tokens, lines, commits — and you draw the conclusion. That's what survives scrutiny.
-
No fake dollars
Agents that report tokens get token numbers, not dollars conjured from a price table you can't audit. Agents that report cost get cost.
-
Proxies labeled as proxies
Output metrics like lines of code are proxies for value, and the UI says so. Review-heavy sessions show a dash, not a misleading zero.
Walk into the budget review with numbers.
Your agents already emit the telemetry. One config block per agent, and the evidence starts accruing today.

Start observing for free. No lock-in.
OpenTelemetry · Prometheus
Just update your config. Start seeing data on Last9 in seconds.
Datadog · New Relic · Others
We've got you covered. Bring over your dashboards & alerts in one click.
Built on Open Standards
100+ integrations. OTel native, works with your existing stack.