
Product
Synthetic Monitoring
Monitor uptime and latency of HTTP endpoints from multiple regions with scheduled checks, customizable assertions, and trace-level visibility for every probe.
Synthetic Monitoring lets you continuously probe HTTP and HTTPS endpoints from Last9-managed locations to verify availability, latency, and response correctness. Each check runs on a schedule you control, evaluates the response against assertions, and records the result so you can spot regressions before customers do.
Every check execution is recorded as an OpenTelemetry trace span, so a failing probe links directly to a full trace with DNS, TCP, TLS, TTFB, and download timings — no separate tool to investigate why a check failed.
Prerequisites
Synthetic Monitoring is available in every Last9 workspace. No agent installation or integration setup is required — Last9 runs the probes for you from the regions you select.
The target endpoint must be reachable from the public internet from the probe locations you choose.
Accessing Synthetic Monitoring
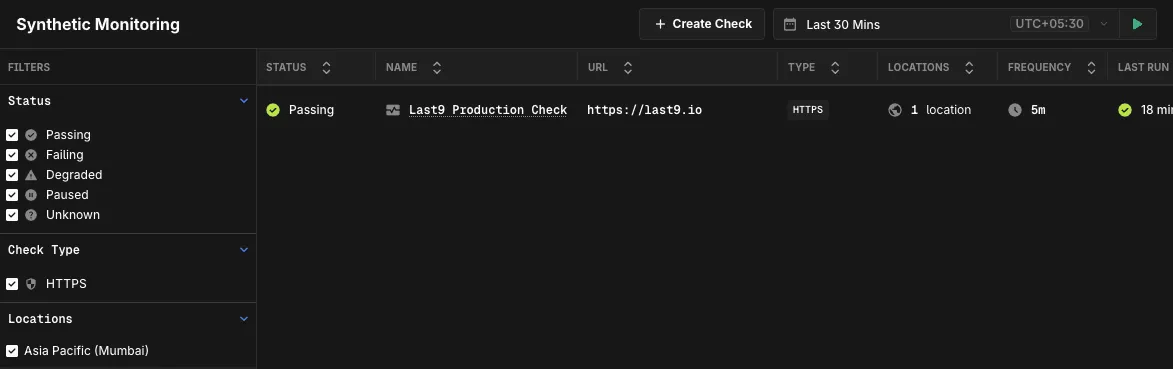
Open Synthetic Monitoring from the left sidebar in Last9. You will see a list of all checks in the current workspace.
The list view shows each check with:
- Status: Passing or failing based on the most recent runs
- Name: The display name you chose when creating the check
- URL: The target endpoint being probed
- Type: The check type (currently
HTTPS) - Locations: Number of probe locations the check runs from
- Frequency: How often the check runs (e.g.,
5m) - Last Run: Relative time since the most recent execution
Use the filters on the left to narrow the list by Status, Check Type, or Locations.
Creating a Check
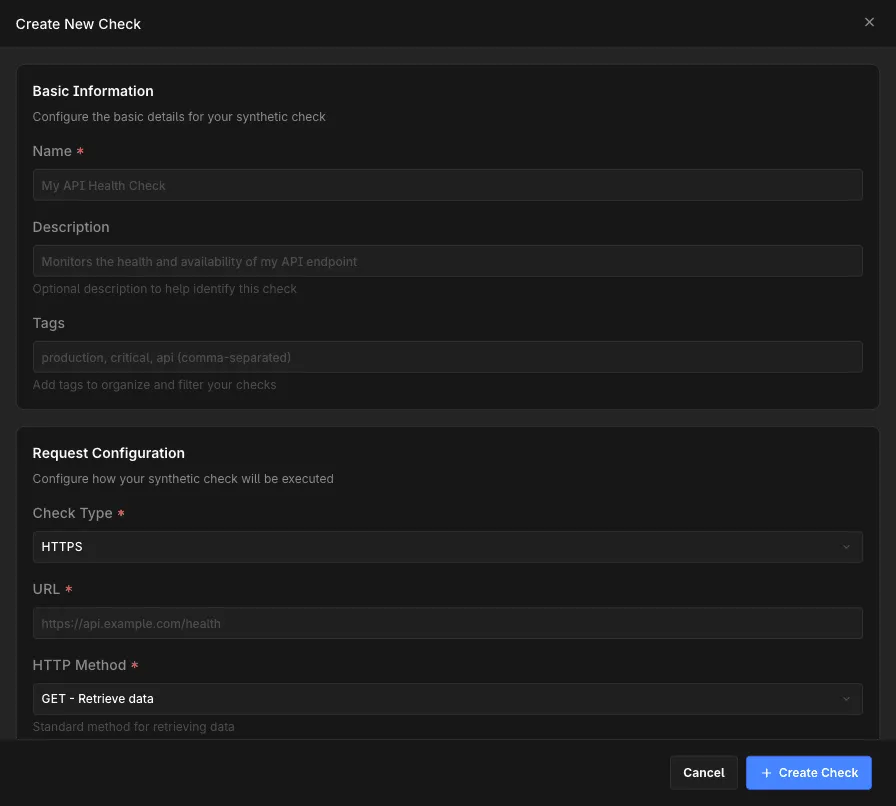
Click Create Check on the Synthetic Monitoring list view to open the check creation dialog.
-
Fill in Basic Information
- Name (required): A human-readable identifier such as
Production API HealthorLogin Page Uptime - Description: Optional context about what the check is verifying
- Tags: Comma-separated tags (e.g.,
production, critical, api) to organize and filter checks
- Name (required): A human-readable identifier such as
-
Configure the request
- Check Type:
HTTPS(only check type currently available) - URL (required): The full endpoint to probe, e.g.,
https://api.example.com/health - HTTP Method: One of
GET,POST,PUT,PATCH,DELETE,HEAD,OPTIONS. The dialog shows method details (whether the method supports a request body, is idempotent, cacheable, and safe) as you select.
- Check Type:
-
Add headers (optional)
Click Add Header to attach custom HTTP headers such as
Accept: application/jsonor a customX-Request-ID. -
Configure authentication (optional)
Pick one of the supported authentication modes from the Authentication dropdown:
Mode Use when No Authentication Endpoint is public Basic Authentication Endpoint uses HTTP Basic auth (username + password) Bearer Token Endpoint accepts an Authorization: Bearer <token>headerAPI Key Endpoint accepts a static API key in a header or query parameter OAuth 2.0 Endpoint requires an OAuth 2.0 access token Custom Headers You need full control over the authentication headers -
Set timeout and transport options
- Timeout (ms): How long to wait for the response before marking the run as failed. Default
30000(30 seconds). - Follow Redirects: When enabled, the probe transparently follows
3xxredirects. - Verify SSL: When enabled, the probe validates the server’s TLS certificate chain. Turn off only for endpoints with self-signed certificates that you cannot replace.
- Timeout (ms): How long to wait for the response before marking the run as failed. Default
-
Add assertions
Assertions define the conditions that must be true for the run to be considered passing. The default assertion checks that the response status code equals
200.Field Description Type What to evaluate (e.g., Status Code)Operator Comparison operator (e.g., equals,not equals,greater than)Expected Value Value to compare against (e.g., 200)Click Add Assertion to add more conditions. All assertions must pass for the run to pass.
-
Schedule the check
-
Frequency: How often the check runs. Pick from the dropdown — down to
1 minutefor critical endpoints. -
Run from… (required): Select one or more probe locations. Available regions:
- US East (N. Virginia)
- Asia Pacific (Mumbai)
- Asia Pacific (Singapore)
Each selected location runs the check independently on the configured frequency. Running from multiple regions distinguishes a real outage from a regional network issue.
-
-
Enable the check
Leave Enable check immediately on to start running the probe as soon as you save. Toggle off if you want to create the check in a paused state and enable it later.
-
Save
Click Create Check. The check appears in the list and begins running according to its schedule.
Viewing Check Results
Click any check from the list to open its detail view.
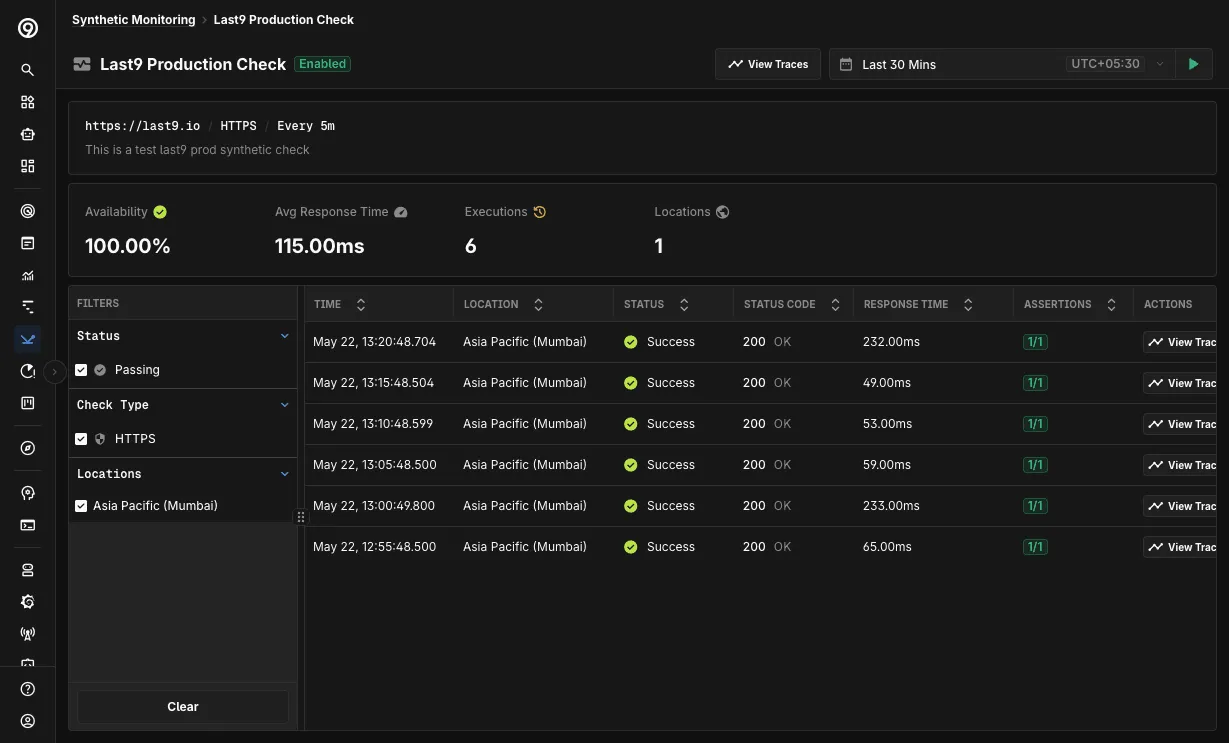
The header shows the target URL, check type, frequency, and description. Four summary cards report the rolled-up state for the selected time range:
| Card | What it shows |
|---|---|
| Availability | Percentage of runs in the time range that passed all assertions |
| Avg Response Time | Mean end-to-end response time across all runs |
| Executions | Total number of runs |
| Locations | Number of distinct probe locations the check ran from |
Below the summary, the run history table lists individual executions with:
- Time: When the run started
- Location: Probe region the run originated from
- Status: Success or failure
- Status Code: HTTP status returned by the endpoint
- Response Time: End-to-end latency for that run
- Assertions: Pass count over total (e.g.,
1/1) - Actions: View Trace opens the OpenTelemetry trace for that exact run
Filter the run history with the left-side Status, Check Type, and Locations panels to focus on failures or a specific region.
Correlating Check Runs With Traces
Every synthetic check run is emitted as an OpenTelemetry trace span. This means you can:
- Open the full trace for any individual run with View Trace from the check detail page
- Query synthetic spans directly from the Traces explorer the same way you query application spans
- Build dashboards and alerts on synthetic latency using the same query surface you already use for traces
Opening a trace from a check run
Click View Trace on any row in the run history. Last9 takes you to the Trace Details view for that specific execution.
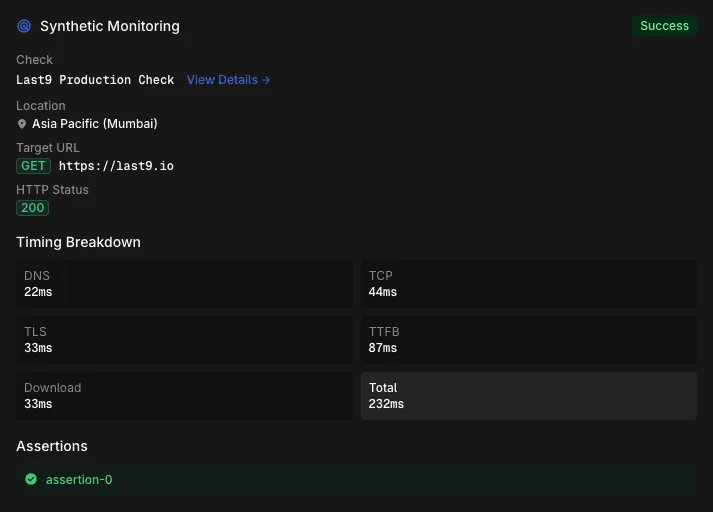
The Trace Details view includes a dedicated Synthetic Monitoring panel showing:
- Check: The check name with a link back to the check detail page
- Location: Probe region the run originated from
- Target URL: The endpoint that was probed
- HTTP Status: The response status code
The Timing Breakdown card splits the total response time into its phases:
| Phase | Description |
|---|---|
| DNS | Time spent resolving the target hostname |
| TCP | Time to establish the TCP connection |
| TLS | Time to complete the TLS handshake |
| TTFB | Time to first byte after the request was sent |
| Download | Time spent reading the response body |
| Total | End-to-end response time |
Use the breakdown to isolate where latency is coming from — a slow TLS handshake points to a different problem than a slow TTFB.
Querying synthetic spans
Synthetic runs are emitted with a stable, queryable shape:
| Attribute | Description |
|---|---|
service.name | synthetic-check-last9-<check-id> for every synthetic span |
l9.synthetic.check_id | The check’s unique ID |
cloud.provider | cloudflare |
cloud.platform | cloudflare_workers |
deployment.environment | Probe region (e.g., ap-south-1) |
http.method | HTTP method used (GET, POST, etc.) |
http.status_code | HTTP status code returned |
http.response.body.size | Size of the response body in bytes |
http.dns_time_ms | DNS resolution time in milliseconds |
http.connect_time_ms | TCP connect time in milliseconds |
http.tls_time_ms | TLS handshake time in milliseconds |
http.ttfb_ms | Time to first byte in milliseconds |
http.download_time_ms | Response download time in milliseconds |
To list every run of a specific check from the Traces explorer, filter spans where l9.synthetic.check_id equals the check’s ID. The same filter works in dashboards, alert rules, and ad-hoc analytics queries.
Synthetic spans are tagged with kind=Client and type=SYNTHETIC so they are easy to distinguish from application spans in mixed views.
Best Practices
- Probe from at least two regions when measuring availability of a public endpoint. A failure from one region with success from another points to a network issue, not an outage.
- Pin assertions to what actually matters — combine a status code assertion with a response time or body content assertion so you catch slow responses and broken payloads, not just hard failures.
- Keep the frequency proportional to your alerting cadence. A 5-minute check cannot detect a 1-minute outage. Tighten the frequency for critical endpoints.
- Use tags to group related checks (
production,auth,checkout) so you can filter the list and build dashboards by tag. - Disable Verify SSL only when necessary. Self-signed certificates in production are a finding in their own right; turning off verification hides it.
Troubleshooting
-
The check stays in a failing state even though the endpoint is up
- Wrong assertion. The default assertion checks
Status Code equals 200. If your endpoint returns204or301, update the assertion to match. - Verify SSL is on for a self-signed endpoint. The TLS verification step fails before any HTTP exchange happens. Disable Verify SSL for the check or fix the certificate.
- Endpoint blocks the probe region. Some endpoints geo-restrict traffic. Confirm the selected probe region is allowed by your firewall or WAF.
- Wrong assertion. The default assertion checks
-
Response times look much higher than from a browser
- Cold connection on every run. Each synthetic run opens a fresh TCP/TLS connection. Compare against a
curlfrom the same region rather than a warm browser session. - Endpoint is far from the probe. Run the check from a region geographically closer to your origin, or add the closer region as a second probe location.
- Cold connection on every run. Each synthetic run opens a fresh TCP/TLS connection. Compare against a
-
View Traceshows no data- Trace retention window has elapsed. Traces are subject to your workspace’s retention policy. Recent runs always have trace data; very old runs may not.
-
A run shows pass overall but one assertion is marked failing
- The summary status reflects the AND of all assertions. If any assertion fails, the run fails. Check the Assertions panel in the Trace Details view to see which assertion did not match.
Please get in touch with us on Discord or Email if you have any questions.