
The check failed.
Here's the trace.
Uptime tools tell you it's down. Last9 probes your endpoints from three regions and records every run as an OpenTelemetry trace, timed from DNS to download. The failure and the reason arrive together.
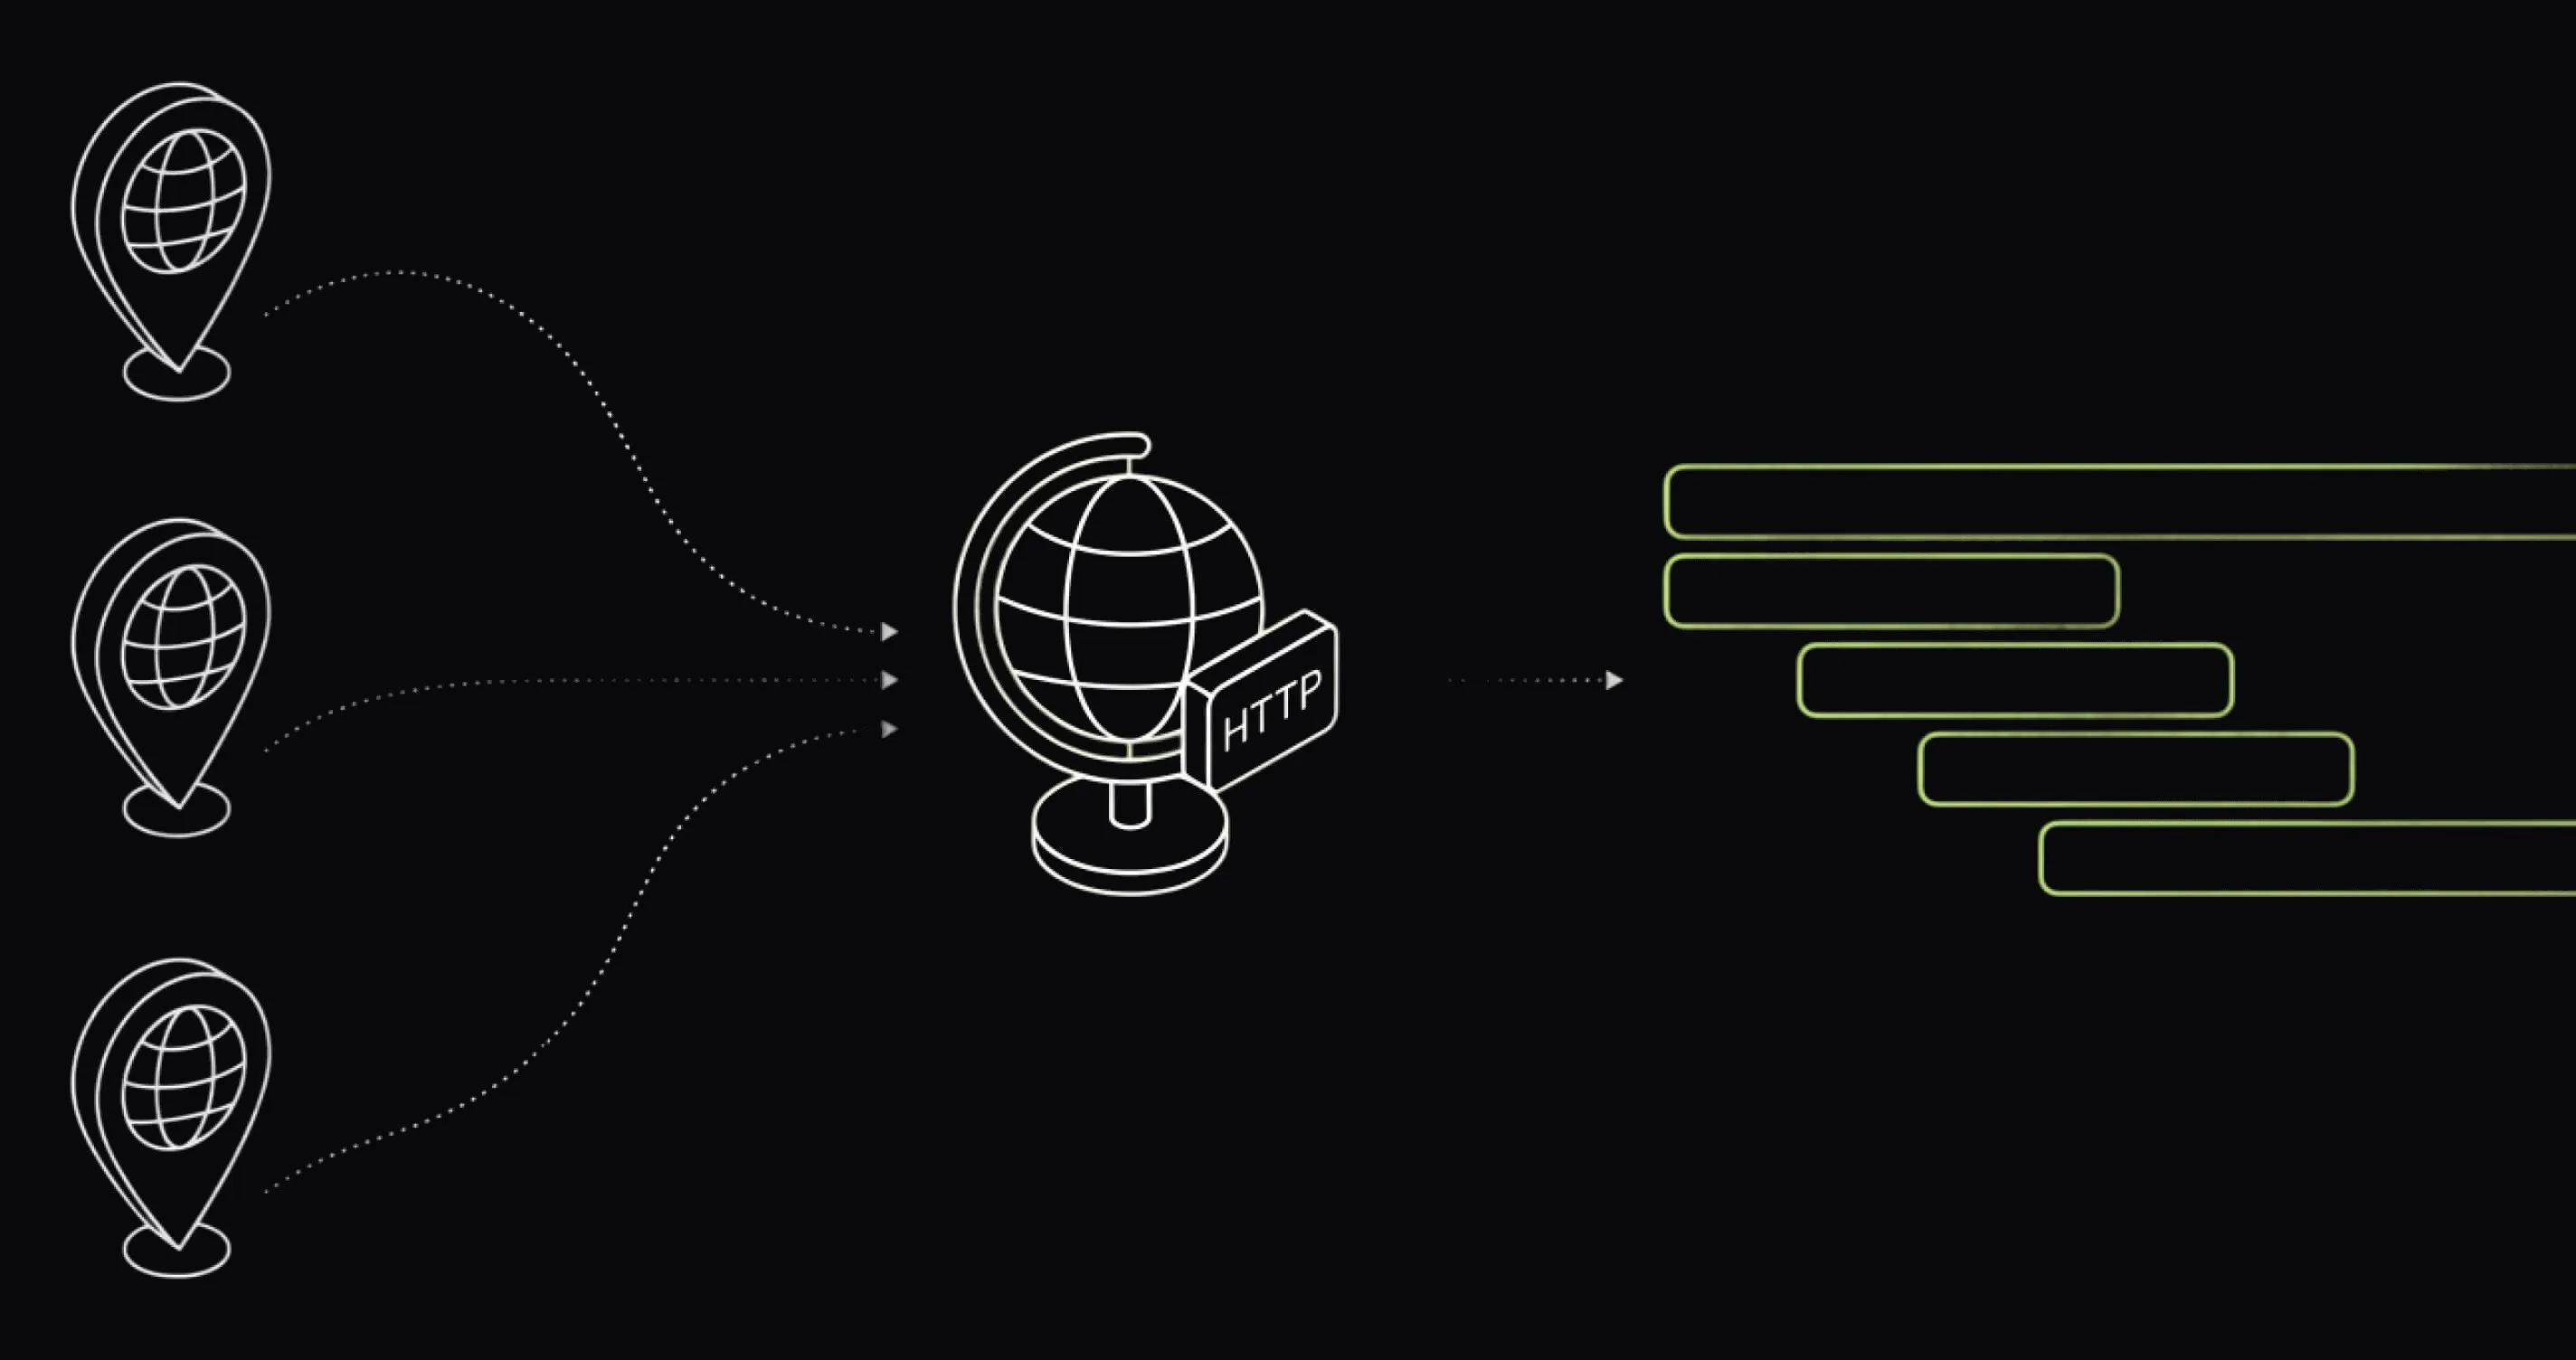
- 3 regions
- US East (N. Virginia), Mumbai, Singapore — run independently
- Every minute
- check frequency down to 1-minute for critical endpoints
- DNS → download
- total response time split into connection phases, per run
- Trace per run
- every probe recorded as an OpenTelemetry trace span
The problem
DOWN is a page.
It's not a diagnosis.
The pinger fires at 2 a.m. and its entire contribution is one red word. Was it DNS? A TLS handshake? A server that took 28 seconds to first byte? The uptime tool doesn't know — so the investigation starts in a different tab.
The uptime tool can't answer 'why'
A failed check tells you the endpoint didn't respond correctly. Which phase failed — resolution, connection, handshake, or response — lives in a tool that doesn't have it.
Uptime lives outside your observability stack
A separate vendor, a separate alert channel, a separate bill. The check that failed and the deploy that broke it never appear in the same view.
One probe location, false alarms
A single-region pinger can't tell a regional network blip from a real outage. You get paged for the internet's problems, not yours.
Status 200 isn't health
An endpoint can return 200 with a broken payload, or after nine seconds. Checks that only assert the status code pass either way.
Every Last9 check run is an OpenTelemetry trace in the same stack as your application telemetry. The failing probe, the timing phase that caused it, and your backend traces — one query apart, not one vendor apart.
How it works
A pinger that speaks OpenTelemetry.
No agent to install, no integration to wire — Last9 runs the probes from regions you pick. Each execution is recorded as a trace span with a stable, queryable shape, so check results work everywhere your other telemetry does: traces, dashboards, alerts.
- Your endpoints HTTP(S) checks — method, headers, body, assertions, schedule
- Last9 — probes from US East · Mumbai · Singapore
Each run lands as a span under
synthetic-check-last9-<check-id>carryingl9.synthetic.check_idand per-phase timing attributes — DNS, TCP connect, TLS, TTFB, download. Taggedtype=SYNTHETICso probes never blur into application spans. - Status · traces · alerts pass/fail per region · View Trace on every run · alert rules
What a check can do
Checks that catch slow and broken, not just down.
Combine a status-code assertion with response-time and body-content
conditions, run it from multiple regions, and tag checks to group
them by environment or flow — production, checkout, auth.
-
Multi-region probes
3 regionsUS East (N. Virginia), Mumbai, and Singapore. Each location runs your check independently — a failure from one region with success from another points to a network issue, not an outage.
-
Assertions
all must passStatus code, response time, body content. The default asserts status equals 200; stack more conditions so a slow response or broken payload fails the check, not just a hard error.
-
Timing breakdown
per runEvery run splits total response time into DNS, TCP, TLS, TTFB, and download. A slow TLS handshake points to a different problem than a slow first byte.
-
Queryable spans
OTLPEach run is a span with a stable shape — l9.synthetic.check_id, http.ttfb_ms, http.status_code, and the rest. The same filter works in the Traces explorer, dashboards, and alert rules.
-
Alerts on checks
same engineAlert on failures and latency from synthetic spans using the alerting engine that already pages you for backend issues — no separate uptime-tool notification chain.
-
SSL checks
expiry: coming soonEvery HTTPS probe validates the server's TLS certificate chain today. Dedicated certificate-expiry checks — alert before the cert lapses, not after — are in the works.
Setup
No agent. No SDK. One dialog.
Synthetic Monitoring is on in every Last9 workspace. The target endpoint just needs to be reachable from the public internet — open Synthetic Monitoring in the sidebar, create a check, and the first runs land within the schedule you set.
Read the Synthetic Monitoring docs-
Point
Name the check, set the URL, method, headers, and request body. SSL verification is on by default.
-
Assert
Keep the default status-code assertion or add response-time and body-content conditions. All assertions must pass for a run to pass.
-
Schedule
Pick a frequency — down to every minute — and one or more probe regions. Enable immediately or save paused.
# Every run of a check — in Traces explorer, dashboards, alert rules
l9.synthetic.check_id = "<check-id>"

# Timing attributes recorded on every synthetic span
http.dns_time_ms        # DNS resolution
http.connect_time_ms    # TCP connect
http.tls_time_ms        # TLS handshake
http.ttfb_ms            # time to first byte
http.download_time_ms   # response download
http.status_code        # response status
After the first run you get:
- Pass/fail status and last-run time per check, per region
- View Trace on every run — timing breakdown from DNS to download
- Synthetic spans queryable in dashboards and ad-hoc analytics
- Alert rules on failures and latency — same engine as your backend alerts
What you can finally answer
Questions the postmortem will ask.
- Is it down everywhere, or just from Mumbai?
- Did latency creep up in the week before the outage?
- Was the slowness DNS, the TLS handshake, or time to first byte?
- Did the 2 a.m. failure return a 503 — or just hang?
- Which endpoints fail their response-time assertion most often?
- What did the failing run's full trace look like?
Stop paying a pinger that can't say why.
Synthetic Monitoring is already in your Last9 workspace. Create a check, pick your regions, and the first trace lands on the next scheduled run.

Start observing for free. No lock-in.
OpenTelemetry · Prometheus
Just update your config. Start seeing data on Last9 in seconds.
Datadog · New Relic · Others
We've got you covered. Bring over your dashboards & alerts in one click.
Built on Open Standards
100+ integrations. OTel native, works with your existing stack.