
Real User Monitoring
connected to backend traces.
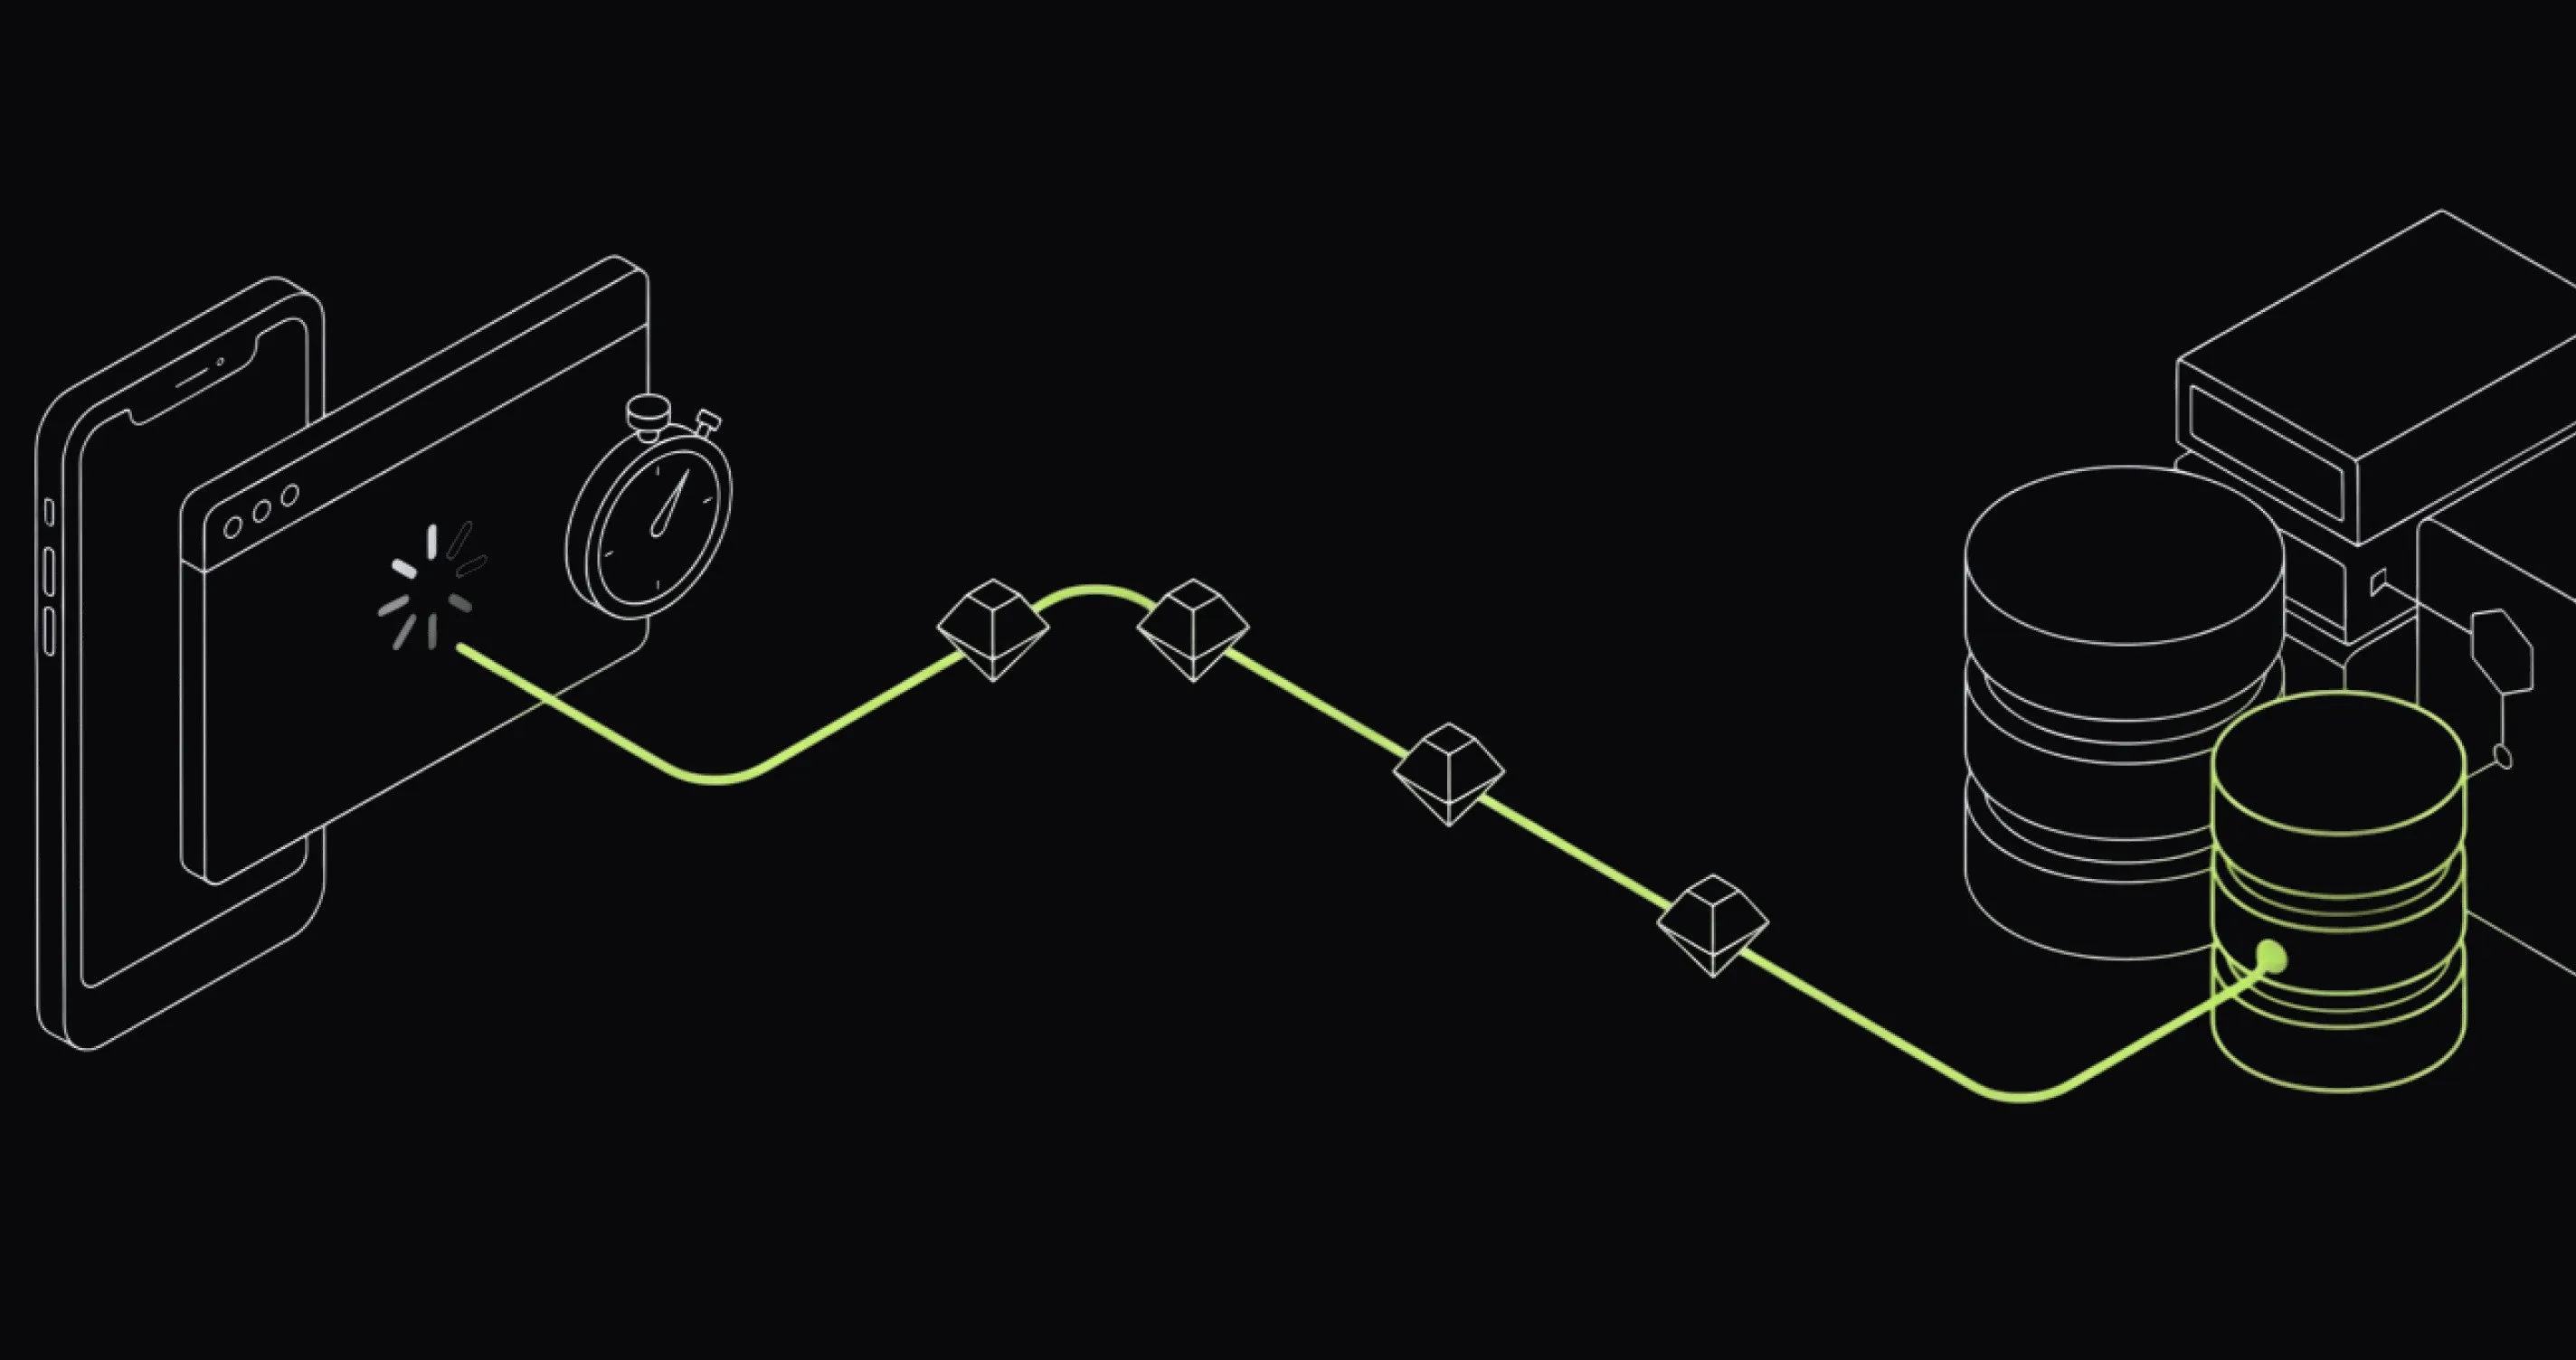
A 200ms API response. An eight-second page. Both can be true.
Real User Monitoring (RUM) captures performance, error, and network data from people using your web and mobile apps. Follow a slow view, error, or crash into the backend trace behind it. OpenTelemetry data, no screen recordings.
- 5 SDKs
- Web, Android, iOS, React Native, and Flutter
- One trace
- traceparent on your backend requests links frontend spans to backend work
- Mobile network timing
- DNS, TCP, TLS, and TTFB phase spans
- 0 to 100% sampling
- per-session rate configured in each SDK
Discover → Applications
Inspect real user performance by path, version, and environment.
Start with views and Core Web Vitals. Filter by application, environment, version, or path. From the same view, open affected errors, sessions, and traces.

Why RUM
Backend telemetry stops at the device.
A fast API span does not include DNS, TLS, CDN behavior, main-thread work, rendering, or the user's network. RUM adds that client context and links it to the trace you already use.
Frontend and backend need one trace
Without trace context, connecting a browser error to the API call behind it means matching timestamps by hand.
Telemetry without replay
Last9 captures spans, logs, vitals, errors, and crashes without recording the rendered DOM or screen.
Priced as telemetry, not per session
RUM spans and logs follow Last9's usage-based pricing. A traffic spike does not turn into a per-session bill spike.
Last9 sends RUM as OTLP spans and logs. Query it with the same trace, dashboard, and alerting workflows as backend telemetry.
How it works
How Last9 RUM connects frontend spans to backend traces.
Each SDK instruments sessions, views, network requests, errors, and
performance signals. The SDK adds W3C trace context to your backend
requests in a traceparent header. When the backend continues that context, the frontend request
and backend work share one distributed trace.
- Web · Android · iOS · React Native · Flutter sessions, views, network, errors, and vitals per real user
- Last9 correlation: session · view · frontend span · backend trace
Every span and log carries the
session ID. Calls to your backend carrytraceparentinto the trace. Open the session, then follow the affected request into its server trace. - Discover → Applications performance · errors · sessions · alerts on RUM metrics
Platform coverage
What each SDK captures.
All five SDKs capture sessions, views, network requests, and errors. Web adds Core Web Vitals. Mobile adds launch and screen timings; network spans include DNS, TCP, TLS, and TTFB.
-
Web
JavaScriptCore Web Vitals: LCP, FCP, CLS, INP, TTFB. JS errors and promise rejections, fetch/XHR requests, SPA route changes, sessions. Works with React, Angular, Vue, Next.js.
Setup guide → -
Android
KotlinOkHttp interceptor, activity-lifecycle view tracking, crashes, ANR detection, periodic CPU and memory samples.
Setup guide → -
iOS
SwiftURLProtocol network capture, UIKit and SwiftUI view tracking, crash capture, WebView session correlation.
Setup guide → -
React Native
TypeScriptBridges the native Android and iOS SDKs: fetch/XHR, React Navigation view tracking, JS and native errors, ANR detection on Android.
Setup guide → -
Flutter
DartDart plugin over the native SDKs: HttpClient override, NavigatorObserver view tracking, Flutter framework errors.
Setup guide → -
Your platform
?The SDKs speak OTLP with spans and logs. If your platform isn't listed, tell us what you're building and we'll work out the integration with you.
Request a platform →
Choose the right signal
How do RUM, synthetic monitoring, and session replay differ?
Real user monitoring tools explain production experience. Synthetic monitoring tests known paths on a schedule. Session replay reconstructs interface behavior. Last9 stores RUM and synthetic data as OpenTelemetry spans alongside backend telemetry.
| Dimension | Real User Monitoring | Synthetic monitoring | Session replay |
|---|---|---|---|
| Data source | Real browser and mobile sessions in production | Scheduled scripts from controlled locations | Recorded or reconstructed user-interface activity |
| Primary signals | Spans, logs, web vitals, errors, crashes, and network timings | Availability, timings, assertions, and scripted journey results | Clicks, navigation, DOM state, and visual playback |
| Best for | Finding device, release, network, and geography-specific failures | Catching known failures before users report them | Reviewing behavior and reproducing interface flows |
| Trace context | Last9 adds traceparent to your backend requests so frontend spans continue into backend traces | Each Last9 check run is its own OpenTelemetry span in the Traces explorer | Typically investigated separately from backend traces |
Setup
One init block per app.
Create a client monitoring token and initialize one SDK. Web uses a script tag; mobile initializes at app entry. The SDK exports directly to your Last9 OTLP endpoint.
Read the RUM docs Read the production setup walkthrough →<script src="https://cdn.last9.io/rum-sdk/builds/stable/v2/l9.umd.js"></script>
<script>
L9RUM.init({
baseUrl: "https://<your-last9-otlp-endpoint>",
headers: { clientToken: "<your-client-token>" },
resourceAttributes: {
serviceName: "your-app-name",
deploymentEnvironment: "production",
appVersion: "1.0.0",
},
// link frontend spans to your backend traces
network: {
backendCorrelation: {
enabled: true,
corsAllowedOrigins: ["https://api.your-app.com"],
},
},
});
// optional: tie sessions to a user on login
L9RUM.identify({ id, email, name });
</script>// settings.gradle.kts:
// maven { url = uri("https://cdn.last9.io/rum-sdk/android/maven/") }
// build.gradle.kts:
// implementation("io.last9:rum-android:1.1.2")
L9Rum.initialize(
this,
L9RumConfig(
baseUrl = "https://<your-last9-otlp-endpoint>/v1/otlp/organizations/<org>",
origin = "android://com.example.myapp",
clientToken = "<your-client-token>",
serviceName = "my-android-app",
serviceVersion = "1.0.0",
deploymentEnvironment = "production",
)
)import Last9RUM
let config = L9RumConfig(
baseUrl: "https://<your-last9-otlp-endpoint>/v1/otlp/organizations/<org>",
clientToken: "<your-client-token>",
serviceName: "my-ios-app",
serviceVersion: "1.0.0",
deploymentEnvironment: "production"
)
L9Rum.shared.initialize(config: config)// npm install https://cdn.last9.io/rum-sdk/react-native/builds/stable/v1/last9-rum-react-native.tgz
import { L9Rum } from "@last9/rum-react-native";
L9Rum.initialize({
baseUrl: "https://<your-last9-otlp-endpoint>/v1/otlp/organizations/<org>",
origin: "https://your-app-origin",
clientToken: "<your-client-token>",
serviceName: "my-rn-app",
serviceVersion: "1.0.0",
deploymentEnvironment: "production",
});import 'package:last9_rum_flutter/last9_rum_flutter.dart';
void main() async {
WidgetsFlutterBinding.ensureInitialized();
await L9Rum.initialize(const L9RumConfig(
baseUrl: 'https://<your-last9-otlp-endpoint>/v1/otlp/organizations/<org>',
origin: 'https://your-app-origin',
clientToken: '<your-client-token>',
serviceName: 'my-flutter-app',
serviceVersion: '1.0.0',
deploymentEnvironment: 'production',
));
runApp(const MyApp());
}After setup you get:
- Sessions, views, network, errors, and vitals captured automatically
- Frontend spans linked to backend traces via traceparent on your backend requests
- Mobile network calls broken into DNS, TCP, TLS, and TTFB phase spans
- Alerts on error rate, p95 latency, crashes, and ANRs use the same engine as your backend alerts
Investigations
What can real user monitoring tell you?
- Which pages saw LCP move after a release?
- Is checkout slow because of our API or the user's network?
- Which app versions and devices throw this crash?
- What did the session do in the thirty seconds before the error?
- Which API endpoints fail most for real users, by geography?
- Did yesterday's backend deploy slow down the mobile app's screens?
Implementation details
What should developers know before adding Last9 RUM?
The details developers and platform teams usually need before instrumenting production applications.
What is real user monitoring?
Real user monitoring (RUM) collects performance, error, and network telemetry from people using a web or mobile application in production. It reveals differences by device, release, geography, and network that synthetic tests and backend-only monitoring can miss.
Read the complete RUM guide →Is Last9 RUM OpenTelemetry-native?
Yes. The SDKs emit spans and logs over OTLP. With backend correlation on (as in the setup snippet), they add W3C trace context to your backend requests, so the frontend request and backend work appear in the same distributed trace.
Read the RUM architecture and setup docs →Which platforms does Last9 RUM support?
Last9 provides SDKs for web, Android, iOS, React Native, and Flutter. Each SDK captures sessions, views, network activity, and errors; platform-specific signals include Core Web Vitals on the web, crashes and launch timings on mobile, and ANR detection on Android.
Choose a platform guide →Does Last9 RUM record session replays?
No. Last9 records diagnostic telemetry rather than the rendered DOM or screen video. Session and view identifiers provide the context around errors, network calls, and performance signals without storing a visual replay of the user's session.
How does RUM sampling work?
Sampling is configured per session during SDK initialization. Use a lower percentage for high-volume production traffic and higher coverage for staging or lower-volume applications. A sampled session keeps its views, errors, and network activity together so investigations retain coherent context.
Review SDK configuration →How is Last9 RUM priced?
Last9 prices RUM as ingested telemetry rather than by recorded session. RUM spans and logs count as events under the same usage-based model as other observability data sent to Last9.
See current Last9 pricing →Can I alert on RUM signals?
Yes. Last9 can alert on signals including error rate, p95 latency, crashes, and ANRs. RUM alerts use the same alerting engine as backend telemetry, so frontend and backend conditions can follow the same operational workflow.
Configure RUM alerts →Trace the next slow screen to its backend cause.
Install one SDK. Every session lands in Discover → Applications and links to the backend traces you already use.

Start observing for free. No lock-in.
OpenTelemetry · Prometheus
Just update your config. Start seeing data on Last9 in seconds.
Datadog · New Relic · Others
We've got you covered. Bring over your dashboards & alerts in one click.
Built on Open Standards
100+ integrations. OTel native, works with your existing stack.