

Know what you run. Fix what matters.
Auto-discover everything you run and trace problems to root cause—fast. Debug production issues with AI directly in your IDE.
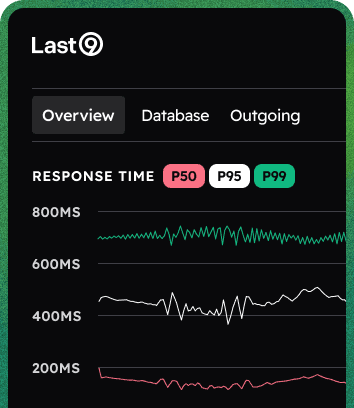
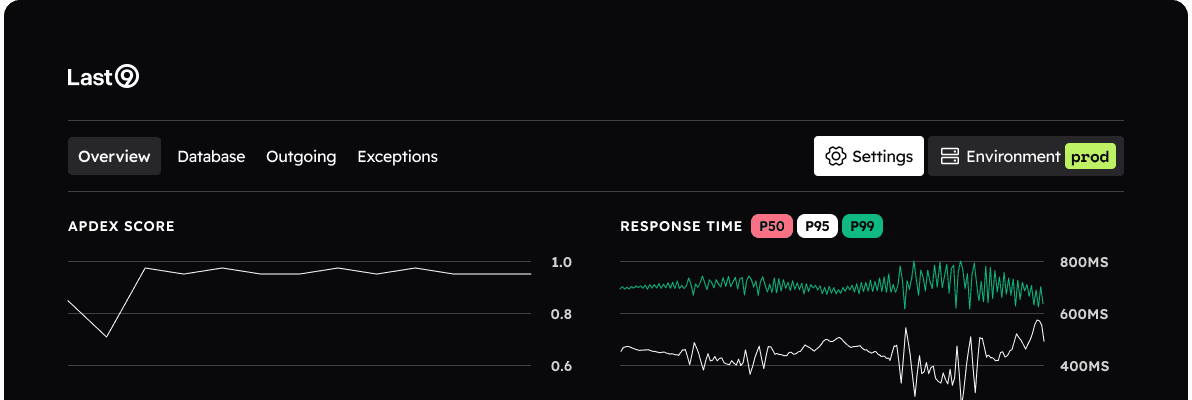
Use Discover to show causes, not just symptoms
Discover goes deeper than "service is slow" with ops, DB calls, exceptions, all correlated with telemetry.
Beyond service catalogs. Always up-to-date inventory of services, clusters, jobs, and hosts.
Jump from alerts to correlated logs, metrics, and traces without changing context or tools.
Use Last9 with Claude, Cursor, or Slack to get hypothesis and RCA reports along with fix recommendations.
For the needs of modern-day micro-services architectures.


Discover Services
- Know every service, its health, dependencies, and user impact.
- Operation analytics: latency, errors, throughput, saturation.
- Exceptions & slow queries with drill-downs.
- Outgoing calls + DB/Cache breakdowns. Instant pivots to related logs & traces.
- Auto-mapped upstream/downstream dependencies.


Discover Kubernetes
- See deployments, pods, resources the way you actually run them.
- Live view of deployments, pods, nodes. CPU / memory / network / storage utilization.
- Pod-level errors and restarts; workload hot-spots.
- See deployment → pod health with CPU/mem/network and restart patterns for fast isolation.


Discover Jobs
- Background & async, finally visible.
- Execution success/failures, retries, and durations.
- Queue/consumer breakdowns and throughput trends.
- Exception hotspots and payload-level context.
- Related traces/logs for stuck or poison messages.


Discover Hosts
- When it's not the code, it's the box.
- CPU, memory, disk, network, and process metrics.
- Noisy-neighbor detection and saturation alerts.
- Host → service/process correlation for quick isolation.
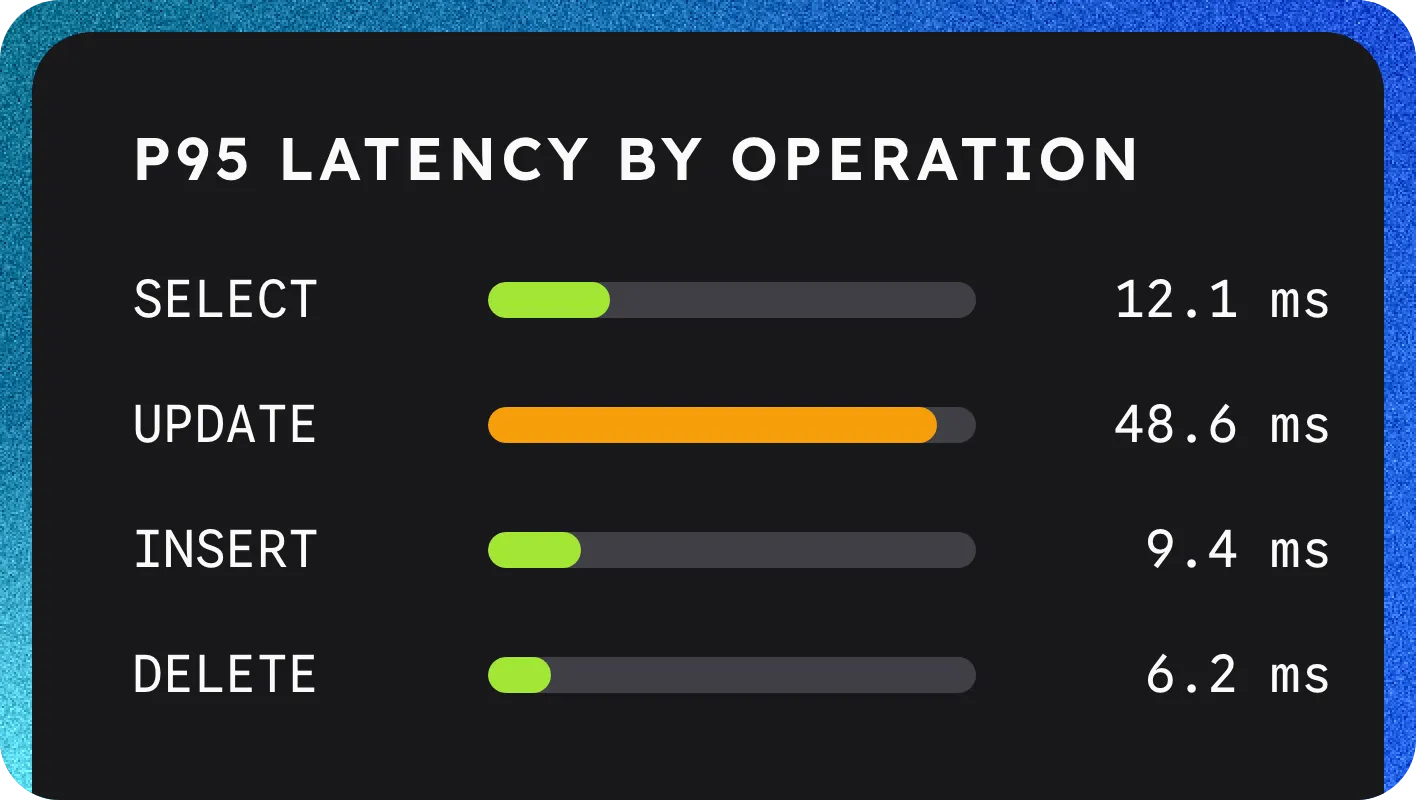
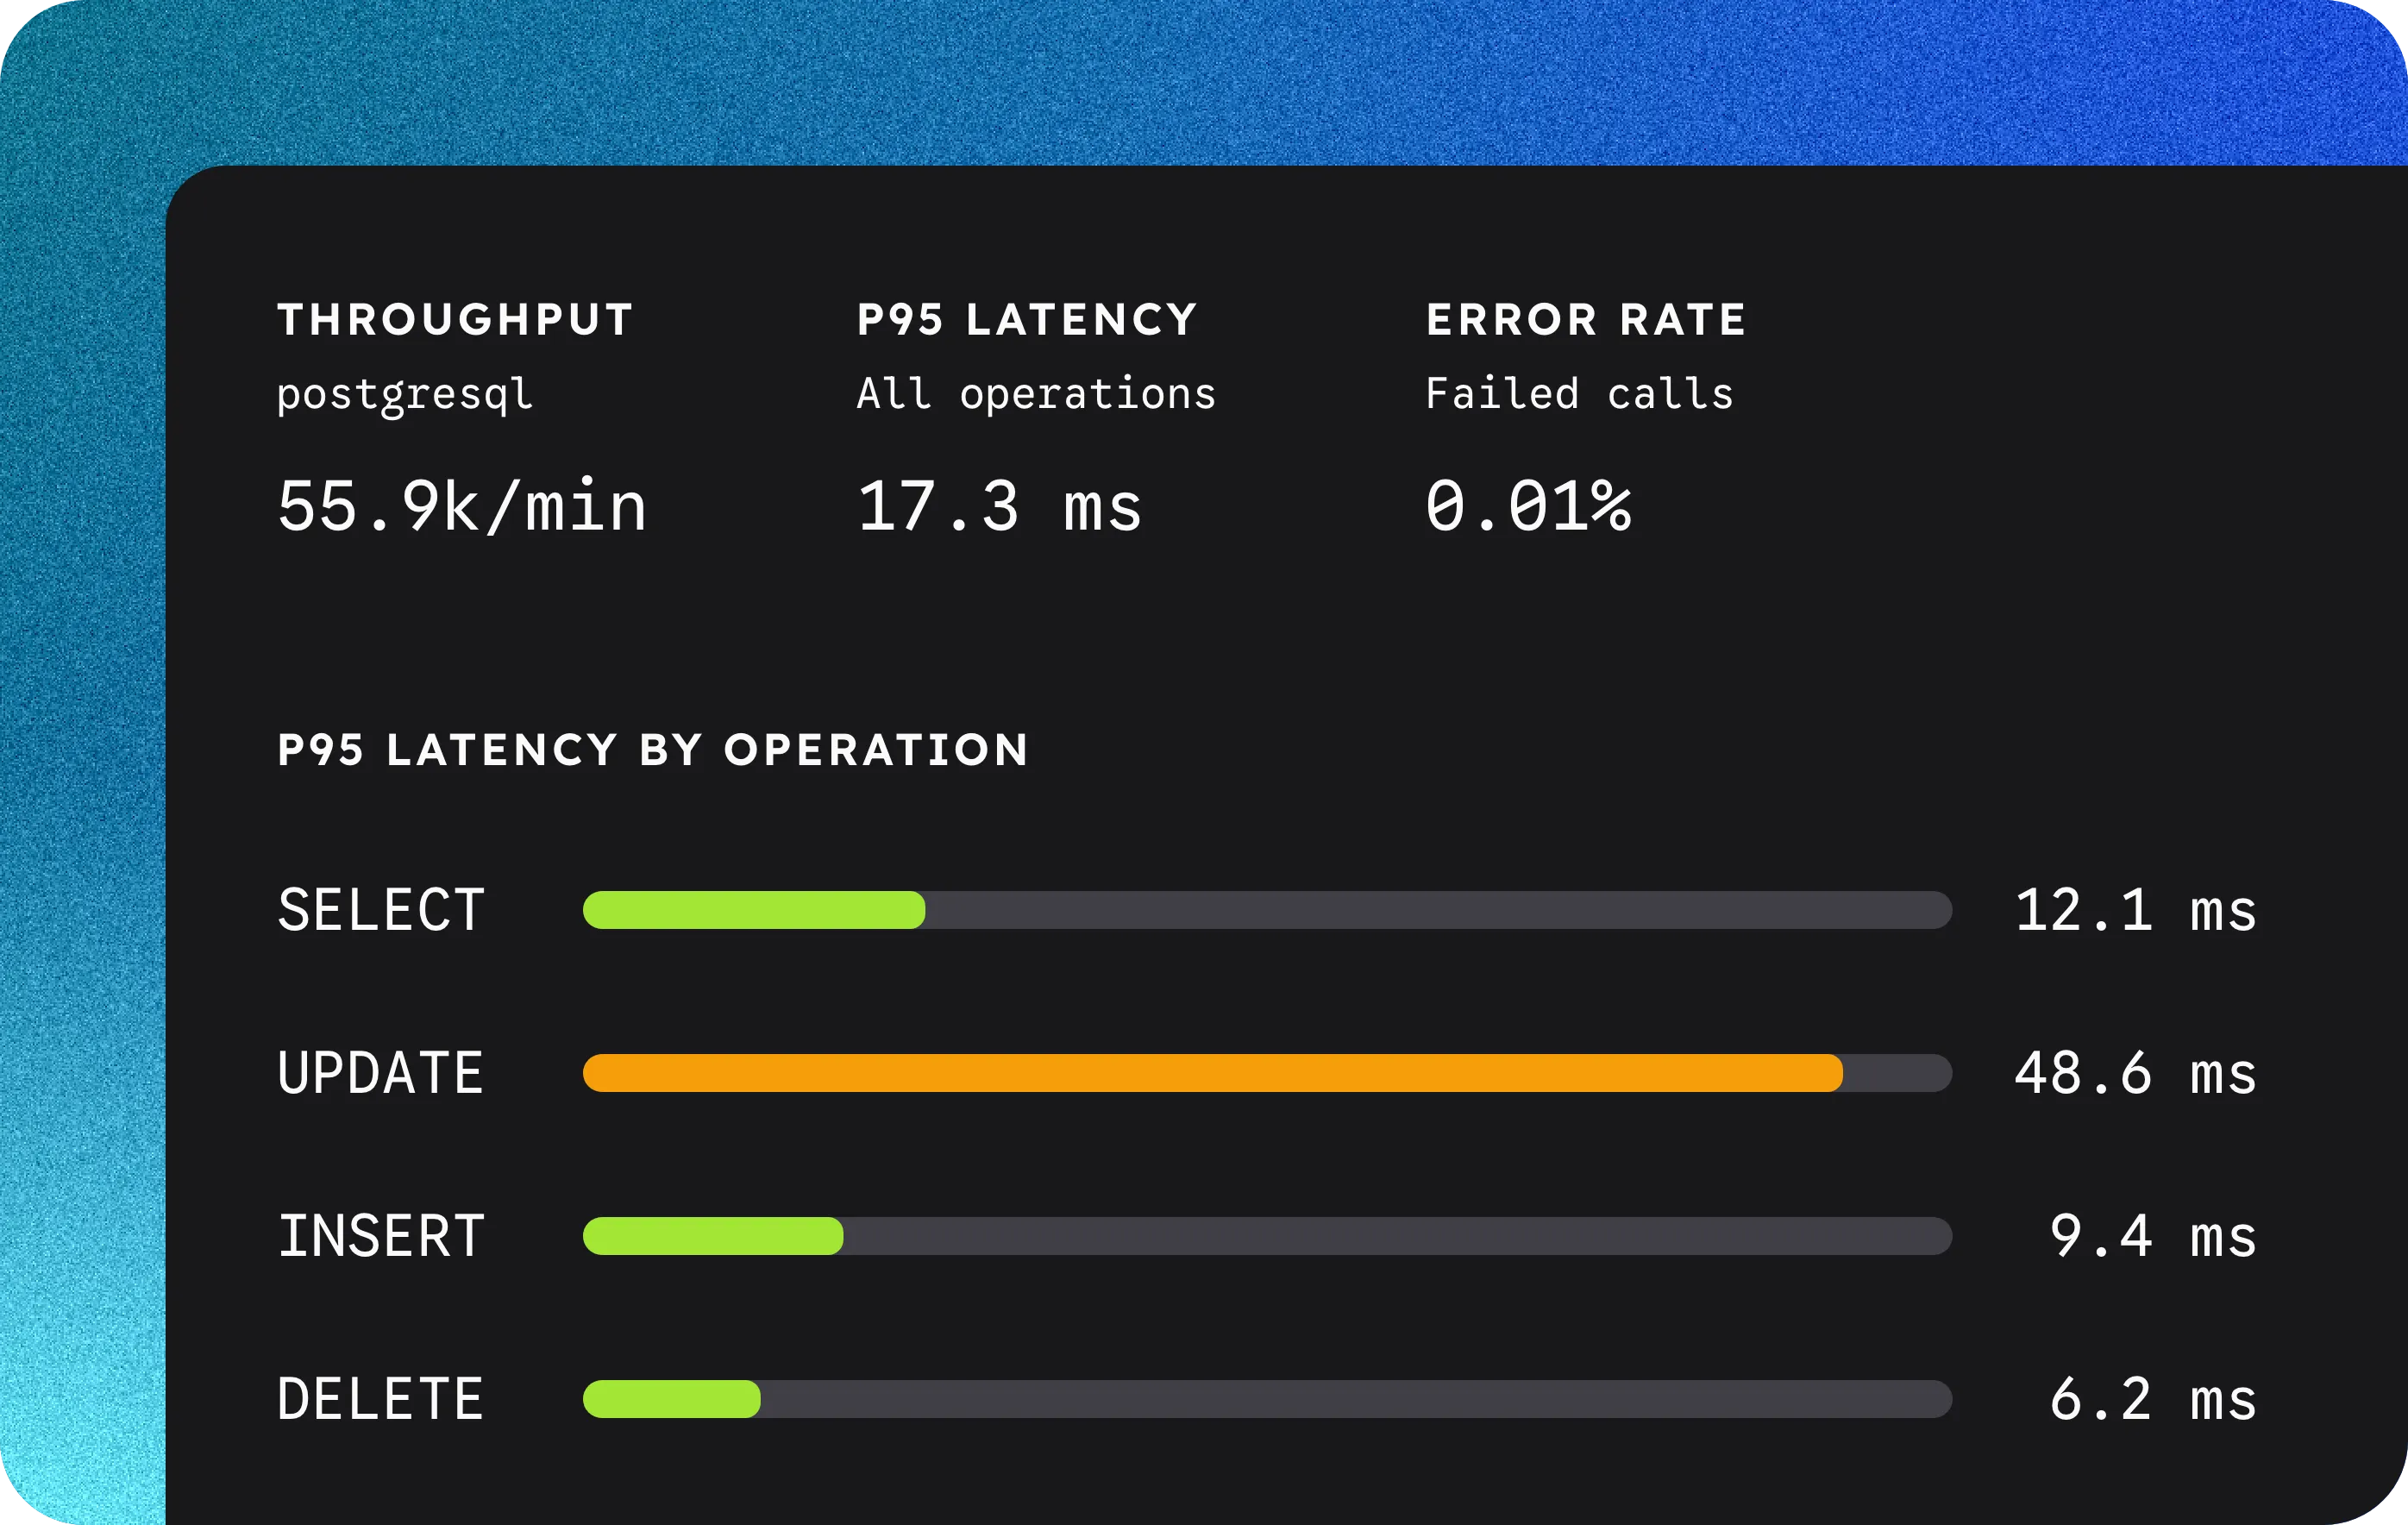
Discover Databases
- Every datastore your services query, with nothing to install on the database server.
- Throughput, error rate, and P95 latency per database and per operation.
- Slowest and most frequent queries, each linked to its traces.
- Top services by load: find the one consumer before you scale the instance.
Agents Monitoring
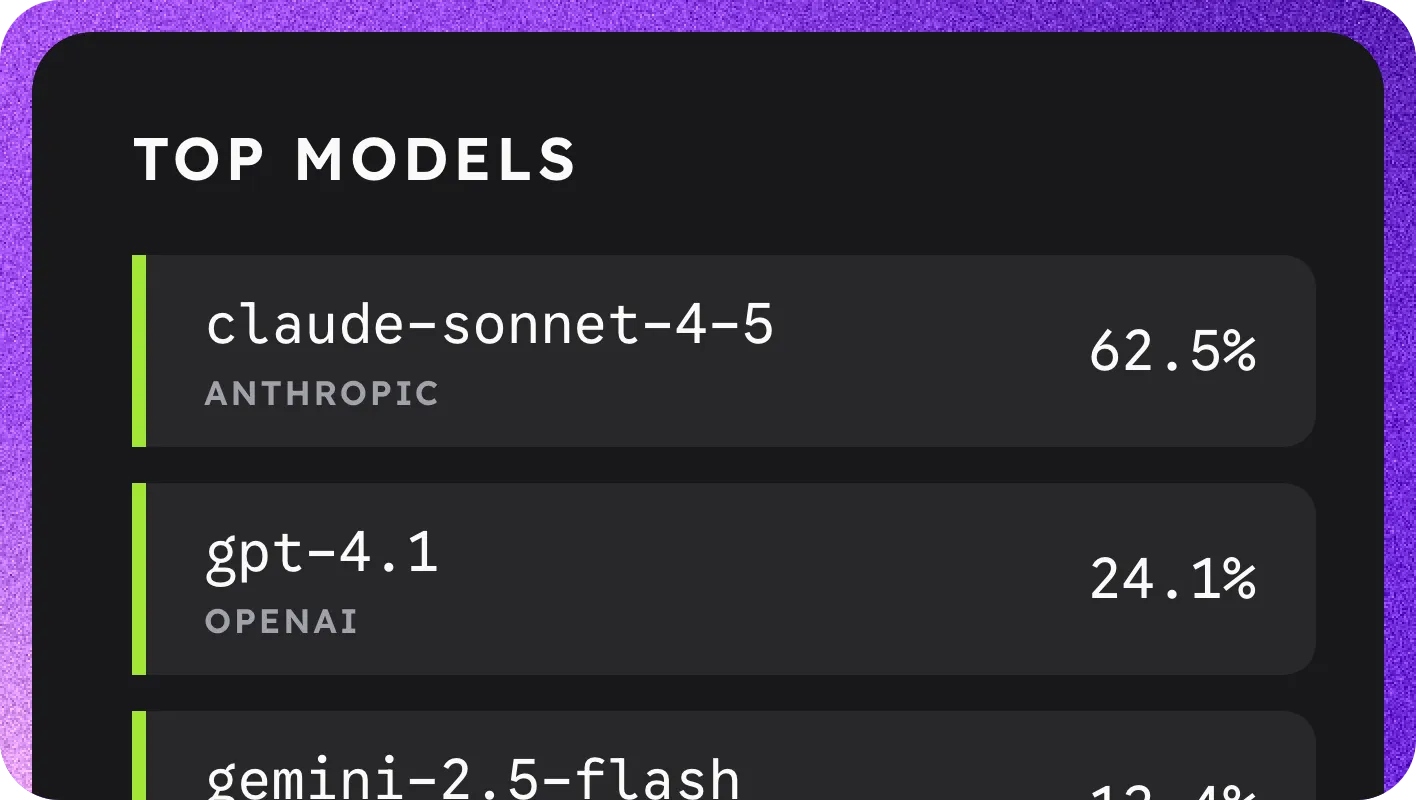
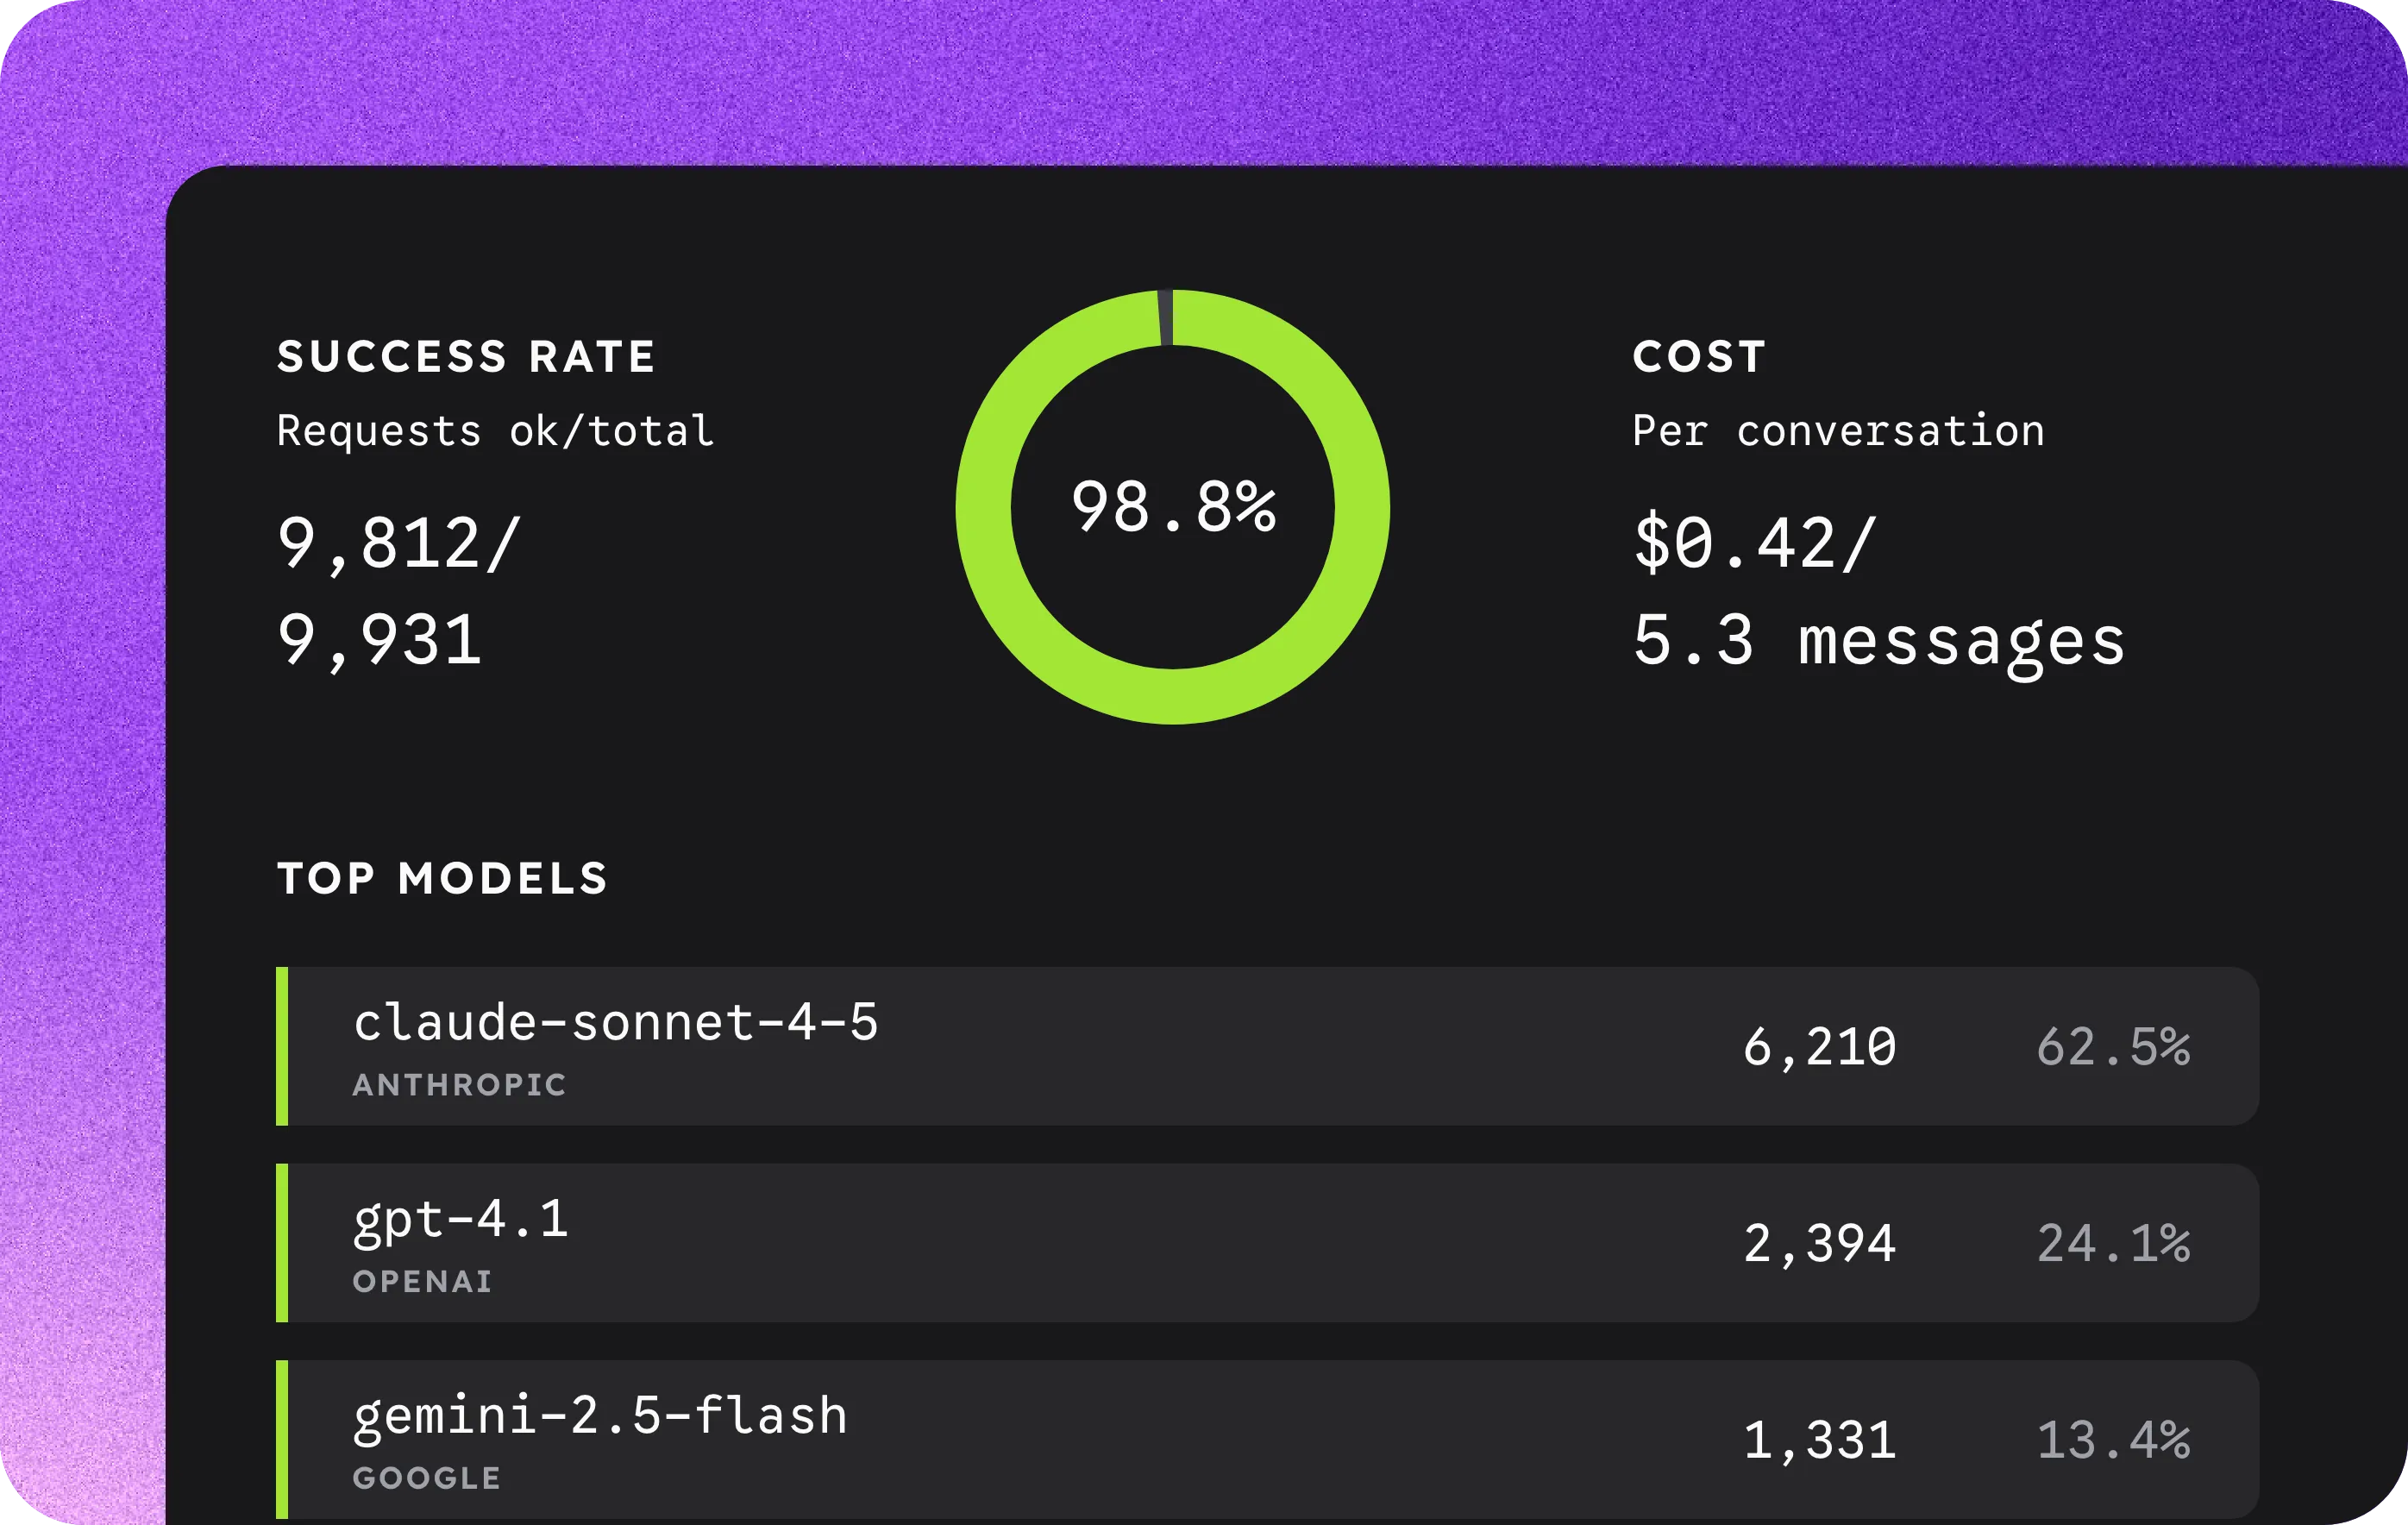
- What your LLM calls cost, how long they take, and which ones fail.
- Cost per conversation, total tokens, and P50 to P99 latency.
- Every slow or failing call links to its full request trace.
- Top models and providers actually serving traffic.
Last9 helped us forget all the different observability tools and consolidate every dashboard into one single place.
Rahul Mahale
Principal DevOps Engineer
Frequently asked questions

Can't find the answer to your question?
Talk to our support team for help.
- Services: operation-level latency/errors, dependencies, DB/queue breakdowns.
- Applications (RUM): real-user sessions, errors, and performance for web and mobile apps.
- Databases: per-datastore throughput, errors, and latency derived from trace spans.
- Kubernetes: deployments/pods/nodes, restarts, resource hot-spots.
- Jobs: successes/failures, retries, durations, queue/consumer health.
- Hosts: CPU/mem/disk/net/process and app↔host correlation.

Start observing for free. No lock-in.
OpenTelemetry · Prometheus
Just update your config. Start seeing data on Last9 in seconds.
Datadog · New Relic · Others
We've got you covered. Bring over your dashboards & alerts in one click.
Built on Open Standards
100+ integrations. OTel native, works with your existing stack.


