
Product
Using Dashboards
Use variables, time controls, and sharing to get the most out of your Last9 dashboards

Once you have created a dashboard, you can use variables for dynamic filtering, configure time controls, share dashboards with your team, and manage them over time.
Variables
Variables let you create dynamic, reusable dashboards by replacing hardcoded values in queries with selectable dropdowns.
Variable Types
| Type | Description | Example |
|---|---|---|
| Static | A fixed list of values you define manually | Environment: production, staging, development |
| Label (Dynamic) | Values auto-populated from a data source | Service names fetched from your metrics |
Creating a Variable
- Open a dashboard and click Settings
- Navigate to the Variables section
- Click Add Variable
- Enter a display name (shown in the dropdown) and a target name (used in queries)
- Choose Static and enter your values, or choose Label and configure the data source
- Enable Multiple selection if you want users to select more than one value at once
- Click Save
Using Variables in Queries
Reference variables in your panel queries using the $ syntax:
rate(http_requests_total{service="$service", env="$environment"}[5m])You can also use the bracket syntax ${variable_name} when the variable is adjacent to other text.
Built-in Variables
Last9 provides several built-in variables that are automatically available in all dashboard queries:
| Variable | Description |
|---|---|
$__interval | Recommended step interval based on the time range and panel width (e.g., 1m) |
$__interval_ms | Same as $__interval in milliseconds |
$__rate_interval | Recommended interval for rate() functions (e.g., 4m) |
$__range | The full duration of the selected time range (e.g., 5m) |
Time Controls
Time Range
Set the dashboard time range using the time picker in the top-right corner. You can specify:
- Relative time: A duration from now, such as “Last 1 hour” or “Last 24 hours”
- Absolute time: A specific start and end time in UTC
The selected time range applies to all panels on the dashboard.
Auto-Refresh
Enable auto-refresh to keep your dashboard data current. Available intervals:
| Interval | Description |
|---|---|
| Off | No automatic refresh |
| 30 seconds | Near real-time monitoring |
| 1 minute | Active incident investigation |
| 3 minutes | General monitoring |
| 5 minutes | Standard operational dashboards |
| 10 minutes | Long-term trend analysis |
Organizing Dashboards
As the dashboard count grows, the list page keeps the ones you actually use within reach.
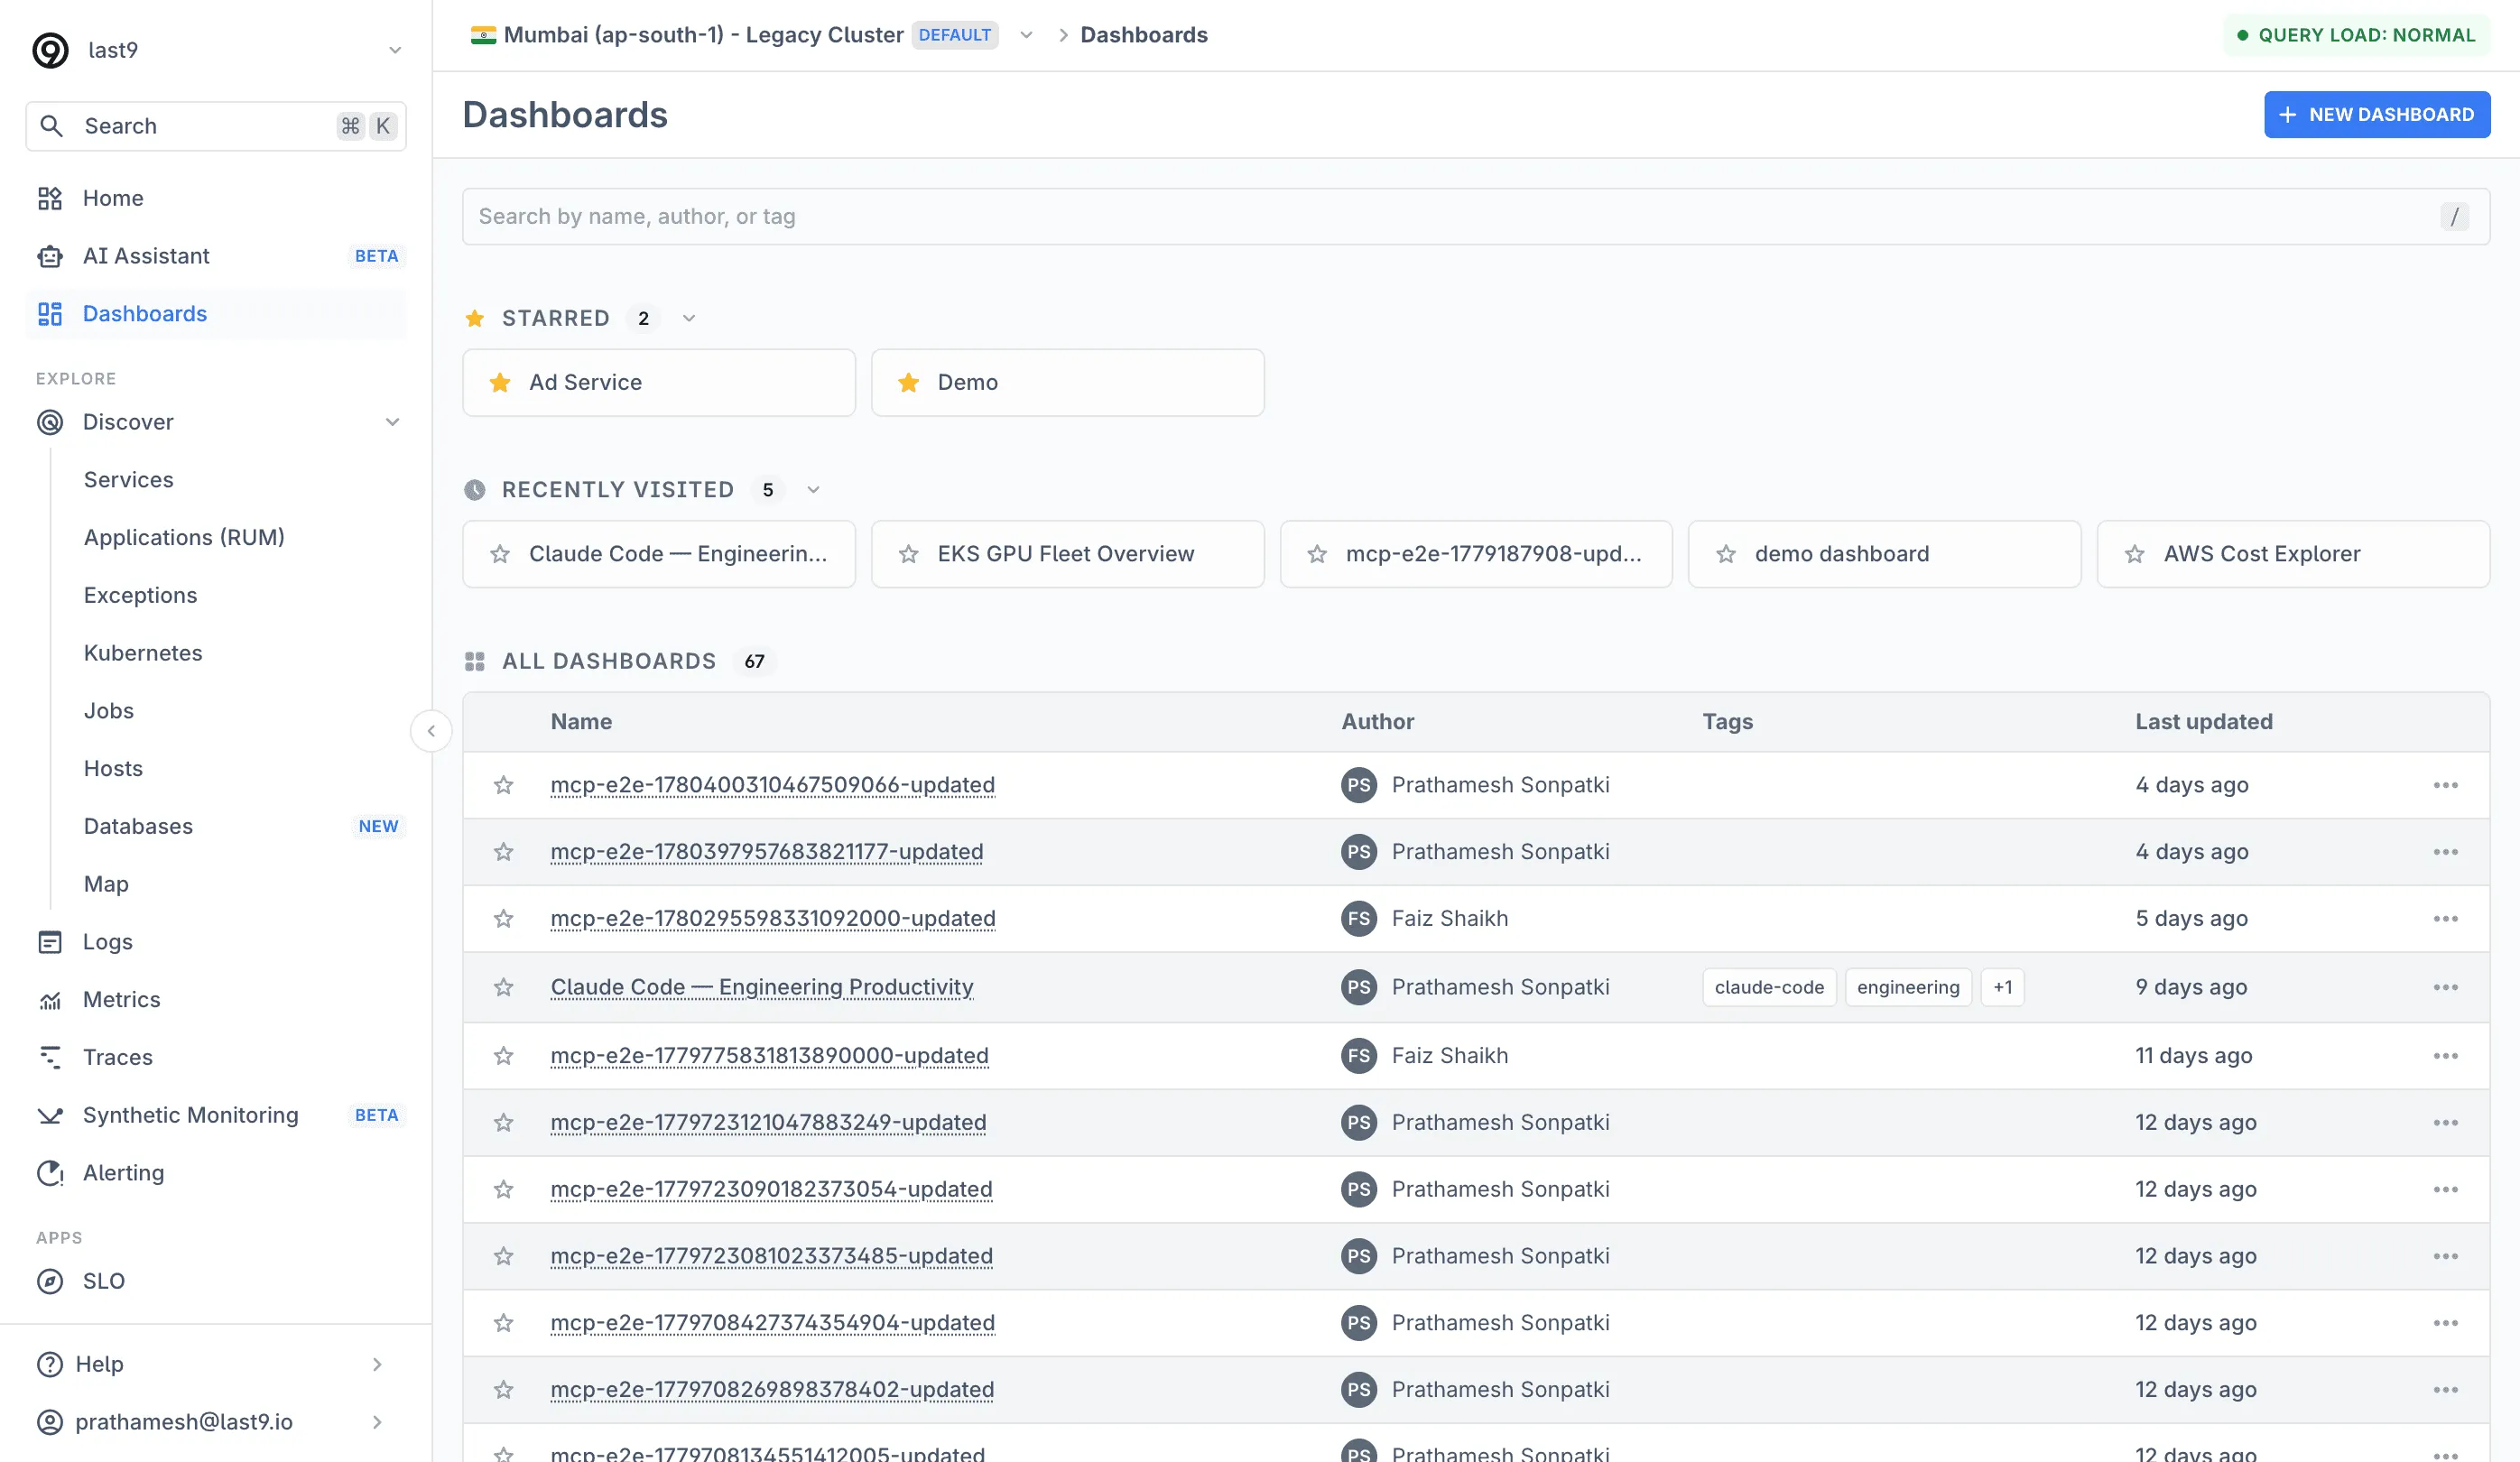
Starred Dashboards
Star a dashboard from the list or from the star button in the dashboard header. Starred dashboards appear as a collapsible card grid above the table. Stars are saved to your user profile, so they follow you across devices.
Recently Visited
The list tracks your last 8 visited dashboards per organization and shows them as a collapsible card grid below the starred section — no setup needed.
Tags
Add tags to a dashboard when saving it, or later via Edit in the dashboard’s actions menu. Tags render as chips in the list, and clicking a tag adds it as a search filter — one click to see every dashboard tagged production or kafka.
Search
The search box matches dashboard names, authors, and tags. Active search filters persist in the URL as query params, so a filtered view survives refresh and can be shared as a link.
Sharing Dashboards
Share dashboards with team members or external stakeholders via public, view-only links. Anyone with the link can open the dashboard without logging in.
- Open the dashboard you want to share
- Click the Share button
- Pick a Valid For duration —
3 Hours,6 Hours(default),12 Hours,1 Day,2 Days, or3 Days. Admins can also pick Forever - Optionally enter email addresses to notify recipients with the link
- If you picked Forever, tick the acknowledgement that the link won’t expire and must be manually revoked
- Click Share Dashboard to generate the link
Share Properties
| Property | Description |
|---|---|
| Validity | How long the link stays active. Fixed durations from 3 Hours to 3 Days, or Forever (admins only). |
| Status | Active while the link works; becomes Expired once it elapses or is revoked |
| Access level | View-only public access — recipients do not need a Last9 login |
Revoking a Shared Link
Open the Share dialog and switch to Active Shares to see all live links for the dashboard. Click Revoke on any link to expire it immediately — anyone currently viewing it loses access on their next request, and recipients are not notified.
Admins can revoke any active share. Non-admins can only revoke shares they created.
Embedded Dashboards
Last9 supports embedding dashboards into external applications (custom portals, internal tools, status pages) via a token-authenticated embed API. There’s no self-serve UI for this yet — please get in touch with us at cs@last9.io to set up an embed token for your org.
Managing Dashboards
Editing a Dashboard
- Edit panels: Click the ⋮ menu on any panel and select Edit to modify its query, visualization type, or configuration
- Rearrange panels: Drag panels to reposition them on the grid
- Resize panels: Use the resize handles at panel edges to adjust dimensions
Chart Interactions
- Zoom: Zoom in and out on any chart to focus on a spike or step back for context — without changing the dashboard’s time range
- Graph aggregation: Graph legends support
avgas a summary aggregation alongside the existing options, so a legend can show the average over the window instead of only last/max/min values
Duplicating and Deleting
- Duplicate: Create a copy of an existing dashboard to use as a starting point
- Delete: Remove a dashboard permanently from the dashboards list
Best Practices
Naming and organization:
- Use descriptive dashboard names that include the service or team (e.g., “API Gateway - Production”)
- Use Section panels to group related panels together
- Keep dashboards focused on a single service or workflow
Panel design:
- Place the most important metrics at the top of the dashboard
- Use Stat panels for key numbers and Timeseries panels for trends
- Apply consistent units across related panels
- Set meaningful thresholds on heatmaps and status history panels
Variables and filtering:
- Add environment and service variables to make dashboards reusable across teams
- Use dynamic (label-based) variables to automatically pick up new values from your data
- Enable multi-select on variables when users need to compare across dimensions
Performance:
- Avoid adding too many panels with overlapping queries to a single dashboard
- Use
$__rate_intervaland$__intervalto let queries adapt to the selected time range - For high-cardinality data, add filters to reduce the number of series returned
Troubleshooting
Please get in touch with us on Discord or Email if you have any questions.