
Product
Creating an Alert Rule
A step-by-step guide to creating metrics and log Alert Rules in Last9 using the rule editor with a live firing preview.
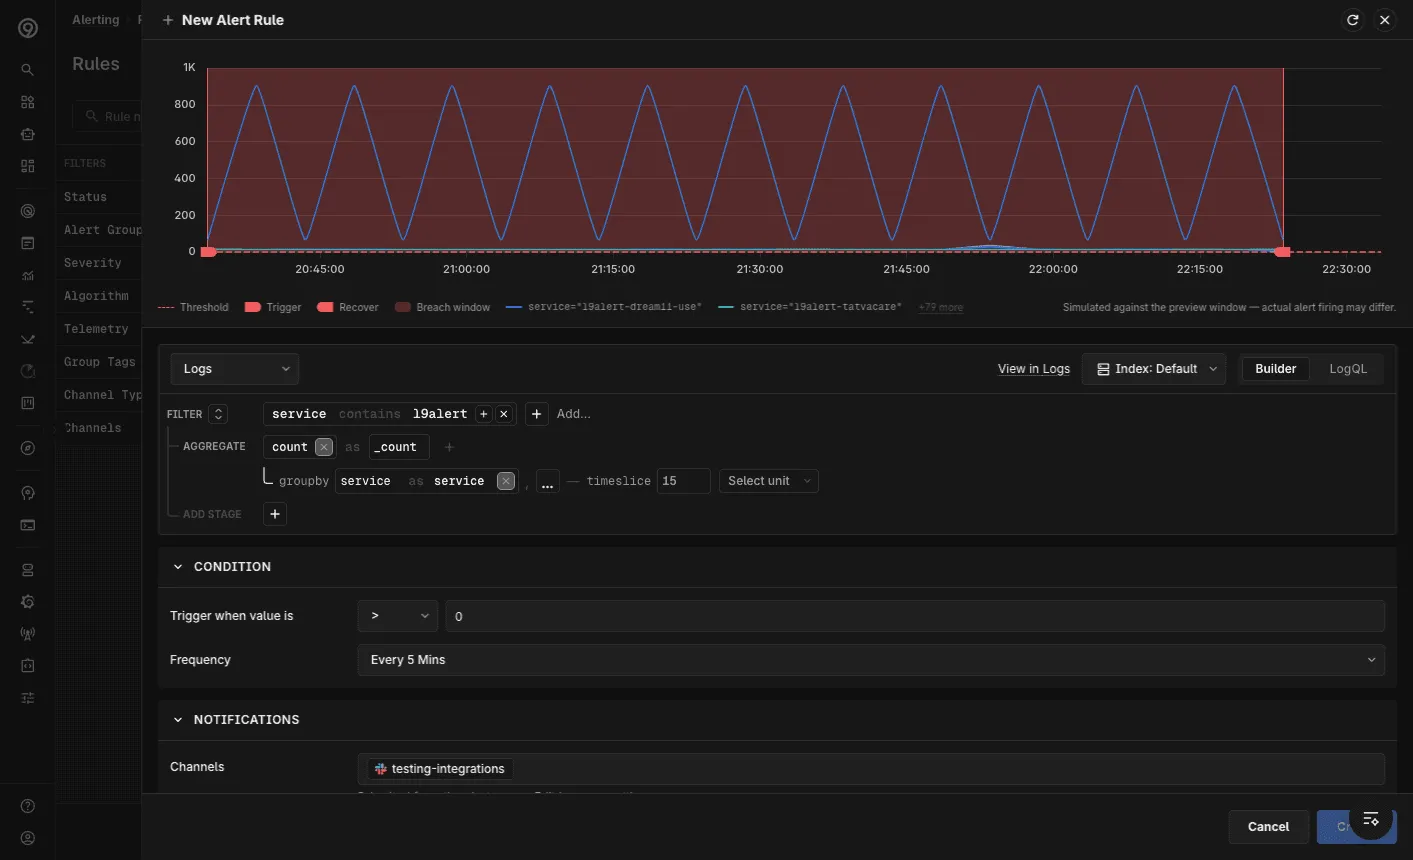
You create and edit both metrics and log rules in the Alert Rule editor. It pairs a live preview, which simulates when the rule would have fired against recent data, with a Query, Condition, Notifications, and Rule Settings form.
Picking an Alert Group
From the Rules page, click Create. You first pick the Alert Group the rule belongs to:
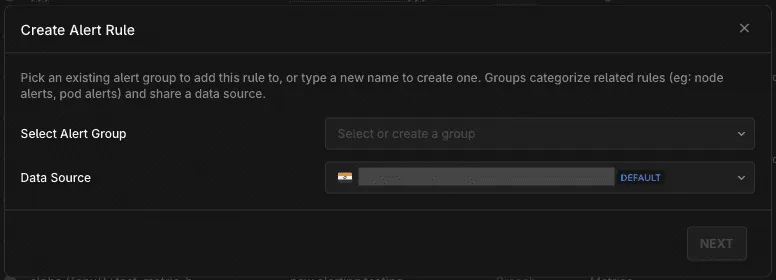
- Select Alert Group — choose an existing group, or type a new name to create one. Groups categorize related alerts (for example, node alerts or pod alerts) and share a data source.
- Data Source — the metrics source the rule queries. It is inherited from the group; the group’s default is marked accordingly.
Click Next to open the editor. To edit an existing rule, use the Edit row action on the Rules page instead.
Query
Choose the telemetry type — Metrics or Logs — from the dropdown at the top of the Query section. Each type offers two modes:
- Builder — a guided, no-code way to construct the query in stages.
- PromQL / LogQL — write the query directly, with auto-complete suggestions.
For metrics, the Builder composes stages like Filter, Range, and Aggregate; it supports a set of common functions, so for more complex functions or multi-metric queries, use PromQL. For logs, the Builder composes a Filter and an Aggregate stage (count, group-by, timeslice, and unit), and you can choose the log Index. Use View in Metrics / View in Logs to open the query in the corresponding explorer.
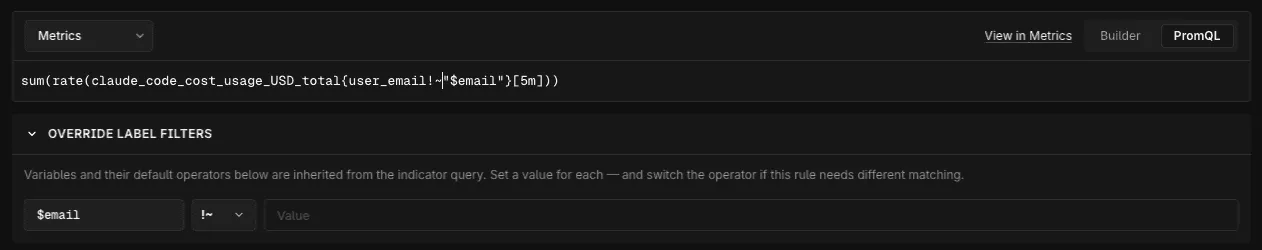
Override Label Filters
For metrics rules in PromQL mode, if the query uses variables an Override Label Filters section appears. The variables and their default operators are inherited from the query; set a value for each, and switch the operator if this rule needs different matching. Operators are =, !=, =~, and !~.
Condition
The Condition section defines when the rule fires.
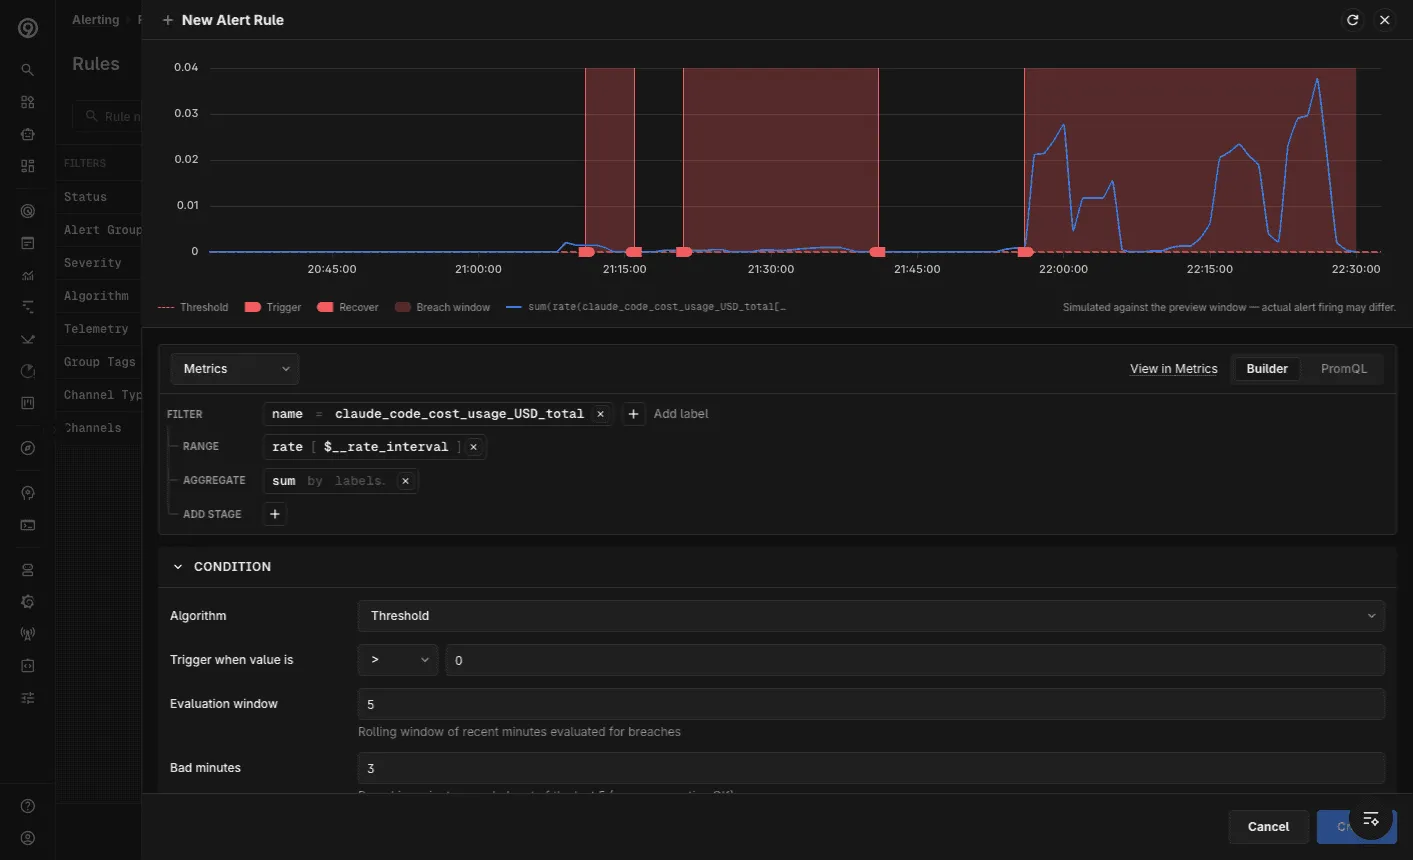
Metrics — Threshold
Select the Threshold algorithm to fire on a fixed value:
- Trigger when value is — an operator (
>,>=,<, …) and a value. - Evaluation window — the rolling window, in minutes, of recent data evaluated for breaches.
- Bad minutes — the number of breaching minutes needed within that window before the rule fires. They need not be consecutive.
Requiring several bad minutes within a rolling window filters out momentary spikes.
Metrics — Adaptive
Select the Adaptive algorithm to fire on deviation from a baseline learned from historical data, instead of a fixed threshold:
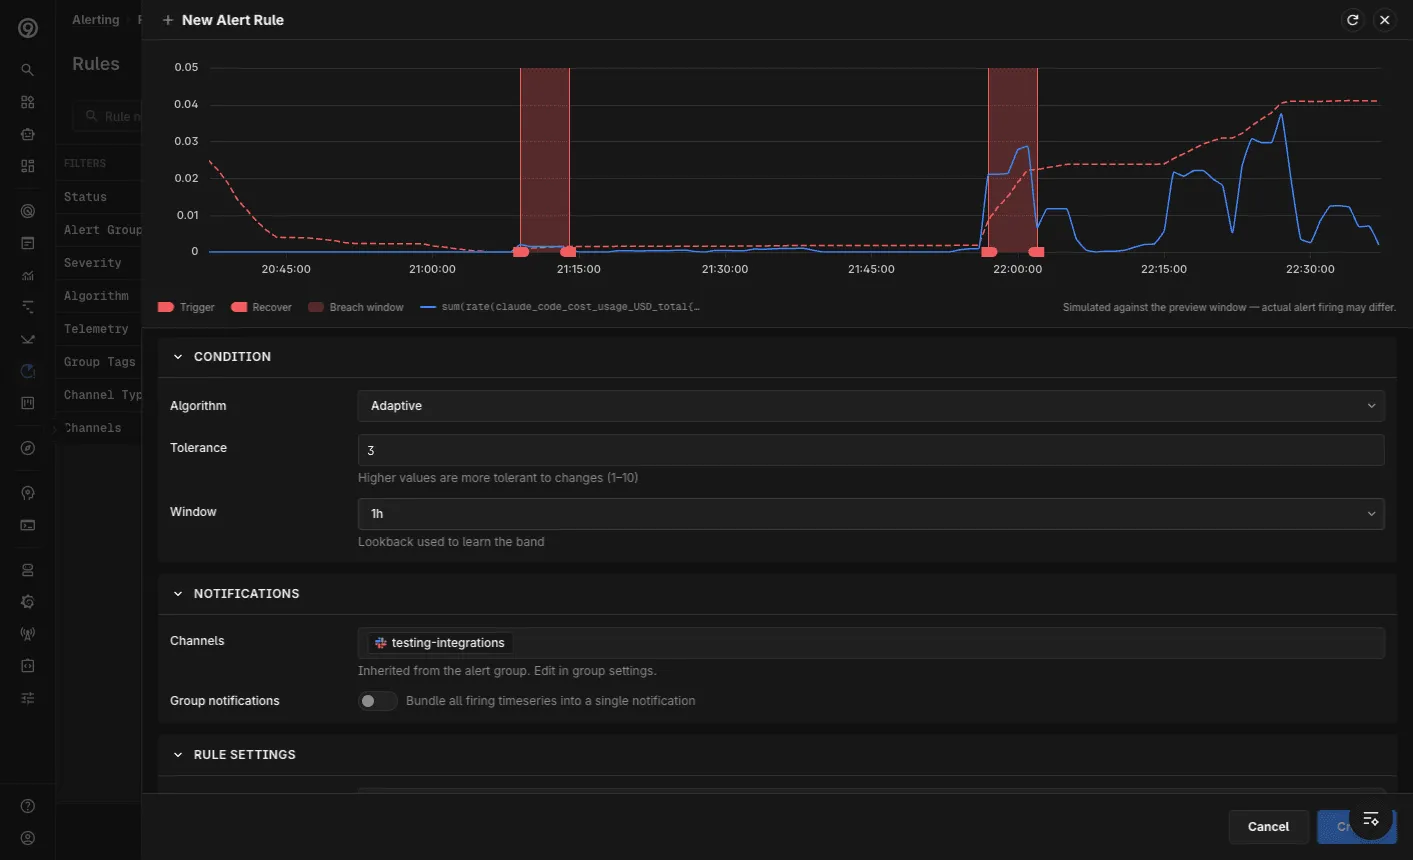
- Tolerance — how tolerant the rule is to change, from 1–10. Higher values are more tolerant.
- Window — the lookback used to learn the band (for example,
1h).
The preview renders the learned band so you can see what the rule treats as anomalous. See Adaptive Alerting for the statistical model.
Logs
For log rules, the condition is a Trigger when value is operator and value, plus a Frequency — how often the rule runs. The frequency is derived automatically from the query’s timeslice.
Notifications
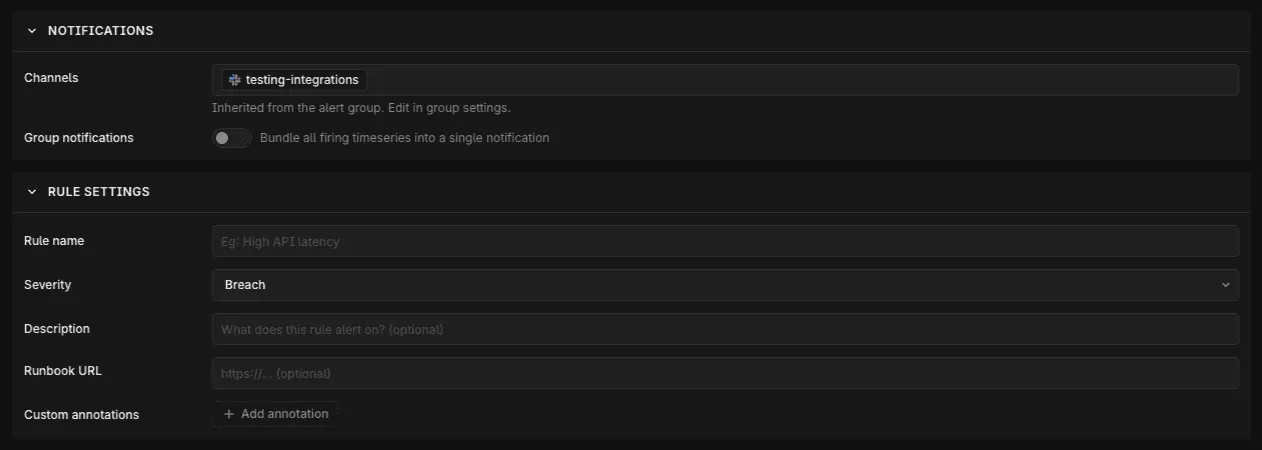
- Channels — the Notification Channels the rule notifies are inherited from the Alert Group. Edit them in the group’s settings.
- Group notifications — enable to bundle all firing timeseries into a single notification instead of one per timeseries. Recommended to avoid noise; grouped notifications call out the count of labelsets and values.
Rule Settings
- Rule name — keep it short and identifiable; the name is shown alongside the Alert Group name in notifications.
- Severity — Breach or Threat. Severity is metadata used by integrations like PagerDuty and Opsgenie to route and prioritize.
- Description — what the rule alerts on (optional).
- Runbook URL — a link to the runbook for this alert (optional).
- Custom annotations — add
key:valueannotations that are sent with every notification.
Dynamic Annotations
The description, runbook, and custom annotations can include dynamic values using template variables:
- Labels — the value of a label on the timeseries under alert:
{{ $labels.<label_name> }}or{{ .Labels.<label_name> }} - Value — the worst value of the timeseries under alert:
{{ $value }}or{{ .Value }} - Timestamp and time offsets — the alert’s evaluation timestamp and common lookback windows, useful for building links to dashboards or logs:
{{ $timestamp }},{{ $timestampMilli }},{{ $offset5Min }},{{ $offset15Min }},{{ $offset30Min }},{{ $offset60Min }}(seconds), and{{ $offset5MinMilli }},{{ $offset15MinMilli }},{{ $offset30MinMilli }},{{ $offset60MinMilli }}(milliseconds).
Template variables can be combined with plain text (for example, Service name is {{ $labels.service }}), and multiple variables can be used in one field. Spaces in the template syntax are optional.
Considerations:
- Labels only include what survives the rule’s PromQL aggregation. If the rule’s expression aggregates with
by (...)(for example,avg by (host) (metric)), only the labels named inby (...)are available as$labels.<name>. The aggregation drops every other label from the underlying metric, so those aren’t referenceable. - Apart from the metric’s timeseries labels, the Alert Group labels can also be referenced. If labels match, the metric’s timeseries takes preference.
- If a label value is missing, the template variable is shown as-is.
- If the template syntax is incorrect, the UI displays an error.
- In grouped notifications, Labels are shown as a count of all label values and Values as a P99 of all the worst values.
$valueis only populated for Static Threshold rules. For anomaly-detection algorithms (Spike, Trend, Seasonality, and other non-static-threshold rule types),$valuecurrently renders as--.
Sample usage with Splunk
A custom annotation named splunk_debug_url with the value https://search.splunk.com/?service={{ urlquery $labels.service }}&stack={{ urlquery $labels.stack }} is interpolated per firing timeseries. For example, service=billing and stack=my-org produce https://search.splunk.com/?service=billing&stack=my-org.
Encoding template variables inside URLs
When a template variable is used inside a URL, wrap it with urlquery to percent-encode the substituted value:
https://app.last9.io/dashboards/my-dashboard?service={{ urlquery $labels.service }}Label values can contain spaces or special characters (for example, 4 service_names). Without urlquery, the value is inserted as-is, producing an invalid URL — and notification channels may then render the annotation as plain text instead of a clickable link. urlquery is not needed for plain-text annotations such as descriptions.
Preview and Save
The live preview at the top of the editor simulates the rule against recent data, marking each Trigger and Recover point and shading the breach windows, so you can tune the condition before saving. The preview covers only the preview window; actual alert firing may differ.
When you are done, click Create (or Update when editing). Closing the editor with unsaved changes prompts a discard-changes confirmation. To receive notifications, ensure the rule’s Alert Group has at least one Notification Channel configured.
Troubleshooting
Please get in touch with us on Discord or Email if you have any questions.