
Product
Alert Monitor
View a live, auto-updating stream of every firing alert across your metrics and log Alert Rules in the Last9 Alert Monitor.
The Alert Monitor is a live, auto-updating stream of every alert currently firing across all your Alert Rules — metrics and log rules alike. It is the default screen when you open Alerting.
Viewing Firing Alerts
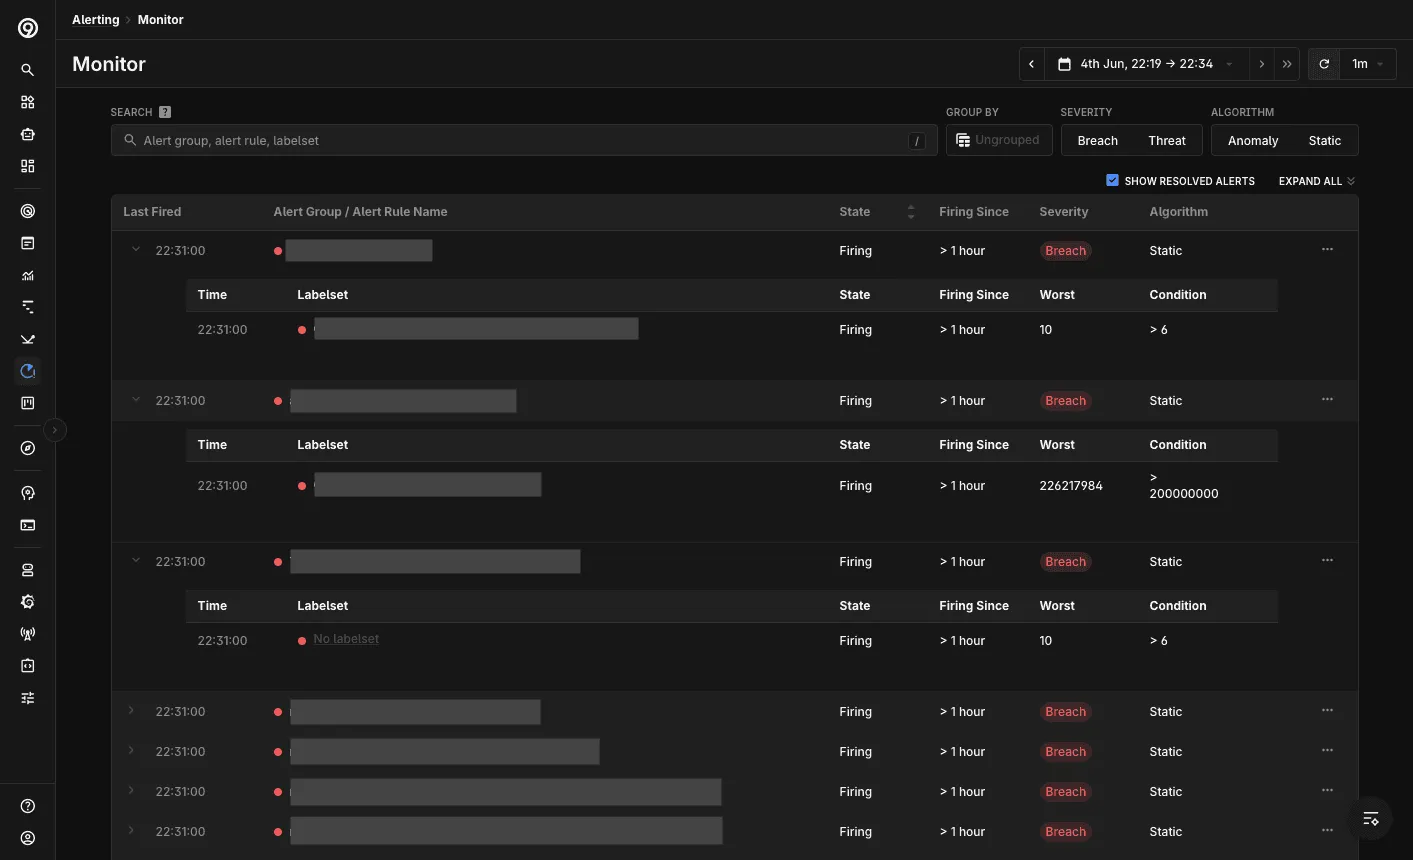
Each row shows the Alert Group / Alert Rule name, State, Firing Since, Severity, and Algorithm. Expand a row to see the firing labelsets. For Threshold rules, each labelset also shows its Worst value and the Condition that triggered it.
Use the controls along the top to focus the view:
- Search by alert group, alert rule, or labelset.
- Group By to switch between an ungrouped stream and a grouped view — for example, when one rule fires across dozens of labelsets, grouping collapses them under that rule so you see which rules are affected instead of scrolling every individual fire.
- Severity and Algorithm filters to narrow to Breach / Threat, or to an algorithm family — Threshold or Anomaly (which includes Adaptive).
- Show resolved alerts to include alerts that have recently recovered.
- The time range, refresh, and auto-refresh interval controls on the top right keep the stream current.
Alert Details
Click any alert to open its details in place. The panel always shows Last Triggered At, along with the parameters used to evaluate the rule, which vary by algorithm:
- Threshold — the Condition, the Worst Window value, and the Sensitivity (for example, 3 bad min out of 5).
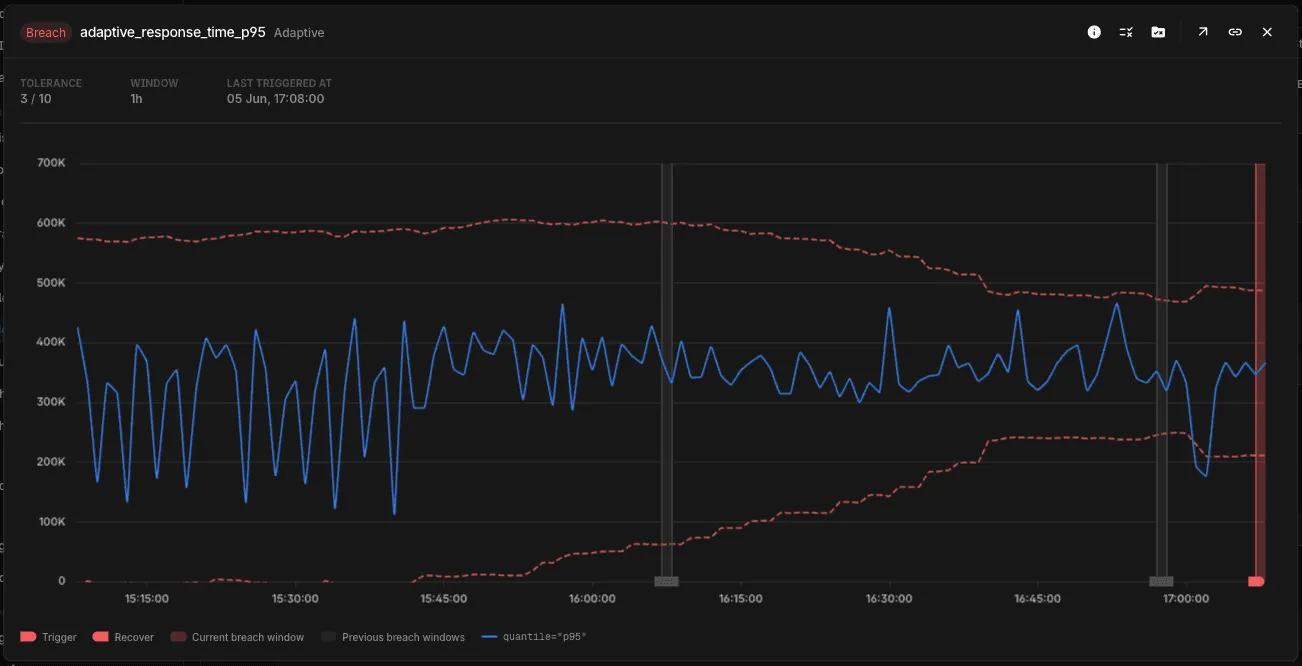
- Anomaly — for Adaptive rules, the tolerance and window; for legacy anomaly rules, the sensitivity.
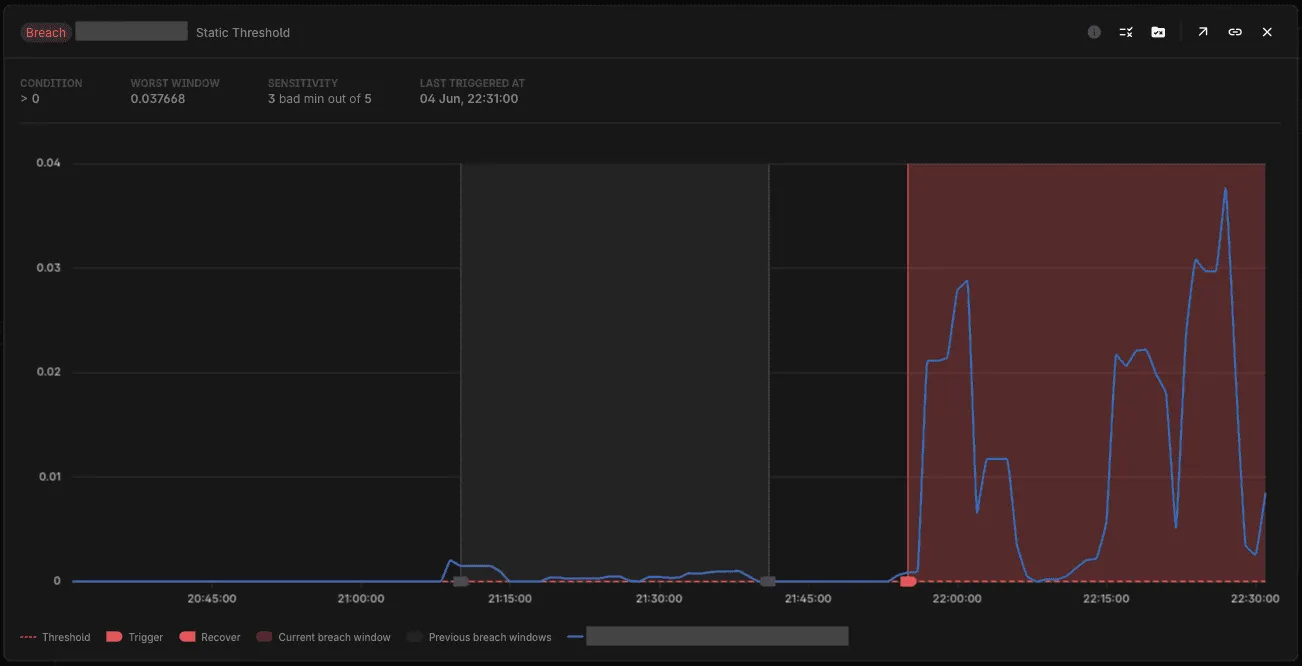
The chart plots the last 2 hours of the rule’s query. It marks each Trigger and Recover point and shades the breach windows (the current one plus any Previous breach windows), so you can tell whether this is a one-off or a recurring problem. Threshold rules plot the query against a flat threshold line.
Adaptive rules render the learned band instead, shading the region the rule treats as normal so you can see where the query broke out of it.
From the panel header you can copy a direct link to the alert, jump to the underlying Alert Rule and its Alert Group, or open the query in its explorer to investigate further — the Metrics Explorer for metrics rules, the Logs Explorer for log rules.
Troubleshooting
Please get in touch with us on Discord or Email if you have any questions.