

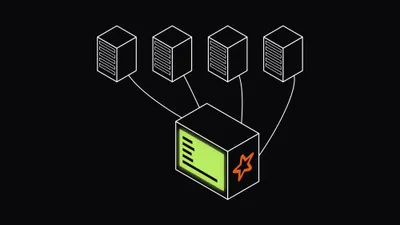
Apache Spark Monitoring: Spark UI, Metrics and Alerts
Apache Spark monitoring guide: what the Spark UI shows, how to keep it after a job ends, finding skew and spill, Prometheus metrics, and alerts.

Sejal Pandey
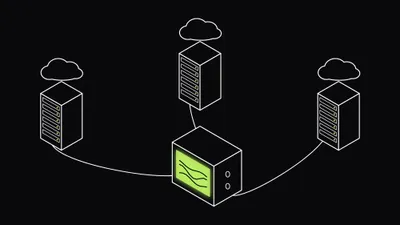
Multi-Cloud Monitoring: How to Watch AWS, Azure and GCP Together
Multi-cloud monitoring guide: why the same metric differs across AWS, Azure and GCP, and how to normalize it with OpenTelemetry into one view.
Sejal Pandey
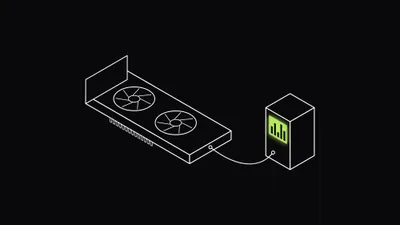
NVIDIA DCGM Exporter: Setup and GPU Metrics Guide
Set up the NVIDIA DCGM Exporter with Docker or Helm, pick the right DCGM metrics, enable profiling counters, map GPUs to Kubernetes pods, and add alerts.
Sejal Pandey
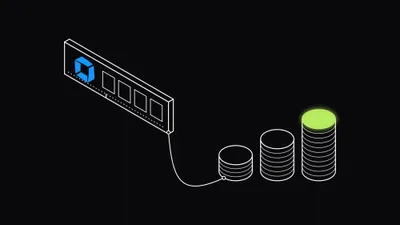
Dynatrace Pricing Explained (2026): Rates, DPS and Real Costs
Dynatrace pricing explained: DPS annual commits, the hourly rate card for hosts, pods, logs and RUM, why memory drives Full-Stack cost, and a worked bill.
Sejal Pandey
Error Budgets: How to Calculate and Alert on Burn Rate
An error budget is the unreliability an SLO allows. Learn to calculate it, track burn rate, set multiwindow alerts in PromQL and write an error budget policy.
Sejal Pandey
Best Observability Tools in 2026: 8 Platforms Compared
A practical comparison of the best observability tools in 2026: Last9, Datadog, Grafana Cloud, New Relic, Dynatrace, Honeycomb, Coralogix and SigNoz.
Sejal Pandey
Grafana Cloud Pricing Explained (2026): What Teams Pay
Grafana Cloud pricing broken down: free tier limits, Pro rates for metrics, logs and traces, how active series and DPM are billed, and worked cost examples.
Sejal Pandey
AI Agent Observability: What to Trace and What It Catches
AI agent observability means tracing tool calls, reasoning steps, and handoffs, not just tokens and latency. Here's what to instrument and why.
Sejal Pandey
Rails Performance Monitoring: What to Watch and Why It Slows Down
How to monitor a Rails application in production: reading Puma's stats endpoint, spotting GC pressure, and finding the query that's actually slow.
Sejal Pandey
SRE Automation Tools: What to Automate and Which Tools Help
SRE automation covers four different jobs: runbook automation, self-healing infrastructure, drift detection, and resilience testing.
Sejal Pandey
PHP Performance Monitoring: What to Watch and Why It Slows Down
How to monitor a PHP application in production: reading the PHP-FPM status page, checking OPcache health, and finding the request that is actually slow.
Sejal Pandey

What Is AIOps? Definition, How It Works, and Real Examples
AIOps explained in plain terms: what it means, how it differs from AI-SRE and MLOps, how it detects problems, and whether a small team needs it.
Sejal Pandey
Best AI Observability Tools in 2026: 8 Tools Compared
Eight LLM and AI agent observability platforms compared: what each tracks, pricing and free tiers, self-hosting options, and who each is built for.
Sejal Pandey

Cloud Cost Management for Observability: A Practical Guide
Observability spend is outgrowing infrastructure budgets. What drives the cost up, how pricing models work, and a practical framework to manage it.
Sejal Pandey
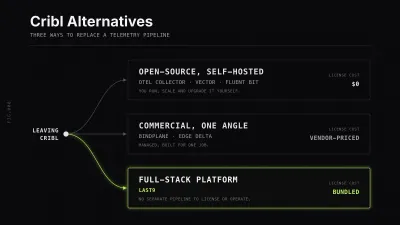
6 Cribl Alternatives Worth Evaluating in 2026
Cribl's credit pricing and setup complexity send teams looking elsewhere. Compare 6 real Cribl competitors and alternatives, for observability and SecOps.
Sejal Pandey
Incident Response Automation: A Practical Playbook
A stage-by-stage playbook for automating incident response: what to automate at detection, triage, and remediation, what to deliberately leave manual, and a checklist to run against your current setup.
Sejal Pandey
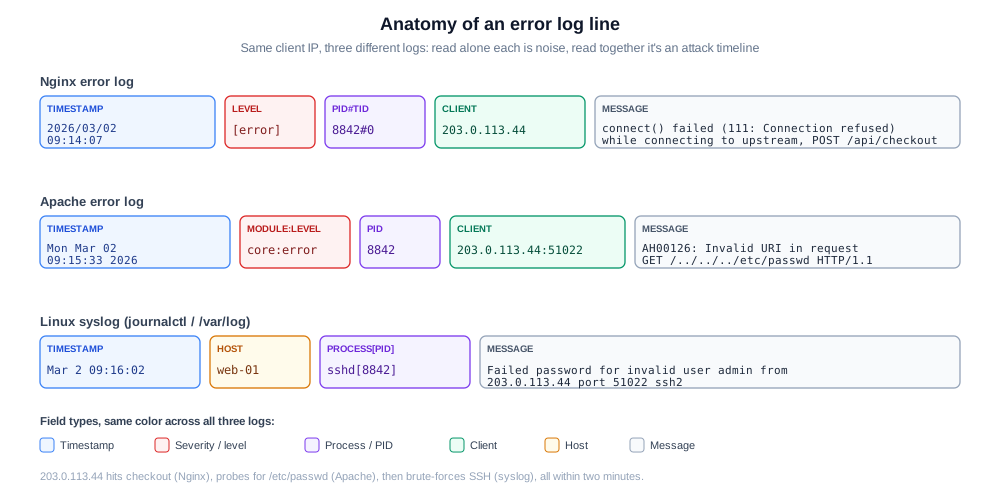
Reading Application Error Logs: Nginx, Apache & System Logs
A quick-reference guide to reading Nginx, Apache, and Linux syslog error lines: what each field means, with real annotated examples.
Sejal Pandey
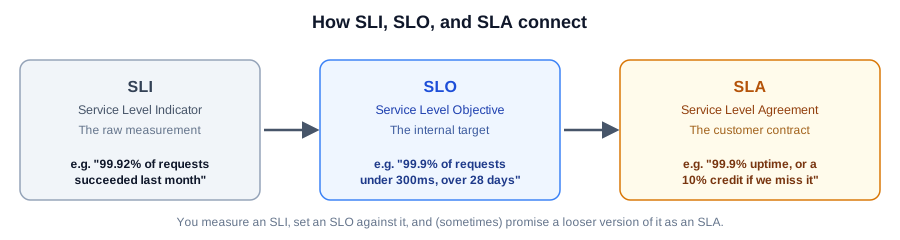
SLO vs SLA: What's the Difference?
An SLO is the internal reliability target your team sets. An SLA is the contractual promise you make to a customer. Here's how they differ, with real examples.
Sejal Pandey
Kubernetes Pods vs Nodes: What Sets Them Apart
A Kubernetes Node is the machine, a Pod is the smallest thing that runs on it. Here's exactly how they differ, how they relate to clusters, and how each one scales.
Sejal Pandey