

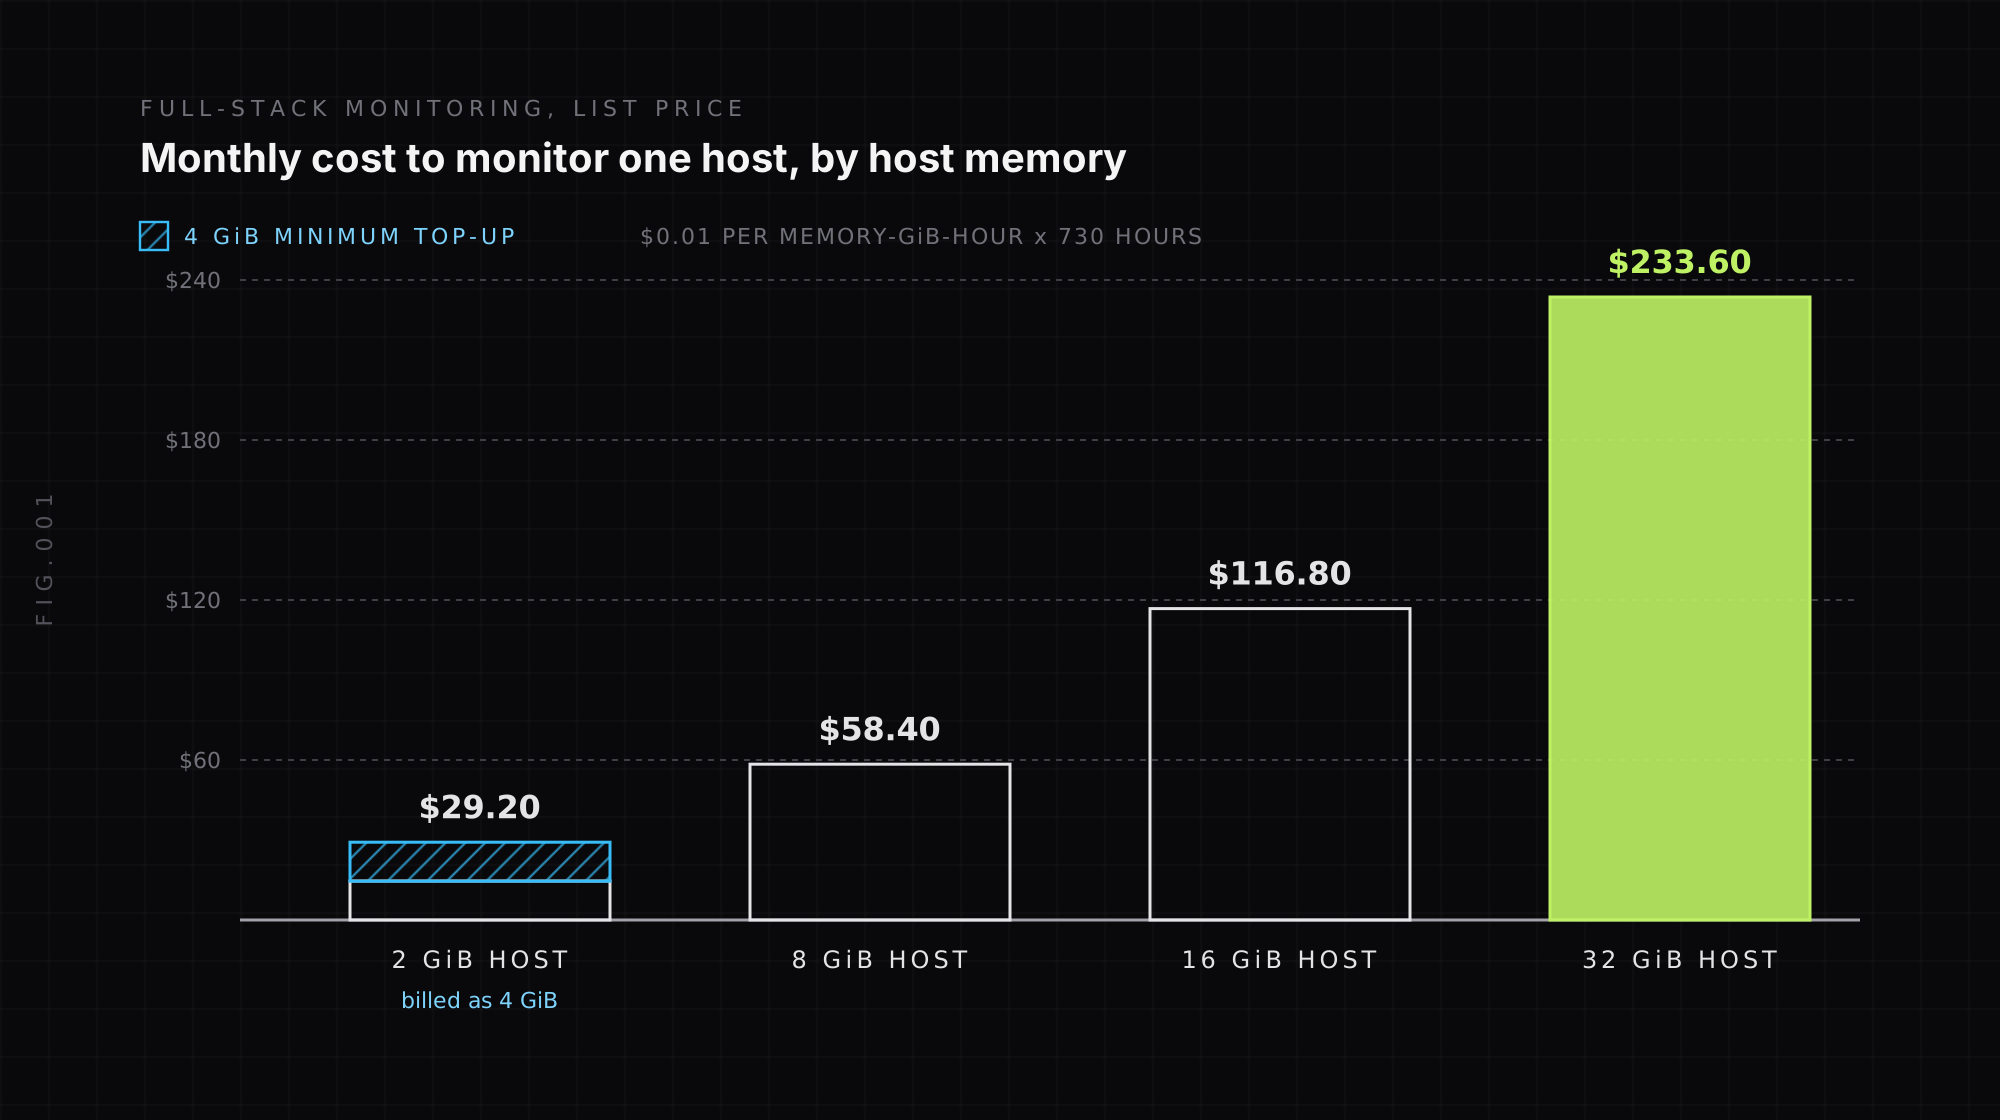
Dynatrace pricing works on an annual commitment called the Dynatrace Platform Subscription (DPS), drawn down against an hourly rate card. The main line is Full-Stack Monitoring at $0.01 per memory-GiB-hour, which is about $58 a month for an 8 GiB host.
On the Dynatrace rate card, Infrastructure Monitoring is about $29 per host per month, Kubernetes platform monitoring is $0.002 per pod-hour, and logs cost $0.20 per GiB to ingest plus retention. Because Full-Stack Monitoring is priced by memory, the size of your hosts decides most of the bill.
The rates below come from Dynatrace’s public pricing page and licensing documentation as of September 2026. They are list prices. Real DPS contracts are negotiated, so treat the numbers as a starting point for a budget, not a quote.
How does the Dynatrace Platform Subscription work?
The Dynatrace Platform Subscription is a consumption model with a floor. You sign a contract, typically for one to three years, with a minimum annual spend. Every capability you use (hosts, pods, logs, traces, sessions) is priced per unit on a rate card, and that usage draws down the commitment.
Three details matter for budgeting:
- There is no monthly plan. Dynatrace requires an annual commitment. The only way to try it without one is the 15-day free trial.
- Going over the commitment is not penalized. Dynatrace’s documentation says that once the annual commitment is reached, you keep using the platform at on-demand rates “with no overage premiums.”
- The commitment is the minimum, not the estimate. If you size the commit too high, unused spend is the risk. Dynatrace’s public docs do not say whether unused commitment rolls over, so confirm that in the contract.
DPS replaced Dynatrace’s older classic licensing, which used host units and Davis Data Units (DDUs). Most pricing questions you will see online that mention DDUs refer to the classic model. New contracts use DPS.
What does the Dynatrace rate card cost?
These are the published DPS list prices for the capabilities most teams use. Monthly figures assume about 730 hours in a month.
| Capability | Rate card price | Approx. monthly |
|---|---|---|
| Full-Stack Monitoring | $0.01 per memory-GiB-hour | $58 per 8 GiB host |
| Infrastructure Monitoring | $0.04 per host-hour | $29 per host |
| Foundation and Discovery | $0.01 per host-hour | $7 per host |
| Kubernetes Platform Monitoring | $0.002 per pod-hour | $1.46 per pod |
| Code Monitoring (containers) | $0.005 per container-hour | $3.65 per container |
| Logs: ingest and process | $0.20 per GiB | n/a |
| Logs: retain (pay-per-query) | $0.0007 per GiB-day | n/a |
| Logs: query (pay-per-query) | $0.0035 per GiB scanned | n/a |
| Logs: retain with included queries | $0.02 per GiB-day | n/a |
| Metrics: ingest | $0.15 per 100,000 data points | n/a |
| Traces: ingest and process | $0.20 per GiB | n/a |
| Real User Monitoring | $2.25 per 1,000 sessions | n/a |
| RUM with Session Replay | $4.50 per 1,000 sessions | n/a |
| Synthetic browser monitors | $4.50 per 1,000 actions | n/a |
| Synthetic HTTP monitors | $1.00 per 1,000 requests | n/a |
| Runtime Vulnerability Analytics | $0.00225 per memory-GiB-hour | $13 per 8 GiB host |
Metrics queries are free on the rate card. Traces and events use the same ingest, retain and query structure as logs.
How is Dynatrace Full-Stack Monitoring billed?
Full-Stack Monitoring is the capability that gives you APM, distributed tracing and code-level visibility on a host, and it is usually the largest line on a Dynatrace bill. It is billed by the memory of the monitored host, not by host count.
Dynatrace’s licensing docs define three rules for how memory is counted:
- Rounding: host memory is rounded up to the next multiple of 0.25 GiB. An 8.3 GiB host counts as 8.5 GiB.
- Minimum: physical and virtual hosts have a 4 GiB minimum. A 2 GiB host is billed as 4 GiB. Containers use a 256 MiB minimum instead.
- Granularity: consumption is measured in 15-minute intervals, so autoscaled hosts that run for part of an hour are billed for the intervals they ran.
The practical effect is that the same application costs more to monitor on a bigger instance. A service running on a 32 GiB host costs four times as much to monitor as the same service on an 8 GiB host, even if the request volume is identical.
What does Full-Stack Monitoring include?
Each GiB of monitored memory also comes with a telemetry allowance. Per Dynatrace’s docs, every contributing GiB adds 900 custom metric data points and 3,000 KiB of trace data in each 15-minute interval.
Over a month, that is roughly 2.6 million custom metric data points per GiB. A fleet of 20 hosts with 16 GiB each (320 GiB in total) includes about 840 million data points a month before metrics ingest charges start. Data points above the allowance are billed at $0.15 per 100,000, and trace data above the allowance is billed as trace ingest at $0.20 per GiB.
The allowance is pooled from memory, so high-cardinality metrics can exceed it quickly. Every new label value creates a new time series, and each series sends data points on every scrape. If you add a pod or customer_id label to a busy metric, the extra data points land on the metrics ingest line. Our guide on what high cardinality is explains how that growth happens.
How does Dynatrace charge for logs?
Dynatrace log pricing has three parts: ingest, retention and queries. Ingest is fixed at $0.20 per GiB. For retention, you choose between two models per log bucket:
- Pay-per-query: $0.0007 per GiB-day to retain, plus $0.0035 per GiB scanned by each query.
- Retain with Included Queries: $0.02 per GiB-day, with an included query allowance of 15 GiB per retained GiB each day. This model applies to the first 10 to 35 days of retention in a bucket.
Retention is billed on the uncompressed volume of stored logs, so estimate from raw log size.
For most teams, pay-per-query is the cheaper option. Take a team that ingests 500 GiB of logs a month and keeps 30 days. It holds about 15,000 GiB-days of logs each month. Pay-per-query retention costs $10.50 a month, and the bundled model costs $300 a month. The pay-per-query total only catches up when queries scan about 82,700 GiB a month, which is about 165 times the monthly ingest volume.
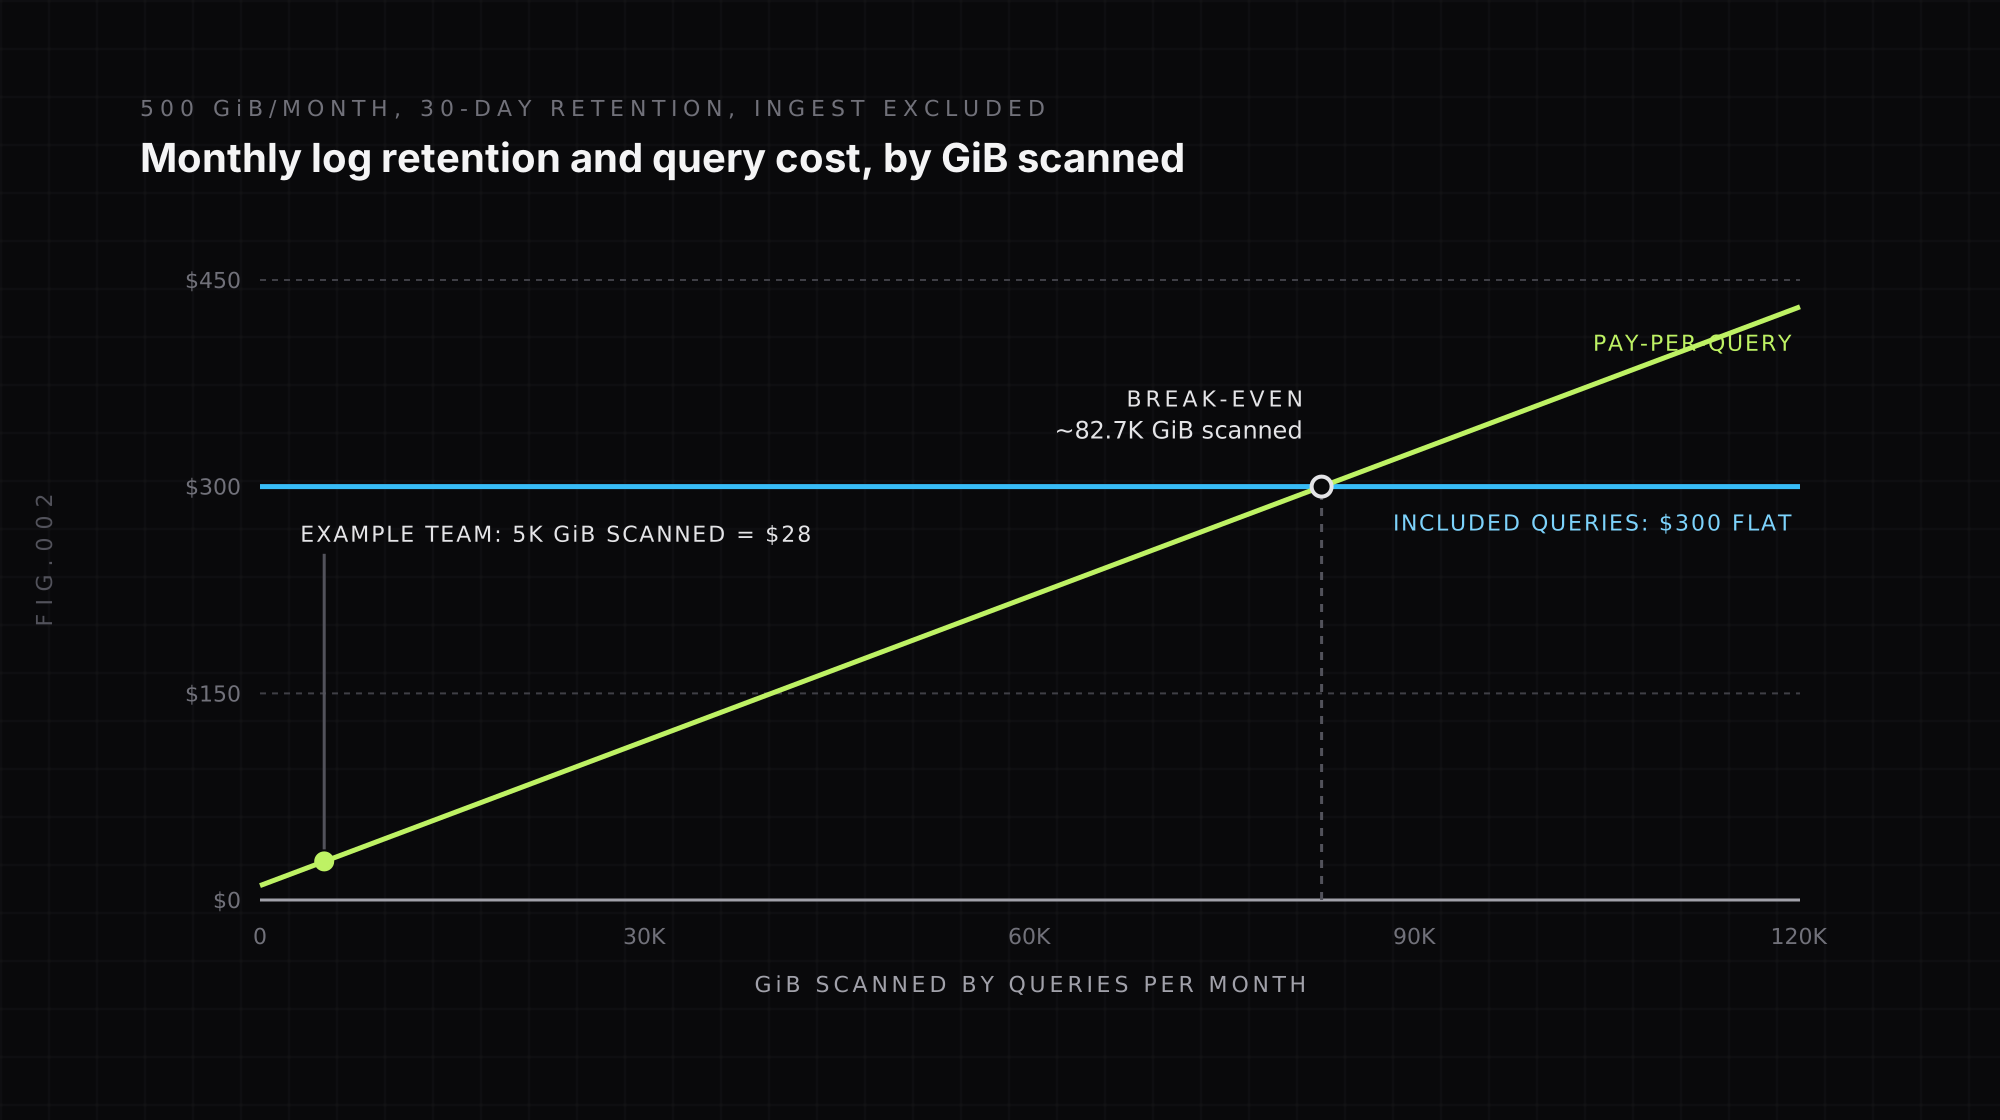
The bundled model makes sense when many dashboards and alerts run log queries around the clock, because the scan volume from automated queries adds up faster than people expect. If most log queries are ad hoc investigations, pay-per-query usually wins.
What does Dynatrace cost for a real team?
Here is a worked example at list prices for a mid-size team:
- 20 application hosts with 16 GiB of memory each on Full-Stack Monitoring
- 10 supporting hosts on Infrastructure Monitoring
- 200 Kubernetes pods on Kubernetes Platform Monitoring
- 500 GiB of logs a month, retained 30 days on pay-per-query, with 5,000 GiB scanned by queries
- 300,000 Real User Monitoring sessions a month
| Line item | Calculation | Monthly cost |
|---|---|---|
| Full-Stack Monitoring | 20 hosts x 16 GiB x 730 h x $0.01 | $2,336 |
| Infrastructure Monitoring | 10 hosts x 730 h x $0.04 | $292 |
| Kubernetes Platform Monitoring | 200 pods x 730 h x $0.002 | $292 |
| Logs: ingest | 500 GiB x $0.20 | $100 |
| Logs: retain | 15,000 GiB-days x $0.0007 | $10.50 |
| Logs: query | 5,000 GiB x $0.0035 | $17.50 |
| Real User Monitoring | 300 x $2.25 | $675 |
| Total | $3,723 per month |
That is about $44,700 a year, which becomes the sizing input for the annual commitment. Two assumptions keep this example low. The first is that custom metrics stay inside the Full-Stack allowance. The second is that no Application Security or Session Replay is added. Moving the 20 hosts from 16 GiB to 32 GiB instances would add another $2,336 a month without any change in traffic.
For how this compares with per-host pricing elsewhere, see our breakdown of Datadog pricing and New Relic pricing. Last9 is one licence, with no meter per active series or per GB, and the infrastructure runs on your own cloud bill at your negotiated rates.
How can you reduce your Dynatrace bill?
Most Dynatrace savings come from matching the capability tier to what each host needs.
Put only the hosts you debug on Full-Stack. Databases, queues and batch workers often need host and process health, not code-level traces. Moving them to Infrastructure Monitoring at $0.04 per host-hour costs less than Full-Stack on any host larger than 4 GiB.
Watch host memory, not host count. Right-sizing an overprovisioned instance lowers the Full-Stack bill directly. Consolidating many tiny hosts can help too, because each one is billed at the 4 GiB minimum.
Pick the log retention model per bucket. Put audit and compliance logs that are rarely queried on pay-per-query. Use the bundled model only for buckets that dashboards query constantly.
Control metric cardinality before ingest. Drop or aggregate high-cardinality labels you do not query, so custom metrics stay within the included allowance.
Keep instrumentation portable. Instrumenting with OpenTelemetry instead of a vendor agent alone keeps the option to move data to another backend at renewal. That gives you a real alternative when you negotiate the next commitment.
How does Last9 compare on pricing?
Last9 is one licence, and the infrastructure runs on your own cloud bill at your negotiated rates. There is no meter per active series or per GB.
Labels like customer_id or tenant stay on the metric, with no charge per label or metric name. Last9 keeps high-cardinality labels with no sampling, at 20M series per metric per day by default. Our Control Plane drops, remaps, redacts, forwards and aggregates telemetry at ingest, before storage. Last9 runs single-tenant in your own cloud account, in any region, and manages it for you.
Dynatrace remains strong at automatic discovery and causal root-cause analysis across large enterprise estates, and it traces down to the mainframe, which Last9 does not. For a wider look at other options, see Dynatrace alternatives and Datadog vs Dynatrace.
Budget for memory and commitments, not hosts
Dynatrace publishes its rate card, which makes it easier to budget than many enterprise vendors. The part that surprises teams is the unit. Full-Stack Monitoring follows host memory, so instance sizing decisions made for performance also change the observability bill. The annual commitment means the estimate you make up front is the minimum you pay.
Before signing, list every host with its memory size, decide which ones need Full-Stack and which need only Infrastructure Monitoring, and estimate log scan volume to pick a retention model. If high-cardinality telemetry is what keeps pushing your costs up, Last9 keeps those labels with no charge per label or metric name, and lets you shape data at ingest before it is stored.
FAQ
How much does Dynatrace cost per host?
Dynatrace list prices in September 2026 are about $58 per month for Full-Stack Monitoring on an 8 GiB host, $29 per month per host for Infrastructure Monitoring, and $7 per month per host for Foundation and Discovery. Full-Stack is billed at $0.01 per memory-GiB-hour, so the per-host price scales with host memory: a 16 GiB host costs about $117 per month and a 32 GiB host about $234 per month.
What is the Dynatrace Platform Subscription (DPS)?
The Dynatrace Platform Subscription (DPS) is Dynatrace’s current licensing model. A customer signs a contract, typically for one to three years, with a minimum annual spend commitment. Usage of every capability, such as hosts, logs, traces and real user monitoring, is priced on an hourly or per-unit rate card and drawn down against that commitment. Usage beyond the commitment continues at on-demand rates, and Dynatrace states there are no overage premiums.
Does Dynatrace have a free plan?
Dynatrace does not have a permanent free plan. It offers a 15-day free trial, and paid use requires an annual commitment under the Dynatrace Platform Subscription. Teams that need a permanent free tier usually look at open-source stacks or vendors with ongoing free usage allowances.
Why is Dynatrace Full-Stack Monitoring priced by memory?
Dynatrace prices Full-Stack Monitoring per memory-GiB-hour, at $0.01 on the public rate card, because host memory is its proxy for the size of the workload being monitored. Host memory is rounded up to the next 0.25 GiB with a 4 GiB minimum for hosts, and billing is measured in 15-minute intervals. The effect is that larger instances cost proportionally more to monitor, and very small hosts are billed as if they had 4 GiB.
How does Dynatrace charge for logs?
Dynatrace charges $0.20 per GiB to ingest and process logs. Retention then has two options: pay-per-query, at $0.0007 per GiB-day retained plus $0.0035 per GiB scanned by queries, or Retain with Included Queries, at $0.02 per GiB-day with a query allowance of 15 GiB per retained GiB each day. Pay-per-query is cheaper unless a team scans its logs very heavily.
Is Dynatrace more expensive than Datadog?
The two use different pricing units, so the answer depends on the workload. Dynatrace bills Full-Stack Monitoring by host memory under an annual commitment, while Datadog bills APM and infrastructure per host with separate charges for custom metrics and log indexing. Large-memory fleets tend to cost more on Dynatrace, and many custom metrics or heavy log indexing tend to cost more on Datadog. Last9 is one licence, and the infrastructure runs on your own cloud bill at your negotiated rates.


