


HAProxy monitoring starts with counters HAProxy already keeps for every frontend, backend and server: sessions, queues, errors, response codes, health checks and timings. You can read them on the built-in stats page, through the stats socket as CSV, or from HAProxy’s built-in Prometheus exporter. The numbers that matter most are the backend queue, server status and backend 5xx rate.
One trap is that HAProxy’s response time fields are averages over the last 1,024 requests, not percentiles, so slow tails need logs.
This guide covers how to expose HAProxy stats, which fields and Prometheus metrics to watch, what a queue tells you, why the timing averages mislead, and which alerts to set first. Field names and definitions come from HAProxy’s own management guide and configuration manual, and from the README of its Prometheus exporter.
What should you monitor in HAProxy?
HAProxy sits in front of your services, so its counters describe both its own health and the health of every backend behind it. Watch four layers:
- Frontends: current sessions against the session limit, request rate, request errors and denied requests.
- Backends: queued requests, active servers, connection errors, retries and response codes.
- Servers: status (UP, DOWN, MAINT), health check results, sessions against
maxconn, and timings. - The process: current connections against the global
maxconn.
HAProxy logs give the per-request view, including timers for each phase of a request. Our guide to the HAProxy log format covers how to read and customize them. This guide focuses on the counters.
How do you expose HAProxy stats?
HAProxy offers three ways to read the same counters.
The stats page. Add a frontend with stats enable and stats uri, and HAProxy serves an HTML dashboard of every proxy and server. Bind it to an internal address:
frontend stats mode http bind 10.0.0.5:8404 stats enable stats uri /stats stats refresh 10sThe stats socket. The runtime API returns the counters as CSV with show stat, and lets you change server state without a reload:
global stats socket /var/run/haproxy.sock mode 660 level adminecho "show stat" | socat stdio /var/run/haproxy.sock | cut -d, -f1,2,3,5,18,44That prints proxy name, server name, queued requests, current sessions, status and 5xx responses for every line.
The Prometheus exporter. HAProxy ships a Prometheus exporter, called PROMEX, as a service inside HAProxy itself. It must be compiled in with USE_PROMEX=1; if haproxy -vv reports “Built with the Prometheus exporter as a service”, you can enable it with an http-request rule:
frontend prometheus mode http bind 10.0.0.5:8405 http-request use-service prometheus-exporter if { path /metrics } no logThen add 10.0.0.5:8405 as a scrape target in Prometheus.
The exporter README warns that a Prometheus dump costs more than the CSV export: in its quick benchmarks, a PROMEX dump was “5x slower and 20x more verbose than a CSV export.” On large configurations, use its query string filters, such as /metrics?scope=backend&scope=server, or no-maint to skip servers in maintenance, to keep scrapes small.
Which HAProxy stats fields matter most?
The stats CSV has more than 100 fields in current releases. These are the ones behind most incidents, with definitions from HAProxy’s management guide and the matching Prometheus metric:
| CSV field | Definition | Prometheus metric |
|---|---|---|
qcur | Current queued requests | haproxy_backend_current_queue, haproxy_server_current_queue |
scur / slim | Current sessions / configured session limit | haproxy_frontend_current_sessions, haproxy_frontend_limit_sessions |
status | UP, DOWN, NOLB, MAINT and related states | haproxy_server_status{state="..."} |
act | Number of active servers (backend) | haproxy_backend_active_servers |
econ | Requests that hit an error connecting to a backend server | haproxy_backend_connection_errors_total |
eresp | Response errors | haproxy_backend_response_errors_total |
wretr / wredis | Connection retries / redispatches to another server | haproxy_backend_retry_warnings_total, haproxy_backend_redispatch_warnings_total |
hrsp_5xx | HTTP responses with a 5xx code | haproxy_backend_http_responses_total{code="5xx"} |
chkfail | Failed health checks while the server was up | haproxy_server_check_failures_total |
qtime / rtime | Average queue / response time over the last 1,024 requests, in ms | haproxy_backend_queue_time_average_seconds, haproxy_backend_response_time_average_seconds |
Server status works differently in the exporter: it is reported as a set of series with a state label, so haproxy_server_status{state="DOWN"} == 1 finds servers that are down.
What does the HAProxy queue tell you?
When every server in a backend has reached its maxconn, new requests wait in a queue instead of being sent. qcur counts them. A queue is HAProxy protecting your servers from overload, and it is the clearest sign that a backend is at capacity.
The queue also has a time limit. From HAProxy’s configuration manual: when timeout queue is reached, “it is considered that the request will almost never be served, so it is dropped and a 503 error is returned to the client.” If timeout queue is not set, HAProxy uses the backend’s timeout connect, which is often only a few seconds. A backend can go from a short queue to a stream of 503s quickly.
Watch three numbers together:
qcurabove zero for several minutes means demand is above whatmaxconnallows. Either the servers are slow, there are too few of them, ormaxconnis set too low for what they can handle.qtimerising shows how long requests wait before a server takes them.rtimerising at the same time usually means slow servers are holding connections longer, which fillsmaxconnand starts the queue.
Why can HAProxy response times look fine during an incident?
Each request through HAProxy passes through several phases, and the stats page has a timer for some of them:
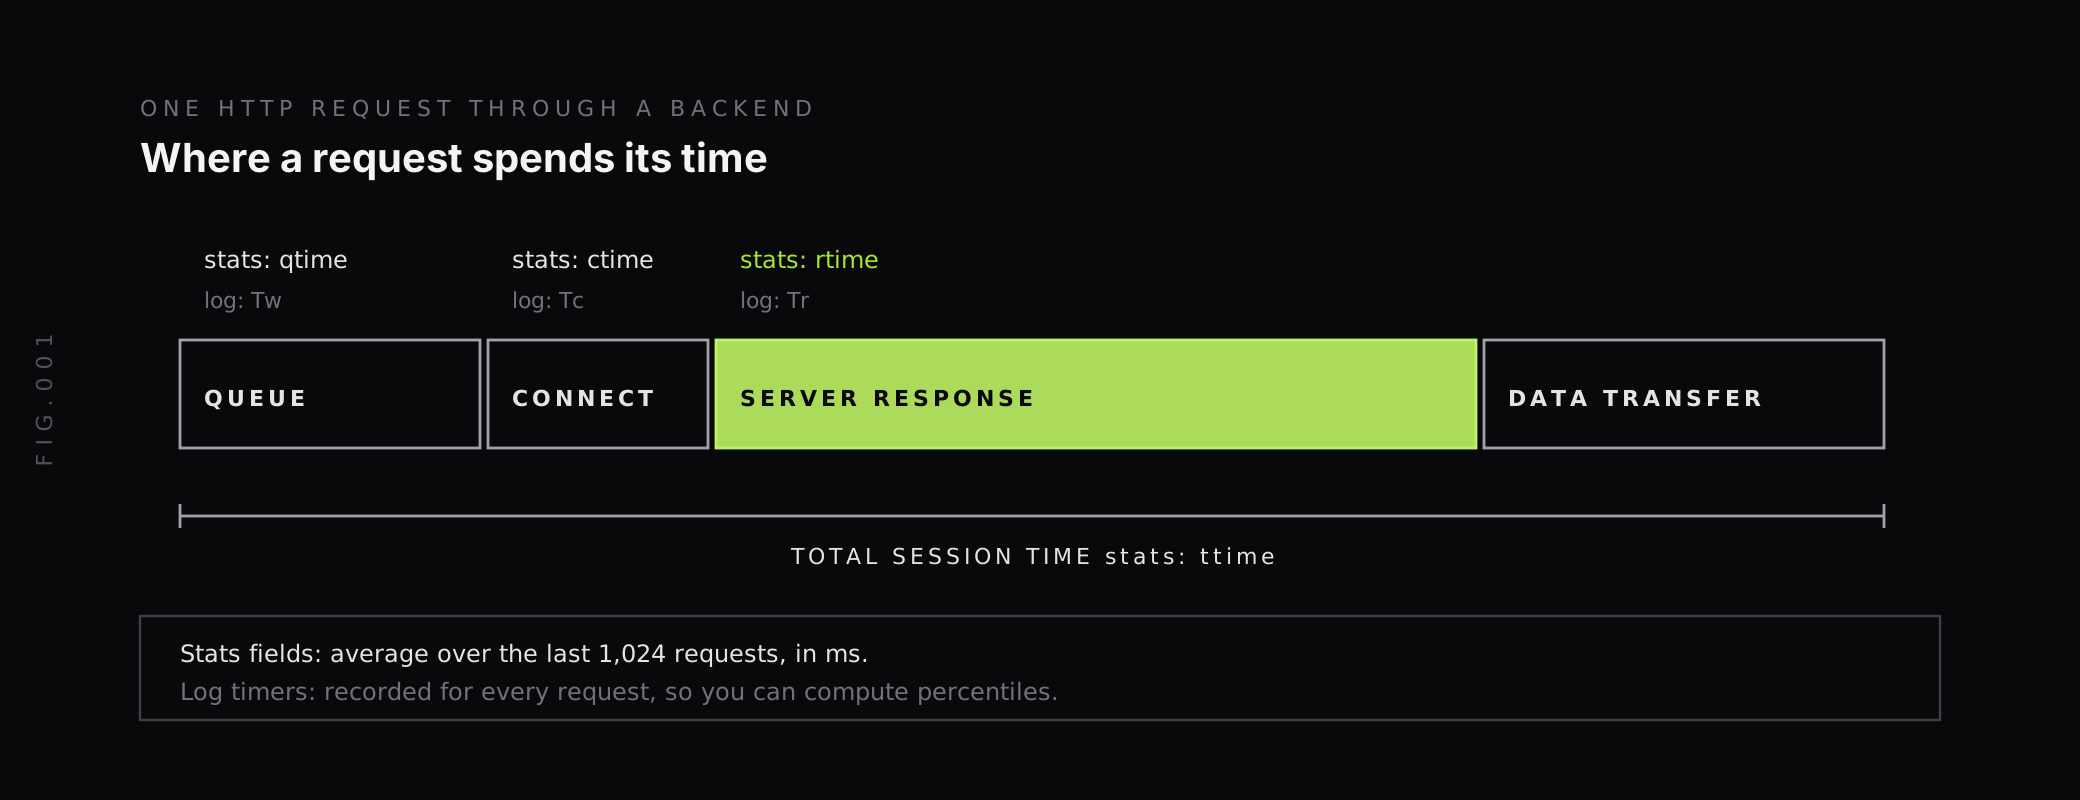
The catch is in the definition. HAProxy’s management guide describes qtime, ctime, rtime and ttime as “the average … time in ms over the 1024 last requests.” They are averages, not percentiles, and a small share of very slow requests barely moves an average. The stats also keep qtime_max and rtime_max, the maximum observed times, which show that a slow request happened but not how often.
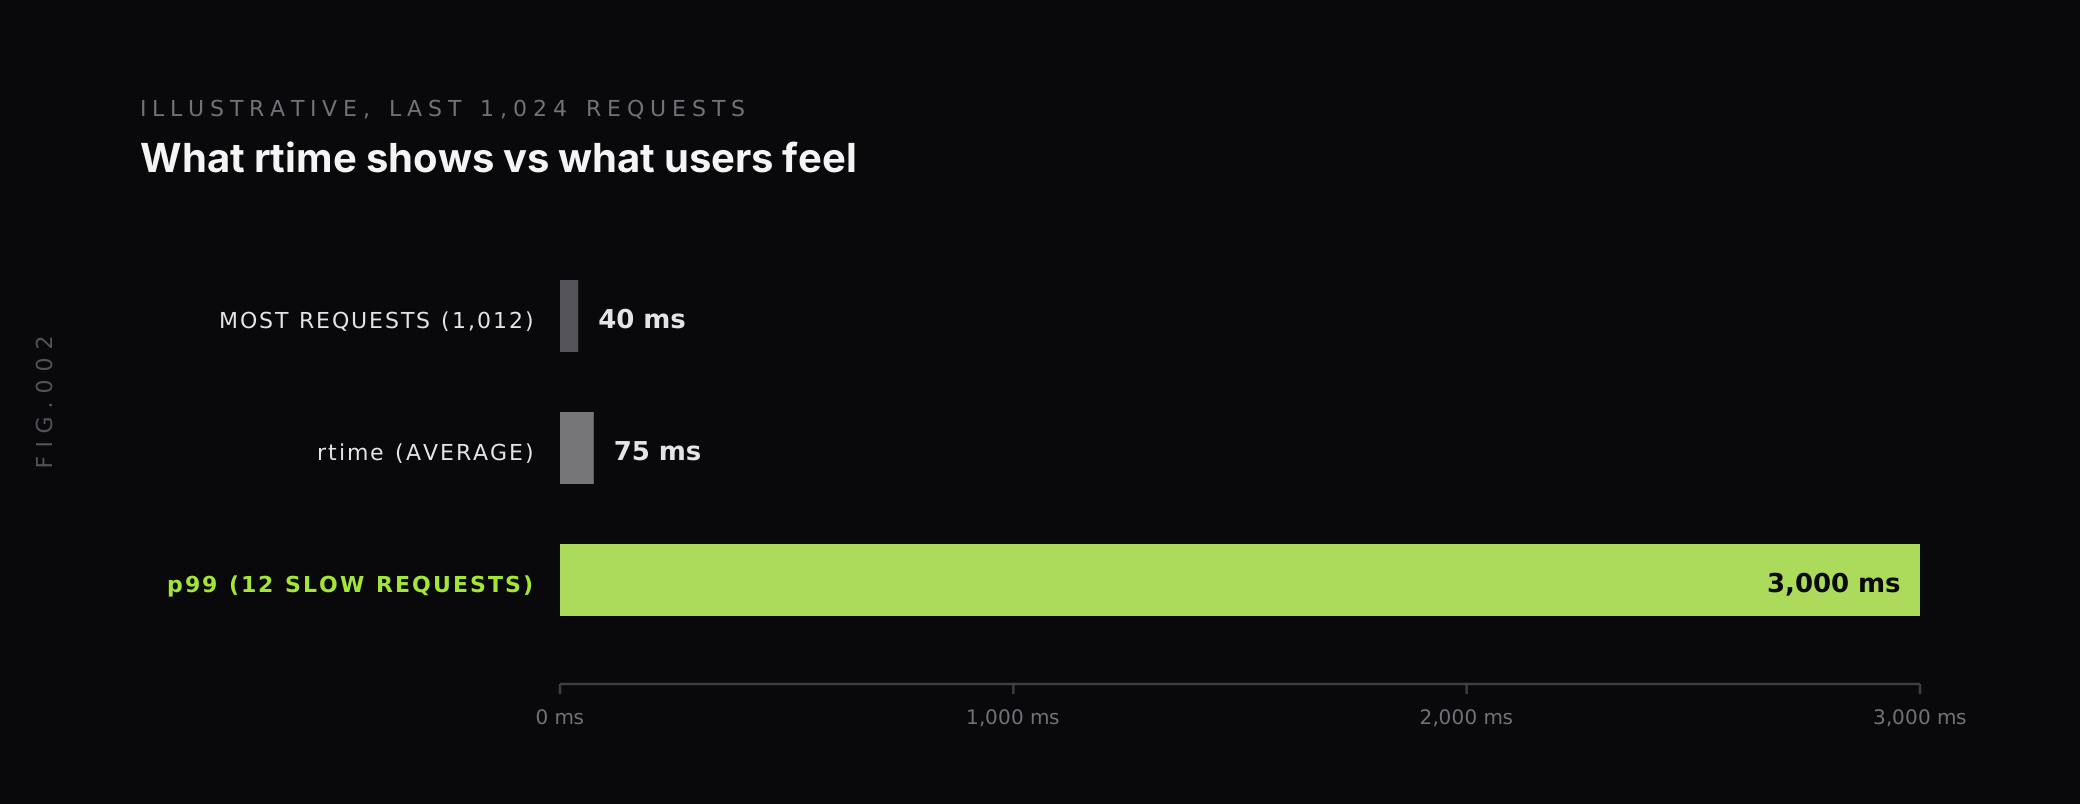
In the example, 12 of 1,024 requests take three seconds. rtime reports about 75 ms, which looks healthy, while the 99th percentile is 3,000 ms. Use the averages for trends and alerts on sudden shifts, and use the logs for tail latency. HAProxy’s HTTP log format records Tw, Tc, Tr and Ta for every request, and percentiles over those timers show what your slowest users experience.
Which alerts should you set for HAProxy?
Start with alerts that catch failing servers and rejected requests, then add capacity alerts. These use the Prometheus exporter’s metric names; thresholds are starting points to tune for your traffic:
| Alert | Expression (PromQL) | Why |
|---|---|---|
| Server down | haproxy_server_status{state="DOWN"} == 1 for 2 minutes | A server failed health checks |
| No active servers | haproxy_backend_active_servers == 0 for 1 minute | Every request to that backend fails |
| Requests queuing | haproxy_backend_current_queue > 0 for 5 minutes | Backend at maxconn capacity |
| Backend 5xx rate | rate(haproxy_backend_http_responses_total{code="5xx"}[5m]) / rate(haproxy_backend_http_requests_total[5m]) > 0.01 for 10 minutes | Application errors |
| Connection errors | rate(haproxy_backend_connection_errors_total[5m]) > 0 for 5 minutes | Servers refusing or timing out connections |
| Frontend near limit | haproxy_frontend_current_sessions / haproxy_frontend_limit_sessions > 0.8 for 10 minutes | New connections wait in the listen queue |
| Flapping server | increase(haproxy_server_check_failures_total[15m]) > 3 | A server moving in and out of rotation |
Run every HAProxy instance through the same alerts. In an active-active pair, one instance can see a problem the other doesn’t, especially when servers are reachable from only one zone.
Our guide to Prometheus Alertmanager covers routing and grouping, so a backend going down produces one page rather than one per server.
How does Last9 fit with HAProxy monitoring?
There are two common paths to get HAProxy metrics into Last9, depending on what your HAProxy build includes:
- Prometheus exporter: scrape the PROMEX endpoint with Prometheus and send it to Last9 with Prometheus remote write. Our Prometheus integration needs only a
remote_writeblock with your Last9 endpoint and credentials. - OpenTelemetry Collector: the HAProxy receiver in the Collector’s contrib distribution polls HAProxy through the stats socket or the stats HTTP URL, so it works even on builds without PROMEX. Export to Last9 over OTLP.
HAProxy logs carry the per-request timers the averages hide, and you can send them to Last9 alongside the metrics. The PromQL above works unchanged on Last9 for metrics from the Prometheus exporter; the OpenTelemetry receiver uses its own haproxy.* metric names. Per-server metrics multiply with every server and backend, and Last9 handles 20M series per metric per day by default, with no sampling. Our Control Plane lets you drop, remap, redact, forward and aggregate metrics, logs and traces at ingest.
For a comparison of HAProxy with other proxies, see our posts on HAProxy vs NGINX performance and Envoy vs HAProxy.
Watch the queue and the slow tail
HAProxy tells you a lot about your services for free. The backend queue shows when servers are at capacity before requests fail, server status shows what is in rotation, and the backend 5xx rate shows errors before users report them. The one number to treat with care is response time, because the stats fields are averages over the last 1,024 requests.
Enable the stats socket or the Prometheus exporter on an internal address, alert on servers going down and queues above zero, and compute latency percentiles from HAProxy’s log timers. When you want HAProxy metrics and logs next to the services behind it, Last9 takes Prometheus remote write and OpenTelemetry and queries them together.
FAQ
How do you monitor HAProxy?
HAProxy exposes its own statistics in three ways: an HTML stats page enabled with stats uri, the runtime API on a stats socket that returns the same counters as CSV with show stat, and an optional built-in Prometheus exporter that serves metrics such as haproxy_backend_current_queue and haproxy_server_status. Most teams scrape the Prometheus exporter or the stats socket, alert on queues, errors and server status, and use HAProxy logs for per-request detail.
How do you enable the HAProxy Prometheus exporter?
HAProxy’s built-in Prometheus exporter, called PROMEX, is a service you enable with an http-request rule in an HTTP frontend, for example http-request use-service prometheus-exporter if { path /metrics }. It must be compiled in with USE_PROMEX=1. Running haproxy -vv shows ‘Built with the Prometheus exporter as a service’ when it is available.
What does qcur mean in HAProxy stats?
qcur is the number of requests currently waiting in a queue. Requests queue when every server in a backend has reached its maxconn limit. For a backend, qcur counts requests queued without a server assigned. A queue that stays above zero means the backend is at capacity, and requests that wait longer than timeout queue are dropped with a 503.
Are HAProxy response times averages or percentiles?
The stats fields qtime, ctime, rtime and ttime are averages over the last 1,024 requests, in milliseconds. They are not percentiles, so a small share of very slow requests barely moves them. For tail latency, use the timers in HAProxy’s HTTP logs, such as TR, Tw, Tc, Tr and Ta, and compute percentiles from those.
What port does the HAProxy stats page use?
HAProxy has no fixed stats port. The stats page is served on whatever bind line you put in the frontend or listen section that contains stats enable and stats uri, and the Prometheus exporter is served on whatever frontend contains the use-service rule. Teams often use a dedicated frontend on a port such as 8404 or 8405, bound to an internal address.
Which HAProxy metrics should you alert on?
Alert on servers changing to DOWN (haproxy_server_status or the status field), backend queues above zero for several minutes, backend 5xx response rate, connection errors (econ), and frontend sessions approaching their configured limit. These catch capacity problems and failing servers before most users notice.


