

Incident response automation means using tooling to handle the repeatable parts of an incident: detection, alert routing, context-gathering, and low-risk remediation. That frees the on-call engineer’s time for the part that actually needs a human, which is deciding what to do about a problem that’s already been diagnosed. Done well, it doesn’t replace the responder. It removes the fifteen minutes of tab-switching and manual correlation that used to happen before the responder could start thinking.
What is incident response automation, and what does it replace?
A typical unautomated incident looks like this: an alert fires, someone gets paged, they open three or four dashboards to figure out what’s actually broken, they check a deploy log to see if anything shipped recently, they pull up logs in a separate tool and grep for the right time window, they post an update in Slack manually, and only then do they start forming a hypothesis about the fix. Most of that sequence is mechanical. None of it requires judgment. It’s exactly the kind of work that automation is good at, and exactly the kind of work that eats the first ten to twenty minutes of every incident before any real diagnosis starts.
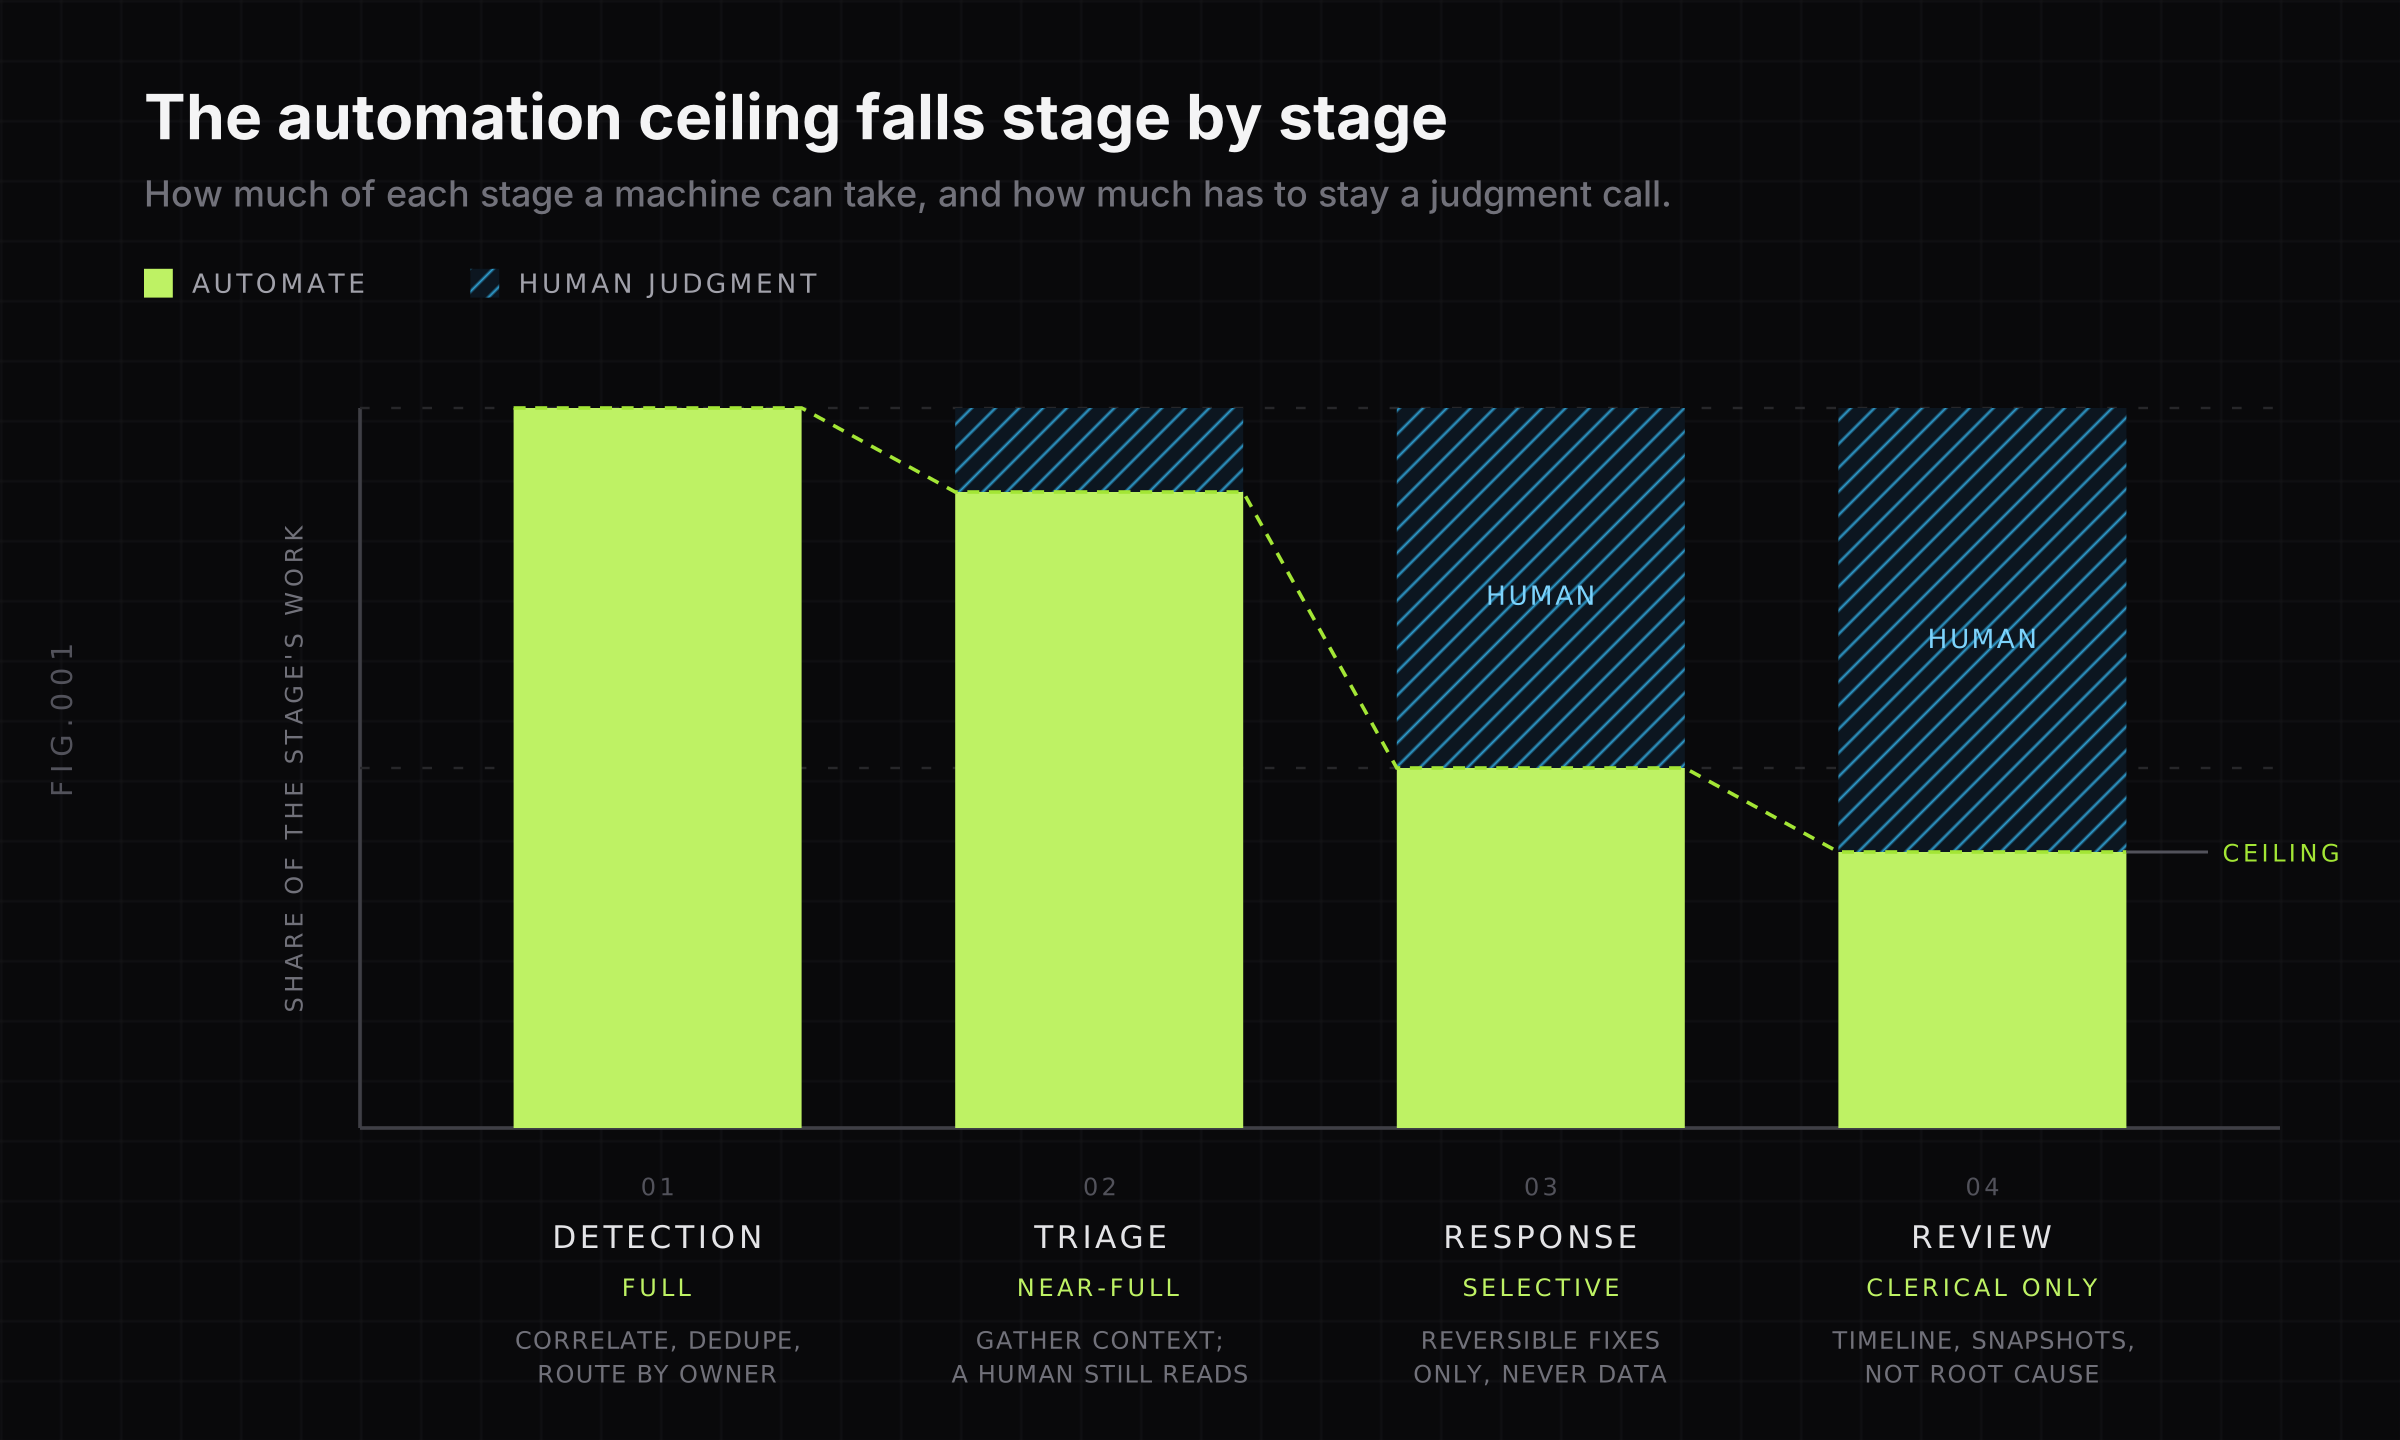
Incident response automation replaces that mechanical sequence, not the judgment call at the end of it. In practice it spans four stages, each with a different automation ceiling:
- Detection and alerting, where automation is mature and should be aggressive: signal collection, alert correlation, deduplication, and routing to the right person or team.
- Triage and enrichment, where automation gathers context (recent deploys, related alerts, relevant logs and traces, ownership) and attaches it to the alert before a human ever opens it.
- Response and remediation, where automation should be selective. It’s safe to auto-execute for well-understood, reversible failure modes such as restarting a crashed pod, rolling back a bad deploy, or failing over a database replica, but not for anything ambiguous or destructive.
- Post-incident review, where automation handles the clerical parts: timeline assembly, metric snapshots, and participant lists. The retro then starts with the facts already gathered instead of someone reconstructing them from memory and Slack scrollback.
Why does manual incident response break down as systems scale?
Manual incident response works fine at small scale because a handful of engineers can hold the whole system’s mental model in their heads. It breaks down for a specific reason: the number of places a failure can originate grows faster than the number of engineers who can reason about all of them. A monolith with one database has a handful of plausible failure points. A system built from thirty microservices, a mesh of async queues, and a few third-party dependencies has combinatorially more, and no single responder has full context on all thirty services at 3 a.m.
That gap shows up as three concrete symptoms:
- Alert fatigue. As instrumentation grows, so does alert volume. A team that pages on every anomaly trains its own on-call rotation to start ignoring pages, which is how a real incident gets missed inside a flood of noise it resembles.
- Slow diagnosis. Without automated correlation, a responder has to manually hold the state of “what changed” (deploys, config, traffic) against “what broke” (which service, which metric). That manual correlation is the single biggest driver of a long mean time to diagnose, independent of how good the eventual fix is.
- Inconsistent response. Without a documented, partially automated playbook, two different responders handle the same failure mode two different ways. The org never gets better at that specific failure; it just gets lucky or unlucky depending on who was paged.
Automation doesn’t fix any of these by adding more tooling on top. It fixes them by handling the parts of the response that don’t need a human, so the human’s attention goes to the one part of the incident that’s actually different this time.
Stage 1: What should you automate at detection?
Detection automation should be aggressive because the cost of a false positive here is low (someone glances at a dashboard and dismisses it) while the cost of a missed detection is high (an incident runs longer than it needed to). Three specific things are worth automating at this stage:
- Alert correlation, so that twelve alerts firing off the same root cause (a database going down, for instance) collapse into one page instead of paging the on-call engineer twelve separate times in ninety seconds. Correlation needs to happen across signal types, not just within one: a spike in error rate, a corresponding spike in database connection-pool exhaustion, and a burst of
connection refusedlog lines are three views of the same event and should be treated as one. - Deduplication and grouping, so a flapping alert (one that fires, resolves, and fires again every few minutes) doesn’t generate a new page each cycle. Most modern alerting systems support this natively. Prometheus Alertmanager, for one, bundles related alerts into a single notification and filters repeats by label out of the box. If yours doesn’t, that’s usually the first fix worth making before adding anything more sophisticated.
- Smart routing, so the alert reaches the team or individual who actually owns the failing component, based on service ownership metadata rather than a single shared on-call queue that pages everyone for everything. A checkout-service alert should page checkout-service’s owners, not the entire engineering org.
What not to automate at this stage: don’t auto-suppress an alert type just because it’s noisy. A noisy alert is a signal that the alert itself is miscalibrated (wrong threshold, wrong signal, or a real intermittent problem), and suppressing it hides that signal instead of fixing it. Fix the alert; don’t silence the symptom.
Stage 2: What should you automate at triage?
Triage is where the biggest time savings usually live, because it’s almost entirely context-gathering, and context-gathering is mechanical. The goal is that by the time a human opens the alert, the answer to “what should I look at first” is already attached to it.
Automated enrichment should pull together, at minimum:
- What changed recently (deploys, config changes, feature flag flips) in the affected service and its immediate dependencies.
- Related alerts firing in the same time window across other services, so a responder sees the blast radius immediately instead of discovering it service by service.
- The specific logs and traces from the affected time window, pre-filtered to the relevant service rather than a raw firehose.
- Who owns the service, and any relevant runbook, linked directly rather than requiring a search.
A well-built enrichment step turns “an alert fired, go find out why” into “an alert fired, here’s what changed in the last hour, here’s the error pattern, here’s the trace showing where time is going, and here’s the runbook.” That’s the difference between a ten-minute diagnosis and a forty-minute one, and none of the ten-minute version required a human decision. It required assembling information a machine already had.
One thing to leave alone at this stage: don’t let enrichment substitute for the responder actually reading it. Auto-generated summaries are a starting hypothesis, not a verdict, especially for anything novel. Treat them the way you’d treat a colleague’s first guess: useful, worth checking, not worth committing to blindly.
Stage 3: What should (and shouldn’t) trigger automated response?
This is the stage where teams most often either under-automate (every incident still needs a human to type the same three commands) or over-automate (a script takes an action nobody would have approved if they’d been asked first). The dividing line is whether the failure mode is well-understood and the remediation is reversible.
Good candidates for automated remediation:
- Restarting a crashed or unresponsive process, since restart-and-reassess is a well-understood, low-risk first move for a specific class of failures.
- Scaling out a service that’s hit a resource ceiling under load, since adding capacity is reversible and rarely makes things worse.
- Rolling back a deploy when an alert correlates tightly with a deploy that happened minutes earlier, since a rollback undoes a specific, recent, identified change.
- Failing over to a healthy replica when a primary database or cache node stops responding, since failover is a designed, tested path rather than an improvised one.
Bad candidates, or at minimum ones that need a human in the loop before execution:
- Anything involving data (deleting, migrating, or bulk-modifying records), since an automated action here can turn a service outage into a data-integrity incident, which is strictly worse.
- Anything without a clear, tested rollback path of its own, since an automated action that can’t itself be undone shouldn’t be triggered by another piece of automation without review.
- Any failure mode the team hasn’t seen enough times to have real confidence in the fix, since automating a guess just means the guess executes faster and more consistently, not that it’s correct.
The same two questions decide every case:
| Action | Reversible? | Automate? |
|---|---|---|
| Restart a crashed process | Yes | Full |
| Scale out under load | Yes | Full |
| Roll back a recent deploy | Yes | Full |
| Fail over to a healthy replica | Yes, tested path | Full |
| Delete, migrate or bulk-modify records | No | Never without confirmation |
| Any action without a tested undo | No | Never without confirmation |
| A failure mode the team has seen once | Unknown | Never without confirmation |
A practical middle ground that a lot of teams underuse: automate the diagnosis and propose the fix, but require a one-click human confirmation before it executes, at least until the specific failure mode has enough of a track record to justify full automation. That gets most of the speed benefit without accepting the risk of executing an unreviewed action against production.
Stage 4: What should you automate in the post-incident review?
The post-incident review (postmortem) is where teams either learn something durable or don’t, and it’s also the stage most likely to get skipped or rushed because it happens after the pressure is off. Automating its clerical parts makes it more likely to happen with useful content rather than getting reconstructed from memory two weeks later.
Automate the timeline: when the alert fired, when it was acknowledged, when the first diagnostic action happened, when mitigation started, when it resolved. Pulling this from the alerting and deployment systems directly is both faster and more accurate than a human reconstructing it from Slack timestamps after the fact.
Automate the metric and log snapshot: capture the relevant dashboards, the error rate curve, and the specific log and trace excerpts that were used during diagnosis, and attach them to the incident record while they’re still available, rather than relying on someone remembering to screenshot a dashboard that will have scrolled past its retention window by the time the retro happens.
Automate participant and impact tracking: who was paged, who responded, which services and customers were affected, and for how long. This is exactly the kind of data entry that gets skipped under time pressure if it’s manual, and exactly the kind of data a system already has if the incident was tracked through the same tooling that generated the alert.
What stays manual here is the actual analysis. Root cause, contributing factors, and the specific action items that prevent recurrence need a human conversation, ideally blameless, informed by the automatically assembled facts rather than trying to recall them. Automation’s job here is to make sure the retro starts with accurate inputs, not to write the conclusions.
Incident response automation checklist
A quick self-audit, stage by stage, to run against your current setup:
Detection
Triage
Response
Post-incident review
Conclusion: the bottom line
Incident response automation isn’t one feature you turn on. It’s a set of decisions made stage by stage: automate detection and triage aggressively, since the cost of getting those wrong is low and the time saved is large; automate remediation selectively, only for failure modes that are well-understood and reversible; and automate the post-incident review’s data collection while keeping the actual analysis human. Teams that get this balance wrong in either direction end up worse off, either drowning in unautomated toil or shipping an automated action that made an incident worse than the outage it was responding to.
The single biggest lever most teams are leaving unused is triage automation specifically, because it’s the stage where the most manual time gets spent and the least judgment is required.
Last9’s alerting handles the detection half of that. Alert rules run across telemetry signals, and grouped notifications bundle every firing labelset into a single notification instead of one page per timeseries, so a rule firing across dozens of tenants, deployments, or regions arrives as one alert with those labels attached rather than a flood of individual pages.
For the enrichment half, Last9’s AI Assistant queries logs, exceptions, metrics, and traces in plain English, so a responder can ask what changed and where the errors are concentrated instead of assembling that context by hand across four tools. It’s available in the Last9 dashboard, in Slack via @Last9 for collaborating during an incident, and in your IDE through Last9 MCP once you’re ready to write the fix.
FAQ
What is incident response automation?
Incident response automation is the use of tooling to handle the repeatable, mechanical parts of responding to an incident: alert correlation and routing, context-gathering during triage, and well-understood remediation steps. A human responder’s time then goes to diagnosis and judgment calls rather than manual data-gathering.
What parts of incident response should not be automated?
Anything involving irreversible or data-affecting actions, and any failure mode the team doesn’t yet understand well enough to trust an automated fix for. The final root-cause analysis and the action items from a post-incident review should also stay a human, blameless discussion rather than an auto-generated output, since automation can assemble the facts but shouldn’t write the conclusions.
What’s the difference between incident response automation and AIOps?
Incident response automation specifically covers the lifecycle of a single incident: detect, triage, respond, review. AIOps is a broader term for applying automation and machine learning across IT operations generally, which includes incident response but also covers things like capacity forecasting and anomaly detection outside the context of an active incident. For where AI specifically fits into the SRE side of that picture, see what AI SRE means in practice.
How do you decide which remediation actions are safe to automate?
Two questions: is the failure mode well-understood enough that the team would take the same action every time it happens, and is the action itself reversible if it turns out to be wrong. Restarting a crashed process or rolling back a recent deploy usually clears both bars. Anything touching data, or any action without a tested undo path, generally shouldn’t be fully automated without a human confirmation step first.
Does incident response automation reduce the need for on-call engineers?
It reduces the amount of manual, mechanical work an on-call engineer does per incident (tab-switching, manual correlation, timeline reconstruction). It does not reduce the need for a human in the loop. The judgment calls in an incident, such as deciding what a novel failure means and what to do about it, still need a person. Automation’s role is making sure that person starts with the context already assembled instead of spending the first fifteen minutes gathering it manually.
What should a post-incident review capture that automation can’t generate on its own?
Root cause analysis, contributing factors, and concrete action items to prevent recurrence. Automation can and should assemble the timeline, metric snapshots, and participant list before the review starts, but the actual analysis of why the failure happened and what specifically will change needs a human, blameless conversation informed by those facts.


