

The best observability tool depends on what drives your costs and how your team debugs. Datadog has the broadest integration catalog, Dynatrace has the most automatic root-cause analysis, Grafana Cloud fits Prometheus-native teams, Honeycomb leads for trace-first debugging, Coralogix and New Relic price by data volume, SigNoz is the strongest open-source option, and Last9 is built for high-cardinality telemetry with cost control before storage.
This comparison covers eight platforms that engineering teams shortlist most often in 2026. Every pricing figure below is a published list price as of September 2026, and each entry lists real strengths and real limits, including ours.
What should you look for in an observability tool?
An observability tool should let you answer a question you did not plan for, using data you already collected. That comes down to five checks worth running on any platform before you buy.
OpenTelemetry support without lock-in. OpenTelemetry is the CNCF standard for traces, metrics and logs. A platform that accepts OTLP natively lets you switch vendors later without re-instrumenting every service.
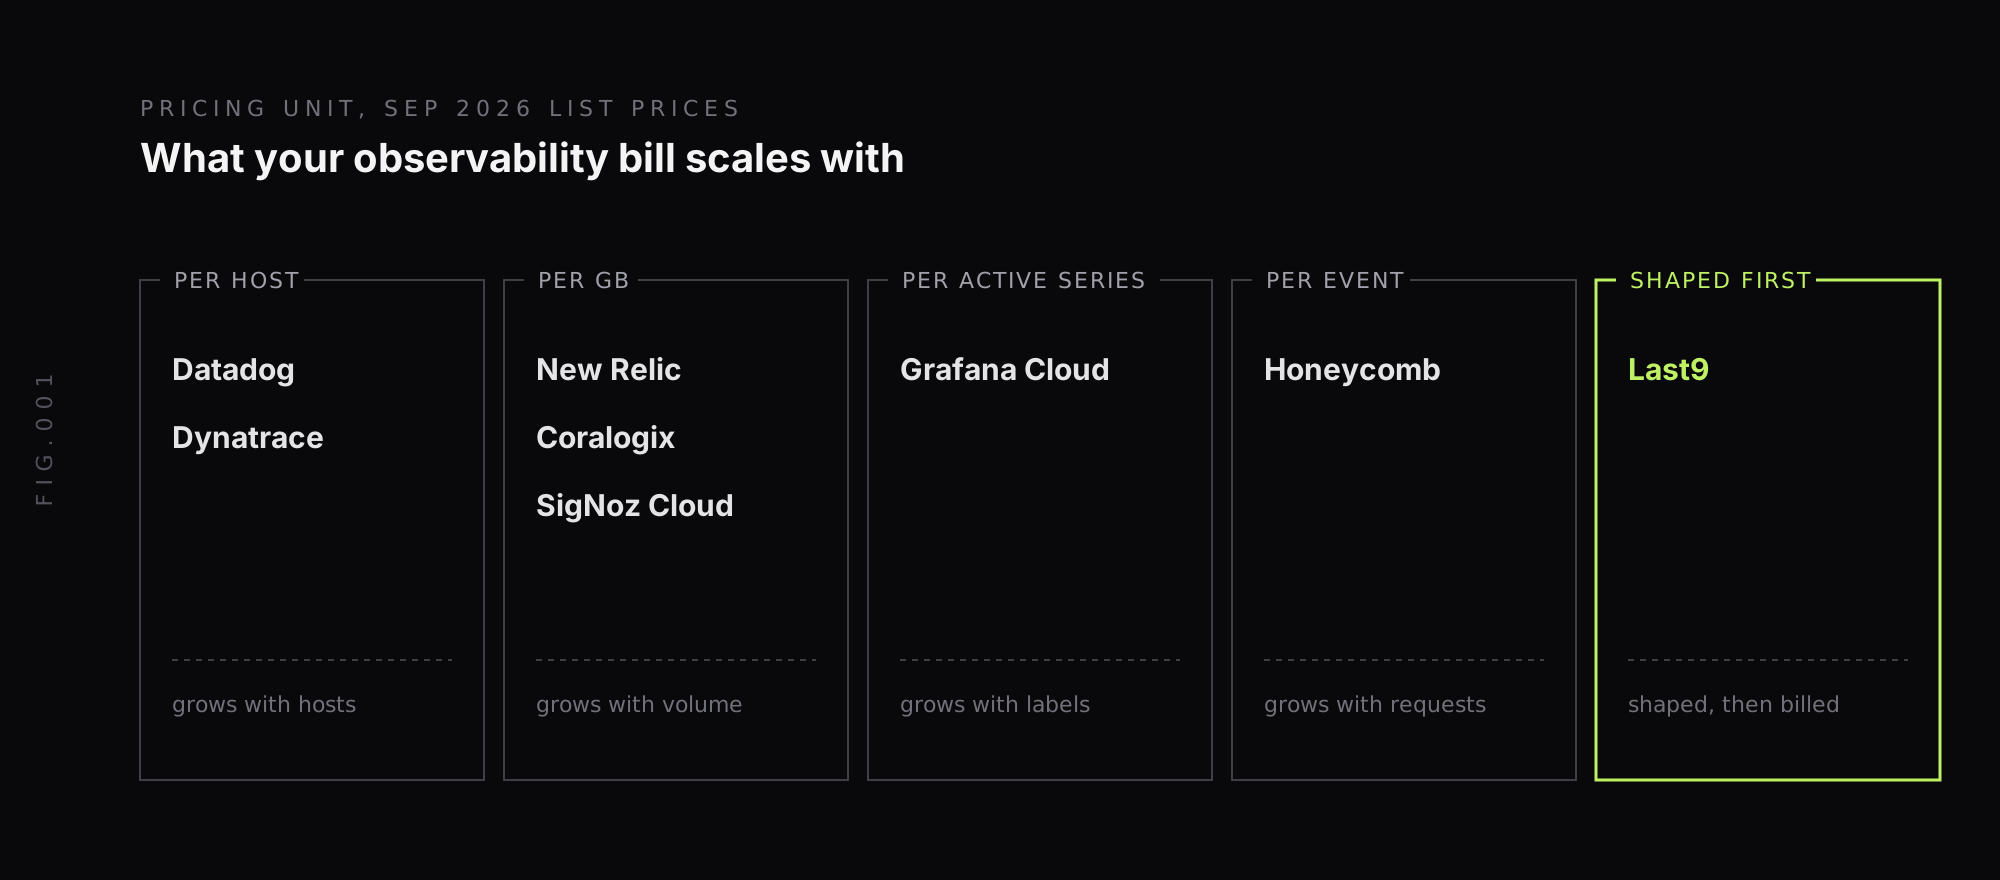
How pricing scales. Vendors bill by host, by GB, by active series or by event. The unit matters more than the list price, because it decides what happens when you add a label, a service or a region.
Cardinality handling. Labels like user_id, tenant_id or pod are what make telemetry useful for debugging. Some backends store one series per label combination and charge for each, so teams end up dropping the detail they need. Our guide on what high cardinality is explains why this matters.
Cross-signal correlation. Jumping from a slow trace to its logs and the metrics around it, without copying IDs between tabs, is where most debugging time is saved.
Deployment and compliance. Some teams need data to stay in their own cloud account or region. Check SaaS-only versus self-hosted versus bring-your-own-cloud options early.
How do the best observability tools compare?
| Tool | Best for | Pricing model (list, Sep 2026) | Deployment | Open source |
|---|---|---|---|---|
| Last9 | High-cardinality telemetry, cost control at ingestion | One licence; infrastructure on your own cloud bill | SaaS or Glassbox (your cloud account) | No |
| Datadog | Broad integration catalog, one vendor for everything | From $15/host/mo infra, $31/host/mo APM (annual) | SaaS | No |
| Grafana Cloud | Prometheus and LGTM stack users | $19/mo + $6.50 per 1k active series, $0.40/GB logs written | SaaS, BYOC (Enterprise) | Core stack is AGPLv3 |
| New Relic | Usage-based, all-in-one platform | 100 GB free, then $0.40/GB + per-user seats | SaaS (US or EU) | No |
| Dynatrace | Automatic root-cause analysis in large enterprises | About $0.08/hr per 8 GB host for full-stack | SaaS or Managed (self-hosted) | No |
| Honeycomb | Trace-first debugging of high-cardinality events | Free to 20M events; Pro from $150/mo | SaaS | No |
| Coralogix | Tiered log storage by data value | About $0.42/GB logs, $0.16/GB traces | SaaS, cold archive to your S3 | No |
| SigNoz | OpenTelemetry-native open source | Self-host free; cloud from $49/mo | Self-hosted or SaaS | Open core |
Pricing sources: vendor pricing pages and published third-party benchmarks, September 2026. Dynatrace and Coralogix figures are list rates reported by third-party benchmarks; enterprise contracts are usually discounted.
The per-host, per-GB and per-series meters in this table are where bills grow with cardinality. Last9 has no charge per label or metric name, and allows 20M series per metric per day by default, so it fits when new labels are what push the bill up. Our head-to-head comparisons go deeper on each vendor.
1. Last9
Last9 is an AI-native observability platform that unifies metrics, logs, traces, real user monitoring and alerting, built specifically for high-cardinality data. It keeps high-cardinality labels with no sampling, allows 20M series per metric per day by default, and regularly handles 500M+ events a minute and 60M+ concurrent users. It has monitored 12 of the world’s 20 largest streaming events.
Strengths:
- Control Plane to drop, aggregate, route and reshape telemetry before storage
- Open query languages: PromQL, LogQL and TraceQL, so existing dashboards and queries carry over
- Glassbox deployment runs single-tenant in your own cloud account, in any region, and we manage it for you. The infrastructure runs on your own cloud bill, at your negotiated rates
- AI features in both directions: an assistant, an MCP server and an agent that investigates alerts, plus LLM and agent monitoring for your own AI products. Our AI observability tools comparison covers the dedicated LLM tools
- Compliance: SOC 2 Type II certified, and ISO 27001, HIPAA and PCI DSS compliant, with SSO and access controls
Considerations:
- Smaller integration catalog (100+ integrations, plus anything with OpenTelemetry or Prometheus) than Datadog or New Relic
- No mainframe tracing, which Dynatrace covers for enterprise estates
Best for: teams whose observability bill grows with cardinality, platform teams standardizing on OpenTelemetry, and companies that need telemetry to stay inside their own cloud boundary.
2. Datadog
Datadog is the broadest all-in-one platform, covering infrastructure, APM, logs, RUM, security and more under one agent and one UI. Its main advantage is coverage: most teams find an integration for nearly everything they run.
Strengths:
- The largest integration catalog in this comparison, with mature out-of-the-box dashboards
- One vendor for infrastructure, APM, logs, synthetics and security
- Strong UI and fast onboarding for teams without an observability specialist
Considerations:
- Per-host pricing plus separate meters: $15/host/month for infrastructure and $31/host/month for APM on annual plans, with log indexing at $1.70 per million events (15-day retention) and custom metrics at $5 per 100 beyond the included allowance, per our Datadog pricing breakdown
- Custom metrics and high-cardinality tags are a common source of bill surprises
- SaaS only, with no self-hosted or in-your-account option
Best for: teams that want one vendor for everything and have budget headroom. Last9 is the better fit when custom metrics and cardinality are what drive the Datadog bill, as our Last9 vs Datadog comparison shows. See Datadog alternatives for more options.
3. Grafana Cloud
Grafana Cloud is Grafana Labs’ managed version of the LGTM stack: Loki for logs, Grafana for dashboards, Tempo for traces and Mimir for metrics. It is the natural choice for teams already running Prometheus and Grafana who want to stop operating the backend themselves.
Strengths:
- Open standards throughout: PromQL, LogQL and TraceQL
- The same open-source stack (AGPLv3) can be self-hosted, which reduces lock-in
- Generous free tier: 10,000 active series and 50 GB each of logs, traces and profiles
- Bring Your Own Cloud and Federal Cloud options on Enterprise
Considerations:
- Metrics bill per active series at $6.50 per 1,000 on Pro, so cardinality maps directly to cost
- Scrape interval matters: above 1 data point per minute, billing switches to total DPM, so 15-second scrapes can quadruple the metrics line
- Enterprise starts at a $25,000 annual minimum
Best for: Prometheus-native teams with predictable series counts. Last9 also speaks PromQL, LogQL and TraceQL, and fits when active-series billing is what grows the bill, since it has no charge per label or metric name. See Last9 vs Grafana, Grafana alternatives and Datadog vs Grafana for how it compares.
4. New Relic
New Relic is an all-in-one platform priced mainly on data ingested plus user seats, instead of per host. That makes it predictable for teams with many small hosts and modest data volume.
Strengths:
- 100 GB of free data ingest per month, then $0.40 per GB on the standard tier
- No per-host fee, so container-heavy environments are not penalized for host count
- NRQL query language with AI-assisted query generation
- Pipeline Control to drop data at ingest before it counts toward the bill
Considerations:
- Full platform users cost $349 per user per month on annual Pro plans, per our New Relic pricing breakdown, so seat costs grow with team size
- Data Plus, needed for longer retention and compliance features, raises ingest to $0.60 per GB
- SaaS only, hosted in US or EU regions
Best for: teams with high host counts and small platform teams. Last9 fits when you want to drop and aggregate telemetry before storage and keep high-cardinality labels with no charge per label or metric name. See Last9 vs New Relic, or New Relic vs Datadog for the two incumbents head-to-head.
5. Dynatrace
Dynatrace is built for large enterprises that want as much automation as possible. Its OneAgent auto-instruments hosts end to end, Smartscape maps dependencies automatically, and Davis AI does causal root-cause analysis instead of simple correlation.
Strengths:
- Mature causal AI for root-cause analysis across topology
- Automatic discovery and dependency mapping with a single agent
- Dynatrace Managed is a self-hosted option, operated entirely by your team
- Ingests OpenTelemetry alongside its own agent data
Considerations:
- Consumption-based pricing (Dynatrace Platform Subscription) with a separate Davis Data Unit meter for custom metrics, where splitting a metric by more dimensions increases consumption
- Third-party benchmarks put full-stack monitoring at about $0.08 per hour per 8 GB host, roughly $58 per host per month at list price
- DQL is its own query language, so skills and dashboards transfer less easily
Best for: large enterprises that prioritize automation over cost and have the budget for annual commits. See Last9 vs Dynatrace and Dynatrace alternatives for other options.
6. Honeycomb
Honeycomb is an event-based observability tool built around high-cardinality, trace-first debugging. Instead of pre-aggregated metrics, it stores wide events and lets engineers slice them by any field to find which users, endpoints or builds are behind a problem.
Strengths:
- Built for exploring high-cardinality data interactively
- BubbleUp analysis surfaces which attributes differ between slow and normal requests
- Strong OpenTelemetry support and a free plan with up to 20 million events per month
Considerations:
- Pricing is per event: Pro starts at $150 per month for 50 million events, with tiers up to 750 million, and Honeycomb raised its Pro rate to $3.00 per million events on new plans from July 2026, per its own plan-change notes
- Metrics and infrastructure monitoring are less central than in all-in-one platforms
- Teams often pair it with a separate metrics backend
Best for: engineering teams that debug mostly through traces and want to ask ad hoc questions of production data. Our roundup of tracing tools covers more trace-focused options.
7. Coralogix
Coralogix prices by data volume and lets teams route data into storage tiers based on how they use it. Its TCO Optimizer sends data to Frequent Search (fully indexed), Monitoring (analyzed but not indexed) or Compliance archive tiers, each at a different cost.
Strengths:
- Tiered storage can cut cost for data that only needs occasional access
- Unit-based pricing with no per-host or per-user fees
- Cold archive data lands in your own S3 bucket in Parquet format
- MCP server with read and write access to alerts and parsing rules
Considerations:
- Third-party benchmarks list about $0.42 per GB for logs, $0.16 for traces and $0.06 for metrics at standard rates, and real bills depend heavily on tier routing
- DataPrime is a proprietary query language
- Default cardinality limits apply to metrics sent through its OpenTelemetry integration, with excess series rolled into an overflow series
Best for: log-heavy teams that can classify data by value and want to archive most of it cheaply. See Last9 vs Coralogix for how the two differ.
8. SigNoz
SigNoz is an OpenTelemetry-native, open-core observability platform that combines metrics, logs and traces on a ClickHouse backend. It is the most common pick for teams that want an open-source, self-hosted alternative to commercial APM.
Strengths:
- Built on OpenTelemetry from the start, with no proprietary agent
- Self-hosting is free, with a managed cloud option when you do not want to run it
- Single UI for metrics, logs and traces
Considerations:
- Open core: some enterprise features sit under a separate commercial license
- Cloud pricing starts at $49 per month (which includes $49 of usage), then usage-based rates of about $0.30 per GB for logs and traces and $0.10 per million metric samples
- Self-hosting means your team operates ClickHouse at scale, including upgrades and on-call
Best for: teams committed to open source that have the engineering capacity to run their own backend, or want a low entry price on the cloud version.
What about a fully self-hosted open-source stack?
Many teams still run Prometheus, Grafana, Loki and Tempo or Jaeger themselves. There is no license cost, and every component uses open query languages. The trade-off is operational: storage, scaling, upgrades and on-call become your platform team’s job, and correlating signals across separate tools takes work.
Self-hosting makes sense at large, steady volumes with an experienced platform team. For most teams under that scale, a managed platform is cheaper once engineer time is counted. Our guides on Prometheus alternatives and OpenTelemetry vs Prometheus cover the open-source side in more depth.
How do you choose the right observability tool?
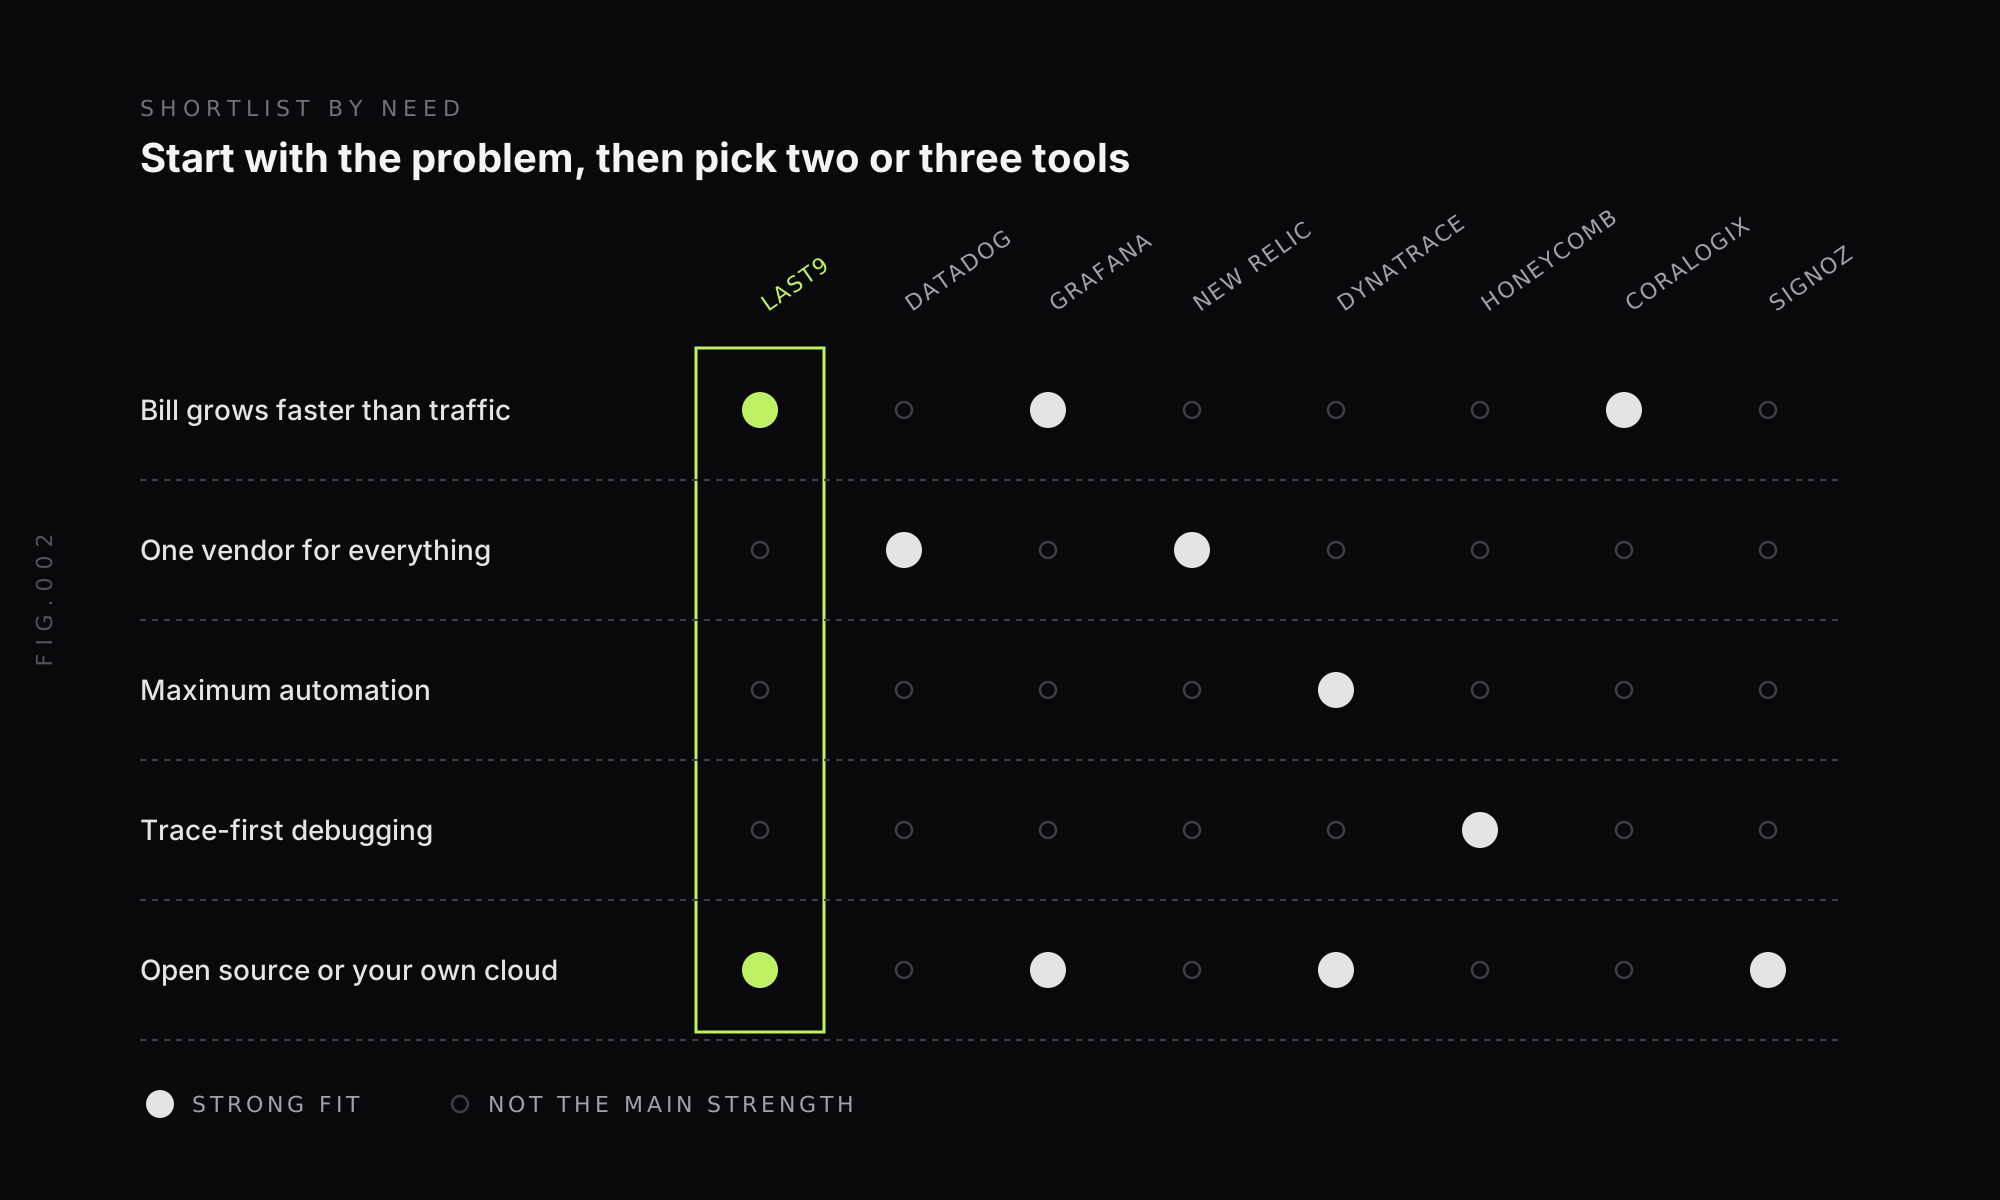
Start with the thing that hurts most today, then shortlist two or three tools that solve it.
- The bill grows faster than traffic: look at how each tool prices cardinality and volume. Last9, Grafana Cloud and Coralogix all offer ways to shape data before storage, with different trade-offs.
- You need everything under one vendor: Datadog and New Relic have the broadest single-platform coverage.
- You want maximum automation: Dynatrace’s OneAgent and Davis AI do the most without configuration.
- You debug mostly through traces: Honeycomb is purpose-built for it.
- You need open source or data in your own cloud: SigNoz and self-hosted Grafana for open source; Last9 Glassbox, Grafana BYOC or Dynatrace Managed for in-your-account deployment.
Whatever you shortlist, send it real production traffic for two weeks. Vendor demos never show how pricing behaves when a new label ships on a Friday.
Pick the pricing model before the feature list
Every tool in this list can collect metrics, logs and traces. The differences that matter over a year are how each one prices growth, how much lock-in its agents create, and whether it keeps the high-cardinality detail you need during an incident. Feature lists converge; pricing models and data models do not.
If your observability costs are climbing with cardinality, Last9 is built for exactly that problem: unified metrics, logs and traces, 20M series per metric per day by default with no sampling, and a Control Plane that drops and aggregates telemetry before you store it.
FAQ
What is the best observability tool in 2026?
There is no single best observability tool for every team in 2026. Datadog has the widest integration catalog, Dynatrace has the most mature automatic root-cause analysis, Grafana Cloud suits teams already on Prometheus, Honeycomb is strongest for trace-first debugging, SigNoz fits teams that want open source, and Last9 fits teams whose costs are driven by high-cardinality telemetry. The right choice depends on your stack, scale and pricing constraints.
What is the difference between monitoring and observability tools?
Monitoring tools track known signals against thresholds, such as CPU above 80% or error rate above 1%. Observability tools collect metrics, logs and traces with enough detail to investigate problems nobody predicted, by slicing data across many dimensions. Most modern platforms do both, and the practical difference is whether a tool keeps high-cardinality detail like user, tenant or request ID.
Which observability tools support OpenTelemetry?
All eight platforms in this comparison accept OpenTelemetry data: Last9, Datadog, Grafana Cloud, New Relic, Dynatrace, Honeycomb, Coralogix and SigNoz. The difference is depth. SigNoz, Last9, Honeycomb and Grafana Cloud are built around open standards, while Datadog, New Relic and Dynatrace also push their own agents, which offer extra features but create more lock-in.
What is the cheapest observability platform?
For small workloads, the cheapest options are the free tiers from Grafana Cloud, New Relic and Honeycomb, or self-hosting SigNoz or the Grafana LGTM stack. At scale, cost depends on the pricing unit: per host (Datadog, Dynatrace), per GB ingested (New Relic, Coralogix), per active series (Grafana Cloud) or per event (Honeycomb). The cheapest tool is the one whose unit grows slowest for your specific telemetry. Last9 has no charge per label or metric name, so it fits when cardinality, not host count, is what grows the bill.
How do I choose an observability platform?
Choose an observability platform by testing it on your own data rather than a vendor demo. Check four things: whether it accepts OpenTelemetry without proprietary agents, how its price scales with cardinality and volume, whether it correlates metrics, logs and traces in one query path, and whether it can deploy where your compliance rules require. Run a two-week trial with production traffic before signing.
Is Datadog worth the cost in 2026?
Datadog is worth the cost for teams that value a broad integration catalog and one vendor for infrastructure, APM, logs and security, and that can manage its pricing actively. Its list prices start at $15 per host per month for infrastructure and $31 per host for APM on annual plans, with custom metrics and log indexing billed separately, so costs rise quickly with host count and cardinality.


