


The main Amazon CloudWatch alternatives are Last9, Amazon Managed Service for Prometheus with Amazon Managed Grafana, Grafana Cloud, Datadog, New Relic, Elastic, and a self-hosted Prometheus and Grafana stack. Teams usually look for one when custom metric and log costs climb, when 1-minute detail rolling up to coarser data after 15 days limits investigations, or when they need AWS, other clouds and Kubernetes in one place.
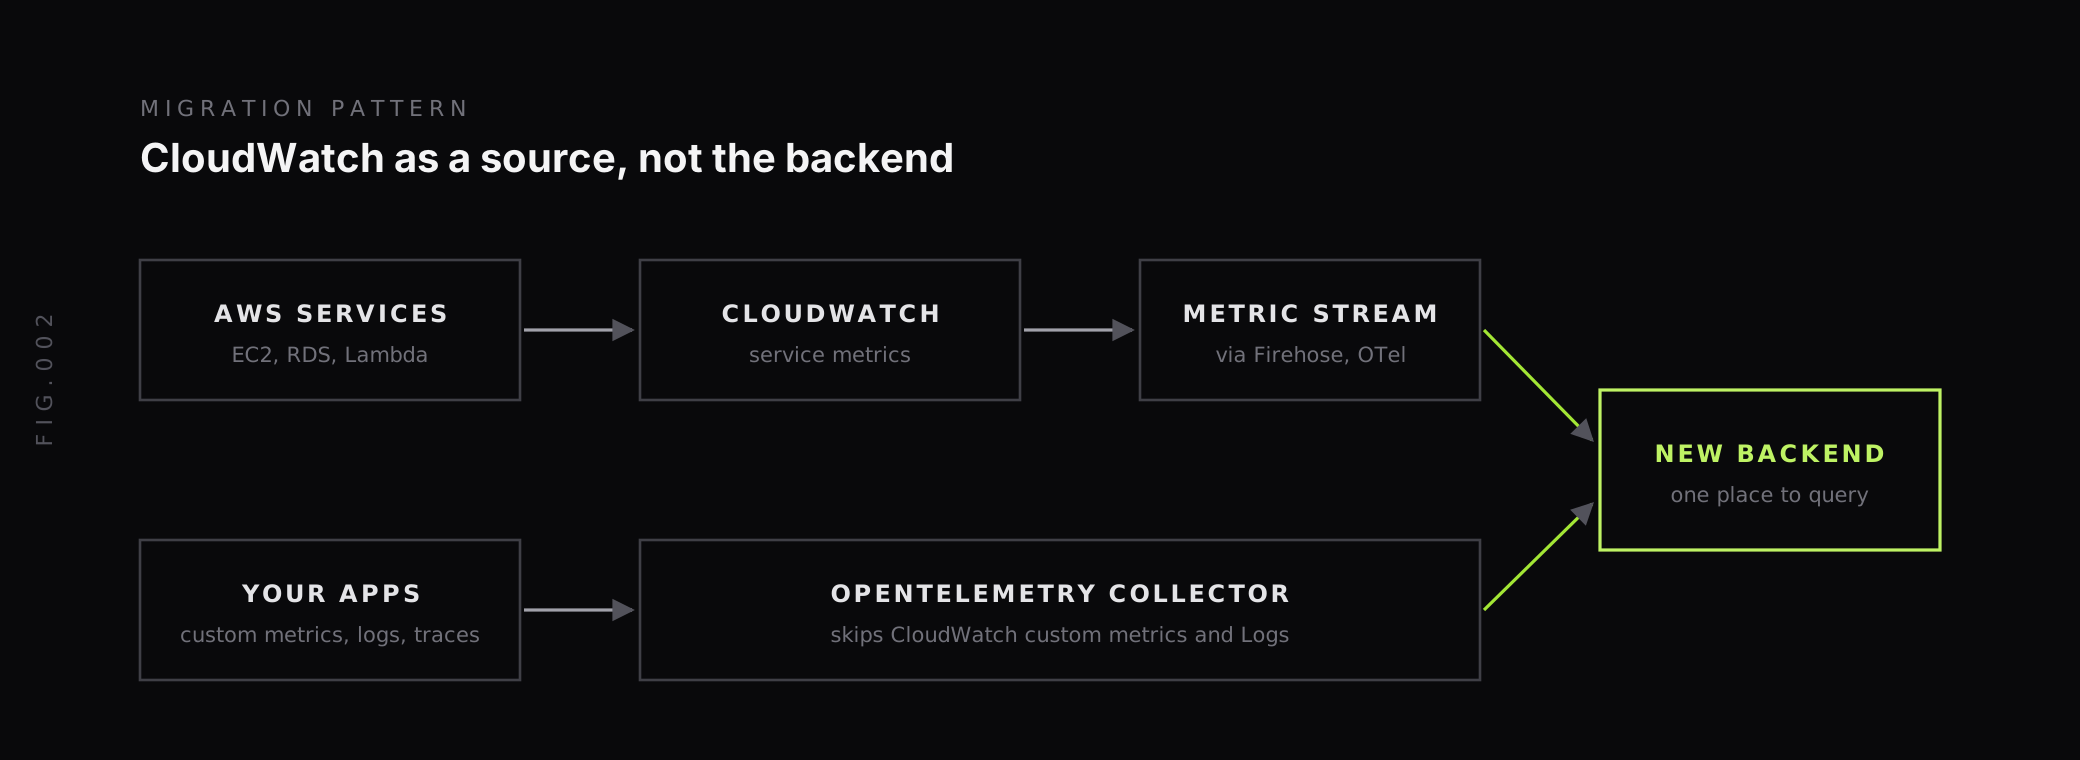
You rarely replace CloudWatch completely. AWS services publish their metrics to CloudWatch whatever else you run. The common pattern is to keep CloudWatch as the source for AWS service metrics, stream them out, and send custom metrics, logs and traces straight to the alternative.
CloudWatch itself changed a lot in 2026, with native OpenTelemetry metrics, PromQL and the new CloudWatch Omni. This guide covers what makes CloudWatch expensive, what changed, how seven alternatives compare, and how to move without losing AWS metrics. Prices are US East (N. Virginia) list prices from each vendor’s public pages as of October 2026.
Why do teams look for CloudWatch alternatives?
CloudWatch is the default for AWS because it needs no setup for AWS service metrics. The reasons teams add or move to something else are usually cost, retention and reach.
Custom metrics are priced per dimension combination. AWS’s metrics concepts page says CloudWatch “treats each unique combination of dimensions as a separate metric, even if the metrics have the same metric name.” Custom metrics cost $0.30 per metric a month for the first 10,000, $0.10 from 10,001 to 250,000, and $0.05 above that. A single metric name with a few useful dimensions can turn into thousands of billable metrics.
High-resolution detail doesn’t last. CloudWatch keeps 1-minute data points for 15 days, 5-minute data points for 63 days and 1-hour data points for 455 days. Data points under 60 seconds are kept for 3 hours. If you investigate an incident three weeks later, you see it at 5-minute resolution at best.
Logs cost per GB at every step. Standard log ingestion costs $0.50 per GB, Infrequent Access $0.25 per GB, and storage $0.03 per GB a month. AWS’s billing docs note that “A verbose log syntax drives volume and thus cost.”
Polling tools add to the bill. The same docs say the GetMetricData API “can also significantly increase your costs. Third-party monitoring tools often increase costs when they frequently pull data to generate insights.” Adding a second tool that polls CloudWatch can raise the CloudWatch bill rather than lower it.
It’s AWS-only. CloudWatch can accept data from elsewhere, but teams with workloads on several clouds or on-premises often want one place for all of them. Our multi-cloud monitoring guide covers that problem in detail.
How fast do CloudWatch custom metric costs grow?
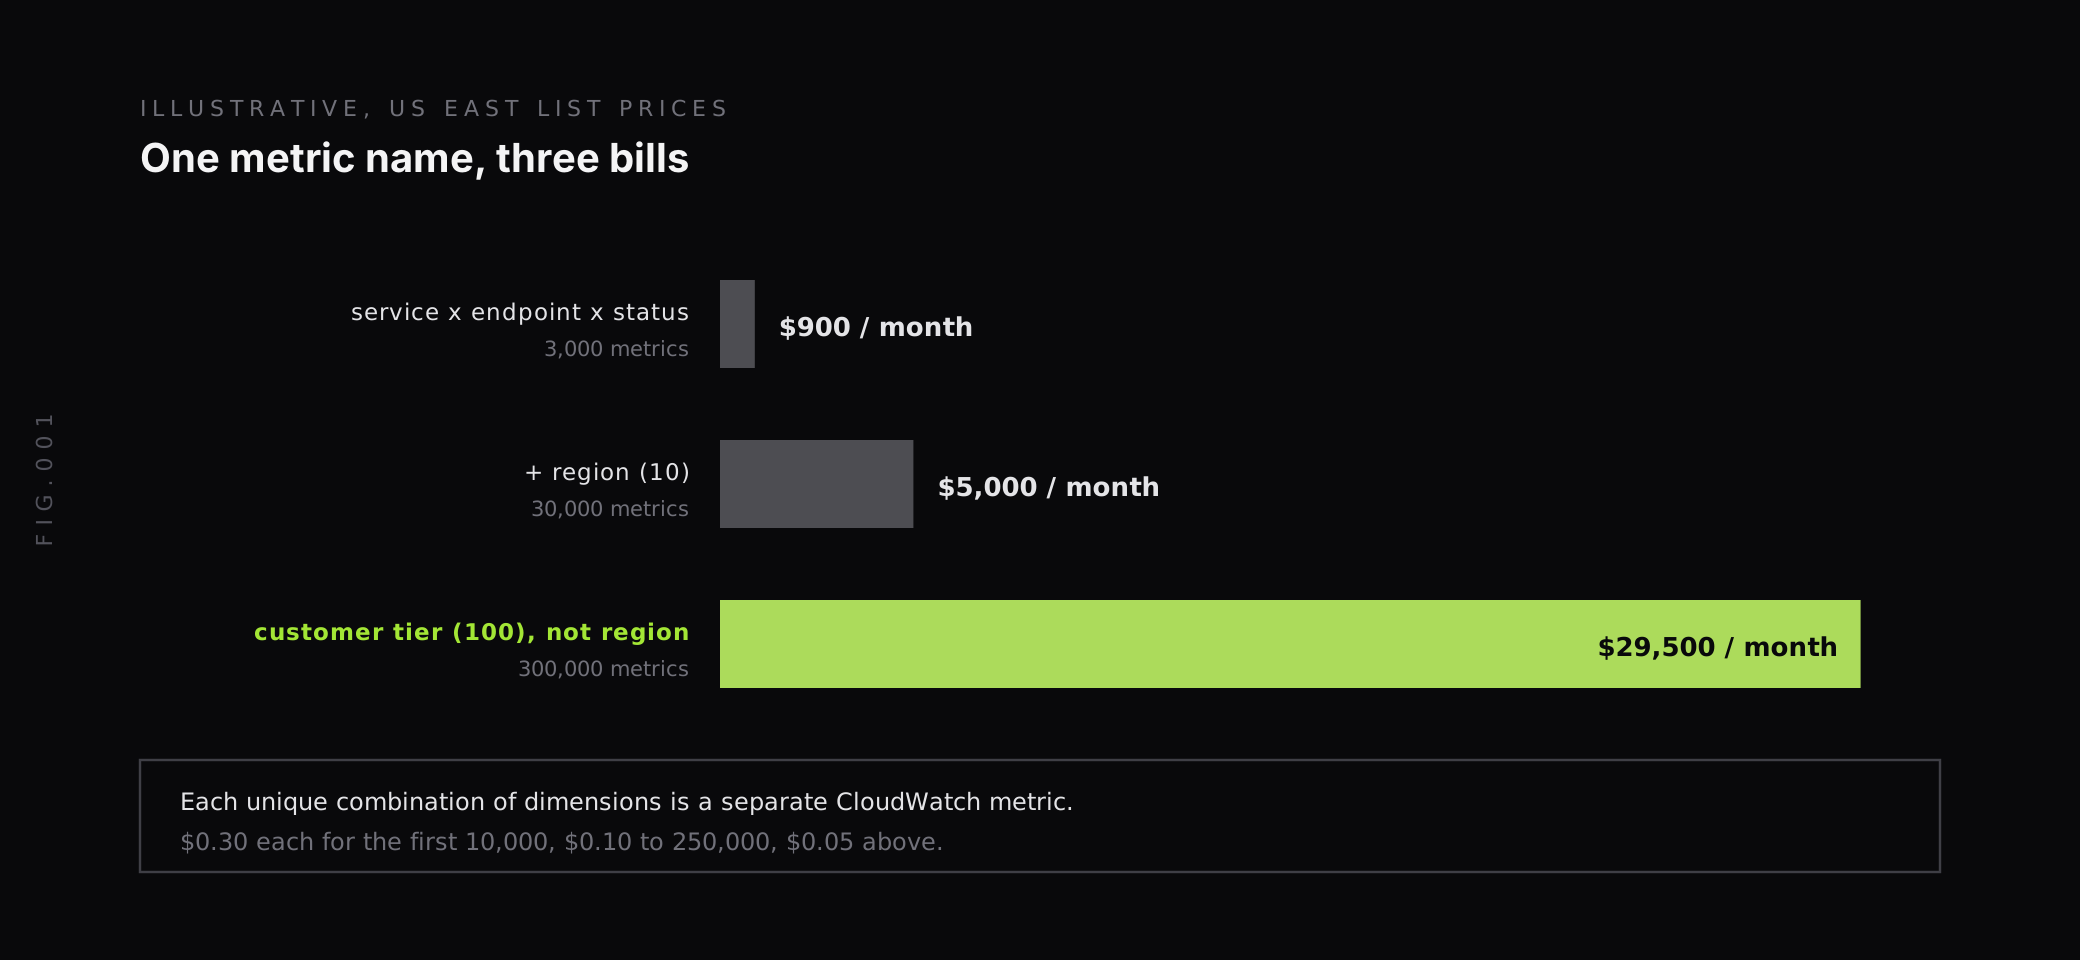
Take one custom metric, request_latency, and add dimensions one at a time:
| Dimensions | Combinations (metrics) | Monthly cost at list price |
|---|---|---|
| service (20) × endpoint (30) × status (5) | 3,000 | $900 |
| + region (10) | 30,000 | $5,000 |
| + customer tier (100) instead of region | 300,000 | $29,500 |
The first 10,000 metrics cost $0.30 each, the next 240,000 cost $0.10 and the rest $0.05, so 300,000 metrics come to $3,000 + $24,000 + $2,500. That is before API requests, alarms or logs. The free tier covers only 10 custom metrics.
What changed in CloudWatch in 2026?
Before you leave, check whether the 2026 changes fix your problem. AWS shipped three that matter:
- OpenTelemetry metrics with PromQL (June 16, 2026). CloudWatch now accepts OTLP metrics and supports PromQL through a Prometheus-compatible query API. These metrics are billed at $0.50 per GB ingested, with 15 months of storage included, and PromQL queries cost $0.01 per million samples scanned. For high-cardinality metrics, per-GB pricing can cost less than per-metric pricing.
- Managed Prometheus collectors (July 31, 2026). CloudWatch can scrape Prometheus metrics from EKS, EC2, ECS, MSK and OpenSearch Service with managed collectors and deliver them in OpenTelemetry format.
- CloudWatch Omni (September 22, 2026). AWS describes Omni as “the next generation of CloudWatch.” It runs outside the AWS Console, brings applications and AI agents into one view, accepts OTLP, and carries forward existing CloudWatch telemetry and alarms. It charges for ingest and storage, includes dashboards and alerts, and makes log and trace queries free up to 5 times your monthly log and span ingestion, then $0.005 per GB scanned.
If your main complaint was the classic custom metric price, the OpenTelemetry metrics path may be enough. If you need one tool across clouds, longer high-resolution retention, or control over what you keep before it’s stored, an alternative still makes sense.
What should you look for in a CloudWatch alternative?
- A way to keep AWS service metrics. Prefer tools that receive CloudWatch metric streams over tools that poll GetMetricData.
- A billing unit that suits your cardinality. Per metric, per sample, per active series, per GB or per host behave differently when you add a dimension.
- Retention at useful resolution. Check how long 1-minute or finer data is kept.
- OpenTelemetry and PromQL. Open standards keep instrumentation portable and make migrations config changes.
- Logs and traces in the same place. Moving metrics alone leaves you switching between tools during an incident.
How do the CloudWatch alternatives compare?
| Tool | How it bills (list) | Gets AWS metrics via | Best for |
|---|---|---|---|
| Last9 | One licence; no meter per active series or per GB | CloudWatch metric streams through Firehose | High-cardinality metrics with logs and traces together |
| Amazon Managed Service for Prometheus + Amazon Managed Grafana | $0.90 per 10M samples (first 2B), plus storage and queries; Grafana $9 per editor, $5 per viewer a month | CloudWatch data source in Grafana | AWS-native teams moving to Prometheus |
| Grafana Cloud | Per active series and data points per minute | CloudWatch integration | Prometheus and Grafana users who want it managed |
| Datadog | From $15 per host a month (annual), 100 custom metrics per host included | AWS integration | One vendor for infrastructure, APM, logs and security |
| New Relic | 100 GB/month free, then $0.40/GB, plus user seats | AWS integration | Many hosts, modest data volume |
| Elastic | Hosted or self-managed | AWS integrations | Search-heavy logs and security |
| Self-hosted Prometheus + Grafana | No license fee; you run the infrastructure | CloudWatch exporter or data source | Platform teams that want full control |
1. Last9
Last9 is an observability platform for metrics, logs and traces, built on OpenTelemetry and Prometheus-compatible query languages.
Strengths:
- AWS metrics without polling: our CloudWatch integration uses CloudWatch metric streams and Amazon Data Firehose, so AWS service metrics arrive without GetMetricData polling.
- Cardinality: we keep high-cardinality labels with no sampling, at 20M series per metric per day by default, so dimensions like customer tier or endpoint don’t have to be dropped.
- Control at ingest: our Control Plane lets you drop, remap, redact, forward and aggregate metrics, logs and traces at ingest, before storage.
- Deployment: Last9 runs single-tenant in your own cloud account, in any region, and manages it for you.
Considerations:
- AWS service metrics still originate in CloudWatch, so metric stream and Firehose charges remain on your AWS bill.
- CloudWatch alarms and dashboards need rebuilding as Last9 alerts and dashboards.
Best for: teams whose custom metric costs come from cardinality and who want metrics, logs and traces in one place.
2. Amazon Managed Service for Prometheus + Amazon Managed Grafana
The AWS-native alternative swaps CloudWatch custom metrics for Prometheus metrics, stored in Amazon Managed Service for Prometheus and visualized in Amazon Managed Grafana.
Strengths:
- Billed per sample, at $0.90 per 10 million samples for the first 2 billion, plus $0.03 per GB of storage and $0.10 per billion query samples processed. You don’t pay a monthly fee per label combination.
- PromQL and standard Prometheus tooling, including managed collectors.
- Stays inside AWS billing, IAM and compliance boundaries.
Considerations:
- Two services to set up and pay for, plus logs and traces somewhere else.
- Amazon Managed Grafana charges $9 per active editor and $5 per active viewer per workspace each month.
- Sample-based pricing grows with scrape frequency, so a 15-second scrape costs four times as much to ingest as a 60-second one.
Best for: AWS-only teams that want Prometheus without running it. See our post on AWS Prometheus production patterns.
3. Grafana Cloud
Grafana Cloud is Grafana Labs’ managed service for Prometheus-compatible metrics (Mimir), logs (Loki) and traces (Tempo).
Strengths:
- Open standards: PromQL, LogQL and TraceQL, with a self-hostable open source core.
- An AWS integration that brings CloudWatch metrics in alongside your Prometheus metrics.
- Metrics billed on active series and data points per minute, measured at the 95th percentile.
Considerations:
- Grafana Cloud Pro includes 1 data point per minute per active series, so faster scrape intervals raise the bill.
- Cardinality still maps directly to cost through active series.
Best for: teams already on Prometheus and Grafana. See our Grafana Cloud pricing breakdown.
4. Datadog
Datadog is an all-in-one platform covering infrastructure, APM, logs, real user monitoring and security, with an AWS integration that brings in CloudWatch metrics.
Strengths:
- Broad integration catalog and polished out-of-the-box AWS dashboards.
- One agent and one UI for most signals.
Considerations:
- Infrastructure Pro starts at $15 per host a month on annual billing, or $18 on demand, with 100 custom metrics per host included. Custom metrics beyond that are billed on usage.
- Logs are billed to ingest and again to index.
- SaaS only.
Best for: teams that want one vendor for everything. See our Datadog pricing breakdown.
5. New Relic
New Relic prices on data ingested plus user seats, not per metric or per host.
Strengths:
- 100 GB of data ingest free each month, then $0.40 per GB.
- Unlimited free basic users.
- No per-metric charge, so dimensions don’t multiply the price directly.
Considerations:
- Full platform users on Pro cost $349 per user a month on an annual commitment.
- SaaS only.
Best for: teams with modest data volume and many hosts. See our New Relic pricing breakdown.
6. Elastic
Elastic, the company behind Elasticsearch and Kibana, offers Elastic Cloud or self-managed deployments with AWS integrations for logs and metrics.
Strengths:
- Full-text search over logs, useful when you don’t know which field to filter on.
- Strong security analytics alongside observability.
- Self-managed option for full control.
Considerations:
- Running Elasticsearch yourself means managing shards, storage tiers and upgrades.
- Metrics are less central than in Prometheus-based tools.
Best for: log-heavy and security-focused teams. See our comparison of Elastic vs Splunk.
Last9 fits better when you want PromQL and LogQL instead of KQL and ES|QL, and a backend that runs in your own cloud account without you operating the cluster. Our Last9 vs Elasticsearch page compares the two.
7. Self-hosted Prometheus and Grafana
Running Prometheus, Grafana and a log store such as Loki or OpenSearch yourself removes license costs entirely.
Strengths:
- No per-metric or per-GB vendor fees, and full control of retention and resolution.
- Open source and portable across clouds.
Considerations:
- You operate storage, high availability, upgrades and on-call for the monitoring stack itself.
- Pulling AWS service metrics through a CloudWatch exporter uses the CloudWatch API, which adds API charges.
Best for: platform teams with the capacity to run it. Our Prometheus alternatives post covers scaling options.
How do you move off CloudWatch without losing AWS metrics?
Most teams end up with a hybrid setup. CloudWatch stays the source for AWS service metrics, and everything you control goes straight to the new backend.
- Stream AWS service metrics instead of polling. CloudWatch metric streams send metrics through Amazon Data Firehose in OpenTelemetry 1.0.0, OpenTelemetry 0.7.0 or JSON format. AWS bills them by the number of metric updates, plus Firehose charges. Filter the stream to the namespaces you use.
- Move custom metrics to OpenTelemetry or Prometheus. Instrument applications with OpenTelemetry and send metrics straight to the new backend, so they stop counting as CloudWatch custom metrics.
- Send application logs directly. Ship logs with the OpenTelemetry Collector or another agent instead of writing them to CloudWatch Logs first, so you don’t pay $0.50 per GB on the way.
- Rebuild alarms, then retire the old ones. Recreate the alarms that page someone, run both for a few weeks, then delete the CloudWatch versions so you stop paying for them.
For the OpenTelemetry side of this move, our guide to CloudWatch vs OpenTelemetry covers the migration paths, and how to cut down AWS CloudWatch costs covers savings you can make before you switch anything.
Keep CloudWatch as a source, not the backend
CloudWatch is hard to beat for AWS service metrics, because they’re there with no setup. It gets expensive when it also becomes the home for high-cardinality custom metrics and verbose logs, because it charges per dimension combination and per GB at every step.
Start by checking whether CloudWatch’s own 2026 changes, OpenTelemetry metrics at $0.50 per GB and CloudWatch Omni, solve your problem. If they don’t, stream AWS service metrics out with metric streams, move custom metrics and logs to OpenTelemetry, and pick the alternative whose billing unit grows slowest for your data. We built Last9 to take CloudWatch metric streams and OpenTelemetry data together.
FAQ
What are the best CloudWatch alternatives?
The most common Amazon CloudWatch alternatives are Last9, Amazon Managed Service for Prometheus with Amazon Managed Grafana, Grafana Cloud, Datadog, New Relic, Elastic, and a self-hosted Prometheus and Grafana stack. Most teams keep CloudWatch for the metrics AWS services publish and move custom metrics, logs and traces to the alternative, because that is where CloudWatch costs grow fastest.
Why is CloudWatch so expensive?
CloudWatch treats each unique combination of dimensions as a separate custom metric, at $0.30 per metric a month for the first 10,000 in US East. Adding a dimension such as customer or endpoint multiplies the metric count. Log ingestion costs $0.50 per GB in the Standard class, and AWS’s docs say third-party tools that frequently pull data through GetMetricData can significantly increase costs.
How long does CloudWatch keep metrics?
CloudWatch keeps data points with a period under 60 seconds for 3 hours, 1-minute data points for 15 days, 5-minute data points for 63 days and 1-hour data points for 455 days, or 15 months. After 15 days you can no longer see a metric at 1-minute resolution, which limits how far back you can investigate a short incident in detail.
Can you use another monitoring tool without removing CloudWatch?
Yes. AWS services publish their metrics to CloudWatch whatever else you run, so most teams keep CloudWatch as the source for those metrics and send them to another backend with CloudWatch metric streams, which deliver metrics through Amazon Data Firehose in OpenTelemetry or JSON format. Custom metrics, logs and traces can then go straight from your applications to the new backend through OpenTelemetry.
What is Amazon CloudWatch Omni?
CloudWatch Omni is an observability experience for applications and AI agents that AWS introduced on September 22, 2026. It works outside the AWS Console, accepts telemetry over OTLP, and carries forward existing CloudWatch telemetry and alarms. It charges for ingest, storage and queries, includes dashboards and alerts, and makes log and trace queries free up to 5 times your monthly log and span ingestion.
Is Amazon Managed Service for Prometheus cheaper than CloudWatch custom metrics?
It often is for high-cardinality metrics, because Amazon Managed Service for Prometheus bills per sample ingested, at $0.90 per 10 million samples for the first 2 billion, plus storage and query charges. Adding a label creates more series and samples, but no monthly fee for each label combination. The answer depends on scrape interval and series count, so model both.


