

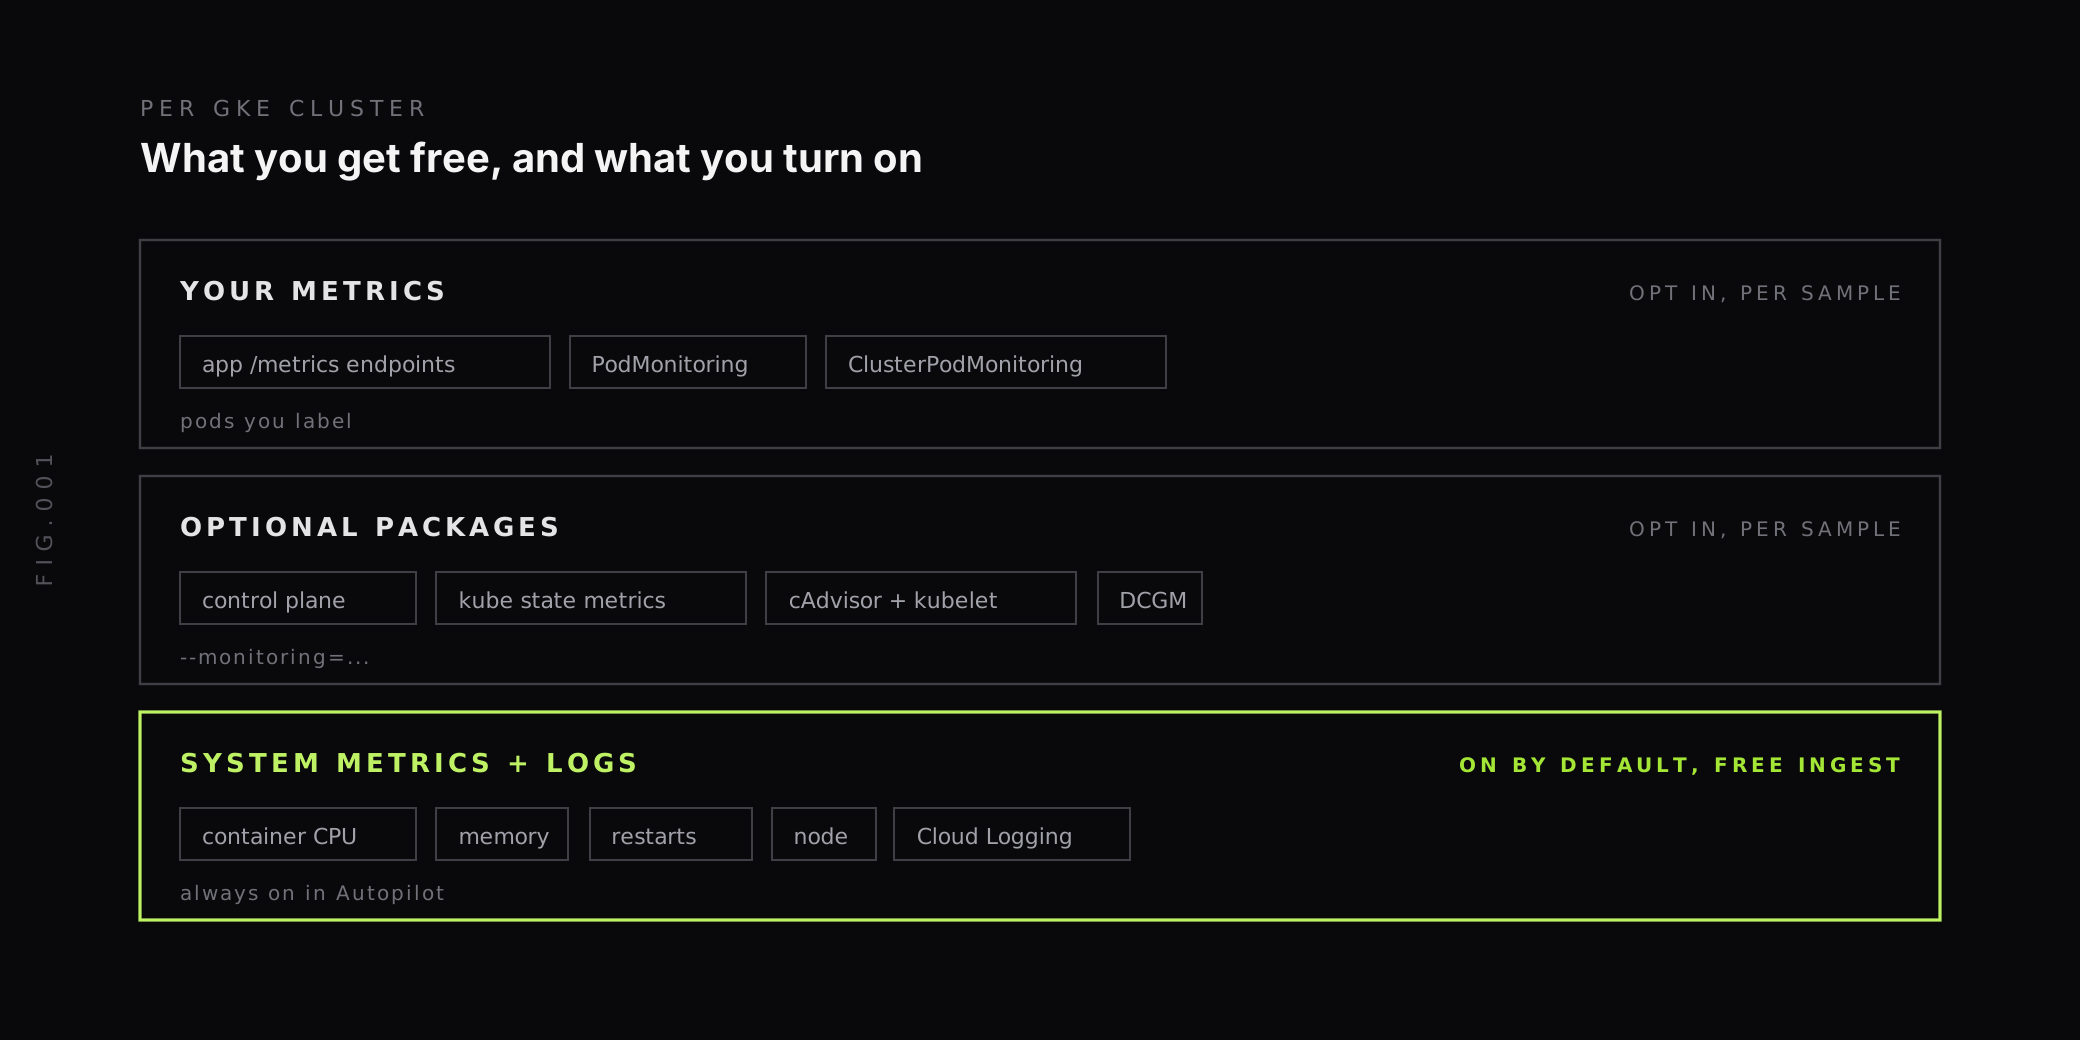
GKE monitoring starts before you install anything. Every Google Kubernetes Engine cluster sends system metrics to Cloud Monitoring and system, audit and application logs to Cloud Logging by default, and the system metrics are free to ingest.
What the default leaves out is the detail most incidents need: control plane health, your own application metrics, and on older clusters, kube state metrics such as pod phase and unschedulable pods. Those come from optional metric packages and from Google Cloud Managed Service for Prometheus, and they are billed per sample.
This guide covers what GKE collects by default, which packages to turn on, how Autopilot changes your options, which system metrics to read carefully, and the alerts to set first. Defaults, flags and metric definitions come from the GKE observability documentation and the Cloud Monitoring Kubernetes metrics reference.
What does GKE monitor by default?
Google’s docs describe three things a new GKE cluster does out of the box:
- System logs, audit logs and application logs go to Cloud Logging. Anything your containers write to stdout and stderr is included.
- System metrics go to Cloud Monitoring. These cover containers, pods and nodes: CPU, memory, restarts, network and storage. System metrics are always on in Autopilot clusters and on by default in Standard clusters.
- Managed Service for Prometheus is ready to collect third-party and user-defined metrics. Managed collection is on by default for Autopilot clusters on GKE 1.25 or later and Standard clusters on 1.27 or later.
One point on cost: Google states that “Cloud Monitoring does not charge for the ingestion of GKE system metrics.” Everything beyond the system metrics, including the optional packages below and your own Prometheus metrics, is charged by samples ingested.
For Autopilot clusters, the Cloud Monitoring and Cloud Logging integration cannot be turned off.
Which GKE metric packages should you turn on?
GKE groups optional metrics into packages that you enable per cluster. Each package is collected by Google, so you don’t run the exporter yourself:
| Package | --monitoring value | What it adds | Turn on when |
|---|---|---|---|
| System | SYSTEM | Container, pod and node CPU, memory, restarts | Always (on by default) |
| Control plane | API_SERVER, SCHEDULER, CONTROLLER_MANAGER | API server latency and errors, scheduling, controller work | You run many deploys or operators, or see slow kubectl |
| Kube state metrics | POD, DEPLOYMENT, STATEFULSET, DAEMONSET, HPA, STORAGE, JOBSET | Object state: pod phase, readiness, unschedulable pods, replica counts | Almost always; this is where “why isn’t my pod running” lives |
| cAdvisor and kubelet | CADVISOR, KUBELET | Detailed container and kubelet health | On by default from 1.29.3; turn on for older clusters |
| DCGM | DCGM | NVIDIA GPU utilization and memory | GPU node pools |
The workload and storage kube state metrics packages are enabled by default on Standard clusters from 1.29.2-gke.2000 and on Autopilot clusters from 1.27.4-gke.900. The cAdvisor and kubelet packages are on by default from 1.29.3-gke.1093000, and JobSet from 1.32.1-gke.1357001. Older clusters need them turned on by hand.
Enable packages with gcloud. The values you pass to --monitoring replace the previous setting, so run gcloud container clusters describe first and keep every package that is already on, including the ones GKE turns on by default:
gcloud container clusters update my-cluster \ --location=us-central1 \ --monitoring=SYSTEM,API_SERVER,SCHEDULER,CONTROLLER_MANAGER,POD,DEPLOYMENT,STATEFULSET,DAEMONSET,HPA,STORAGE,JOBSET,CADVISOR,KUBELETThe managed kube state metrics are the standard upstream metric names, such as kube_pod_status_phase, kube_pod_status_unschedulable and kube_pod_container_status_waiting_reason. Our guide to kube-state-metrics explains what each family means. In Cloud Monitoring they are stored with a prometheus.googleapis.com/ prefix and a suffix such as /gauge or /counter.
If you already run your own kube-state-metrics, Google warns that you “must stop collecting it before enabling managed kube state metrics, otherwise you might end up with duplicate or incorrect metrics.” Pick one source.
How do you collect application metrics on GKE?
Managed Service for Prometheus scrapes your own /metrics endpoints. You tell it what to scrape with a PodMonitoring resource, which selects pods by label in one namespace:
apiVersion: monitoring.googleapis.com/v1kind: PodMonitoringmetadata: name: checkout-api namespace: shopspec: selector: matchLabels: app.kubernetes.io/name: checkout-api endpoints: - port: metrics interval: 30sClusterPodMonitoring works the same way across all namespaces. Data is stored for 24 months, and you query it with PromQL, either in Cloud Monitoring or from any tool that speaks the Prometheus query API.
Google’s docs recommend managed collection for all Kubernetes environments. A self-deployed mode also exists, as a drop-in replacement for the Prometheus binary, if you need full control of the Prometheus configuration.
What changes when you monitor GKE Autopilot?
Autopilot manages the nodes for you, which removes several tools teams use on Standard clusters. From Google’s Autopilot security documentation:
- No privileged containers, unless the container is deployed by a Google Cloud partner.
- No host namespaces, so no
hostNetworkorhostPID, again apart from verified partners. - hostPath is limited: containers can request read-only access to
/var/log, and all other host paths are denied. - No SSH to nodes. Use
kubectl execfor container debugging instead.
In practice, the usual node-exporter DaemonSet, and many monitoring agents that read host files, do not run on Autopilot as-is. Privileged agents from Google Cloud partners and approved open source projects run only when the cluster installs a matching WorkloadAllowlist through an AllowlistSynchronizer, which needs GKE 1.32.2-gke.1652000 or later.
The simpler path on Autopilot is to let GKE collect the node and container layer through the system metrics and the CADVISOR and KUBELET packages, and to spend your own collection effort on application metrics, traces and logs, which need no host access.
Which GKE metrics should you watch?
GKE system metrics live under kubernetes.io/. These are the ones behind most incidents, with Google’s definitions:
| Metric | Kind and unit | What it measures | Freshness |
|---|---|---|---|
container/cpu/core_usage_time | Cumulative, seconds | CPU used on all cores by the container | Sampled every 60 s |
container/cpu/limit_utilization | Gauge, fraction | Share of the CPU limit in use | 60 s, then up to 240 s delay |
container/memory/used_bytes | Gauge, bytes | Memory usage, split by memory_type | Sampled every 60 s |
container/memory/limit_utilization | Gauge, fraction | Share of the memory limit in use, split by memory_type | 60 s, then up to 120 s delay |
container/restart_count | Cumulative, count | Times the container has restarted | 60 s, then up to 120 s delay |
node/cpu/allocatable_utilization | Gauge, fraction | Share of allocatable node CPU in use | 60 s, then up to 240 s delay |
Two details trip people up.
The utilization metrics are fractions, with unit 1. A value of 0.9 means 90%. An alert written as > 90 never fires. CPU limit utilization can go above 1, because a container can run past its CPU limit for a while; memory limit utilization cannot.
The delays add up. A metric sampled every 60 seconds and visible up to 240 seconds later can be five minutes behind. Alert windows shorter than that resolve and re-fire for no reason, so use windows of at least 5 to 10 minutes on these metrics.
Read memory by memory_type
The container memory metrics carry a memory_type label. Google defines it this way: “Evictable memory is memory that can be easily reclaimed by the kernel, while non-evictable memory cannot.” Evictable memory is mostly file cache, which grows whenever a container reads or writes files and shrinks when the kernel needs the space.
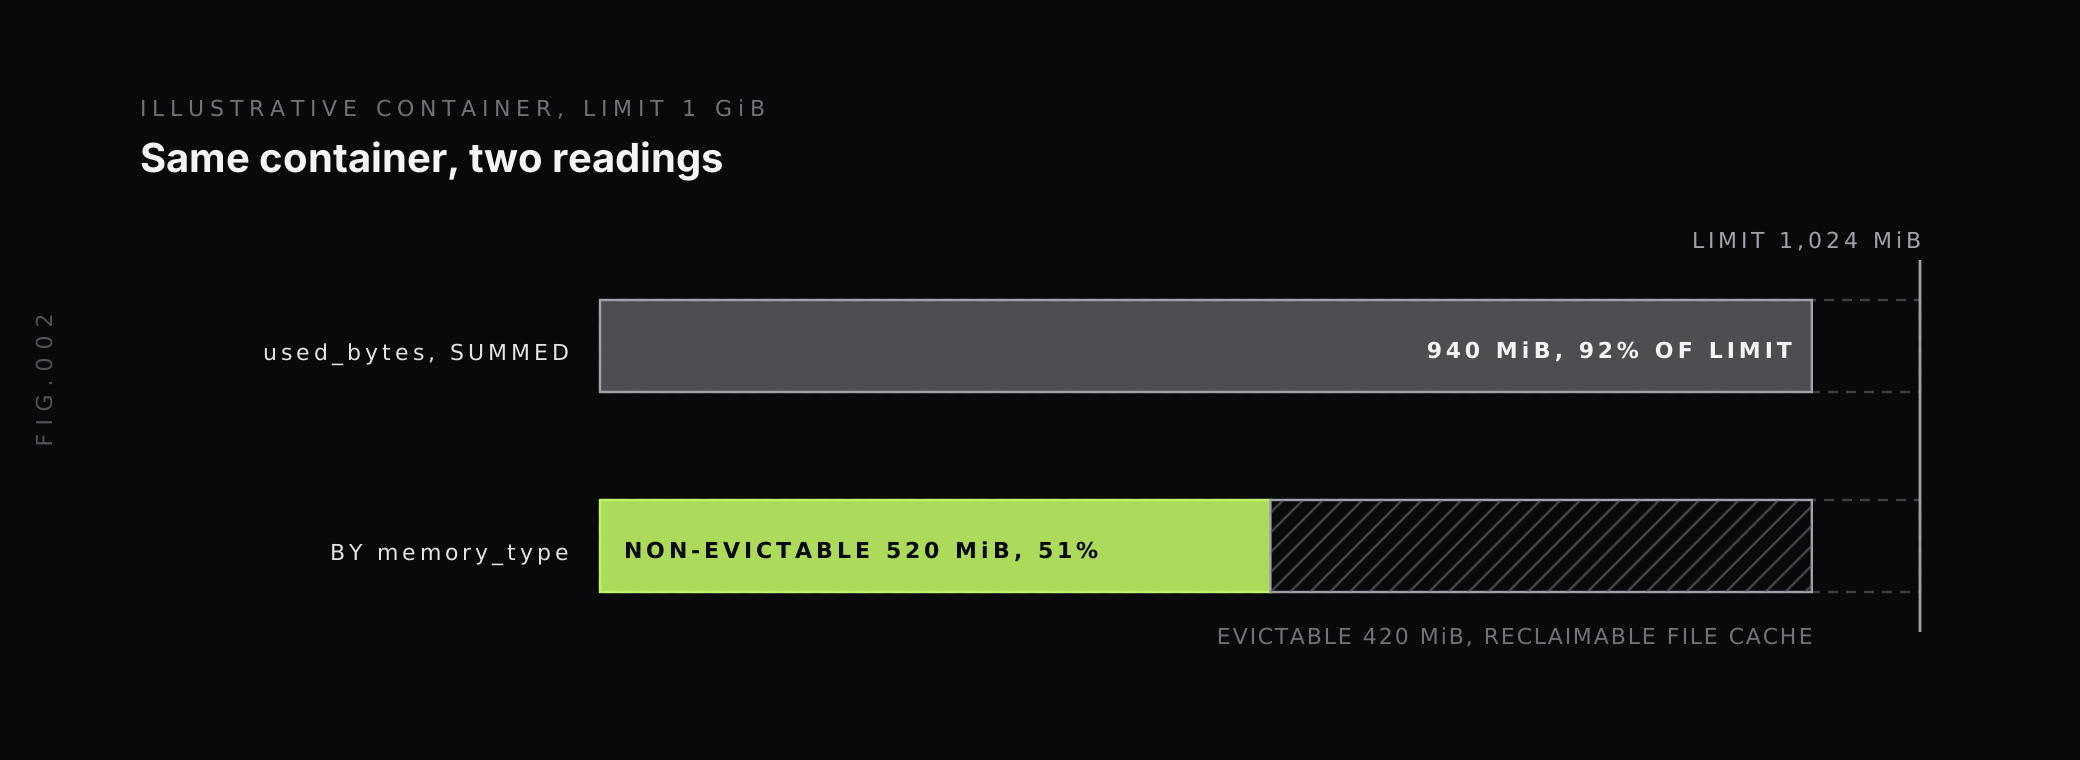
If you chart used_bytes without filtering the label, the default sum includes the cache. A service that reads large files looks permanently near its limit, and a memory alert on that sum pages for nothing. Filter to memory_type="non-evictable" for out-of-memory risk, and keep the evictable series only to explain I/O patterns. Our guide to pod memory usage covers the same distinction for working set metrics on other clusters.
Query system metrics with PromQL
Cloud Monitoring accepts PromQL for system metrics. In the legacy naming form, you replace the first / with : and every other / and . with _, so kubernetes.io/container/memory/limit_utilization becomes kubernetes_io:container_memory_limit_utilization:
max by (namespace_name, pod_name, container_name) ( kubernetes_io:container_memory_limit_utilization{ monitored_resource="k8s_container", memory_type="non-evictable" }) > 0.9That returns every container using more than 90% of its memory limit in memory the kernel can’t reclaim.
Which alerts should you set for GKE?
Start with alerts that catch user-facing failures, then add capacity alerts. These thresholds are starting points to tune for your workloads:
| Alert | Source | Condition |
|---|---|---|
| Container near OOM | container/memory/limit_utilization, non-evictable | Above 0.9 for 10 minutes |
| Crash looping | container/restart_count | More than 3 restarts in 15 minutes |
| Pods stuck pending | kube_pod_status_unschedulable or kube_pod_status_phase{phase="Pending"} | Any pod for 10 minutes |
| Image or config errors | kube_pod_container_status_waiting_reason | ImagePullBackOff, CrashLoopBackOff or CreateContainerConfigError for 5 minutes |
| CPU throttling risk | container/cpu/limit_utilization | Above 0.9 for 15 minutes on latency-sensitive services |
| Node pressure (Standard) | node/cpu/allocatable_utilization | Above 0.85 for 15 minutes across a node pool |
| Deployment short of replicas | Kube state metrics deployment package | Available replicas below desired for 10 minutes |
| API server errors | Control plane package | 5xx responses rising above the normal level |
The node alert matters less on Autopilot, where Google adds capacity for you. There, pending pods are a better signal, because a pod that cannot be scheduled shows a problem with requests, quotas or constraints.
Ephemeral storage is a common cause of evictions that these alerts miss. Our guide to ephemeral storage metrics in Kubernetes covers how to watch it.
Where does GKE monitoring fall short?
The defaults answer “is the cluster healthy” well. Four gaps usually remain:
- Requests across services. System metrics show a slow pod, not which upstream call made it slow. That needs distributed tracing, usually with OpenTelemetry.
- Cost of detail. Every optional package and every application metric is billed per sample, so teams turn off the packages that would have explained an incident. High-cardinality labels such as pod name multiply the sample count quickly.
- More than one cluster or cloud. Each project and cluster is its own scope in Cloud Monitoring unless you set up metrics scopes, and clusters on other clouds need a separate path.
- Joining signals. Logs in Cloud Logging, metrics in Cloud Monitoring and traces in a third tool make an incident a three-tab exercise.
Our overview of GCP monitoring covers the wider Google Cloud tool set if you want to stay inside it.
How does Last9 fit with GKE monitoring?
GKE runs standard Kubernetes, so the open-source collection path works there too. Our Kubernetes cluster monitoring integration installs an OpenTelemetry-based setup with a Helm script that collects node metrics, pod metrics, kube-state-metrics and cAdvisor metrics and sends them to Last9 with Prometheus remote write.
On Autopilot, check which components of any agent need host access before you install it, since those fall under the restrictions above. If you keep GKE’s managed kube state metrics, don’t run a second copy, for the duplicate-metrics reason Google gives.
Pod-level metrics create series quickly, since every pod restart brings a new pod name. Last9 supports 20M series per metric per day by default, with higher limits available on request, and applies no sampling. Our Control Plane lets you drop metrics and run streaming aggregations at ingest, so you can keep pod detail where you debug and aggregate it everywhere else.
Start with the free metrics, then pay for the right detail
GKE gives you more than most clusters get by default: free system metrics, logs, and a managed Prometheus that is already switched on. The work is in reading those metrics correctly and adding only the detail you will use. Utilization metrics are fractions, memory needs the non-evictable filter, and every metric can arrive minutes late.
Check that the kube state metrics packages are on first (current versions turn them on by default), because pending and crash-looping pods are the most common GKE incidents. Add control plane metrics if you run many deploys or operators, and plan around Autopilot’s host-access limits before you choose an agent. When you want GKE metrics next to traces and logs from every cluster you run, Last9 takes OpenTelemetry and Prometheus remote write and queries them together.
FAQ
How do you monitor a GKE cluster?
GKE sends system metrics to Cloud Monitoring and system, audit and application logs to Cloud Logging by default. On top of that, observability packages add control plane metrics, kube state metrics, cAdvisor and kubelet metrics, and NVIDIA DCGM GPU metrics, and current versions turn some of them on by default. You can also use Google Cloud Managed Service for Prometheus to scrape your own application metrics with PodMonitoring resources. Alerts are then set on container memory, CPU, restarts, pod status and node capacity.
Are GKE system metrics free?
Yes. Google’s documentation states that Cloud Monitoring does not charge for the ingestion of GKE system metrics. The optional observability packages, which cover control plane metrics, kube state metrics, cAdvisor and kubelet metrics and DCGM metrics, are charged by the number of samples ingested through Google Cloud Managed Service for Prometheus.
Is Managed Service for Prometheus enabled by default on GKE?
Managed collection for Google Cloud Managed Service for Prometheus is enabled by default on GKE Autopilot clusters running version 1.25 or later and on GKE Standard clusters running version 1.27 or later. Standard clusters can turn it off at creation. You still need to create PodMonitoring or ClusterPodMonitoring resources to tell it which application endpoints to scrape.
What is the difference between evictable and non-evictable memory in GKE?
GKE’s container memory metrics carry a memory_type label with two values. Google defines evictable memory as memory the kernel can easily reclaim, and non-evictable memory as memory it cannot. Evictable memory is mostly file cache. Because evictable memory can be freed under pressure, the non-evictable value is the one to alert on when you want to catch containers that are close to an out-of-memory kill.
Can you run node-exporter or privileged monitoring agents on GKE Autopilot?
Not by default. Autopilot blocks privileged containers, host namespaces and hostPath volumes apart from read-only access to /var/log, and it blocks SSH to nodes. Privileged agents from Google Cloud partners and approved open source projects can run only when the cluster has a matching allowlist. For node and container metrics on Autopilot, the managed cAdvisor and kubelet packages are the usual replacement for a self-run node-exporter.
How often are GKE system metrics sampled?
GKE system metrics such as kubernetes.io/container/cpu/core_usage_time and kubernetes.io/container/memory/used_bytes are sampled every 60 seconds. Some have an extra delay before data appears: Google documents up to 240 seconds for container CPU limit utilization and node allocatable CPU utilization, and up to 120 seconds for container memory limit utilization and restart count.


