

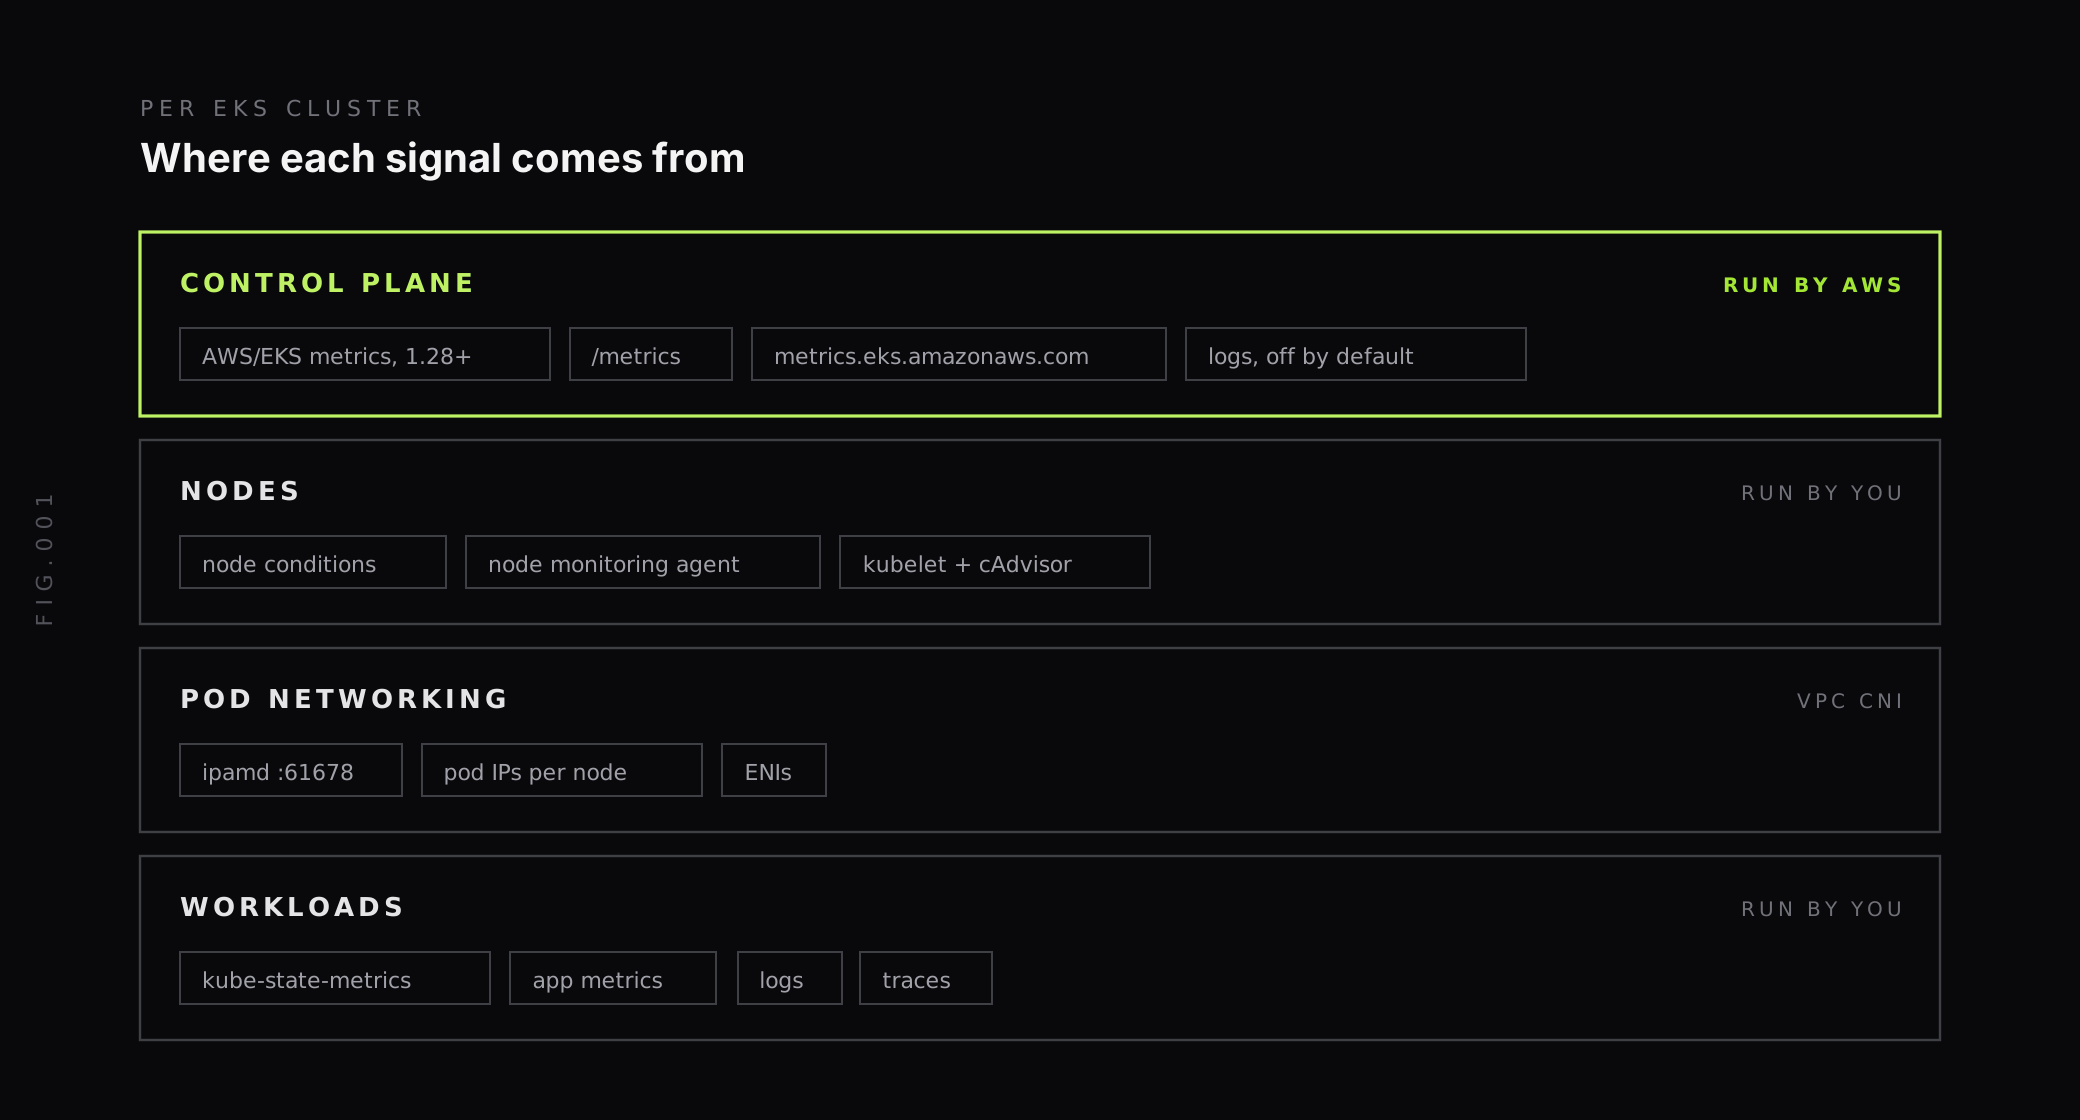
EKS monitoring covers four layers: the Kubernetes control plane that AWS runs for you, the nodes you run, the VPC networking that gives every pod an IP address, and your workloads.
AWS gives you more for the control plane than many teams realize. On Kubernetes 1.28 and above, basic control plane metrics land in CloudWatch for free, and the scheduler and controller manager expose Prometheus metrics too. Control plane logs are off until you turn them on. The EKS-specific failure to watch for is pod IP exhaustion, which can stop pods from starting on nodes with plenty of spare CPU.
This guide covers what to collect at each layer, the commands and scrape configuration to collect it, how to read VPC CNI metrics, and which alerts to set first. Details come from the Amazon EKS User Guide and from the source of the Amazon VPC CNI plugin.
What should you monitor in an EKS cluster?
Amazon EKS splits responsibility. AWS runs the control plane, and you run the data plane. Your monitoring follows the same split:
- Control plane (AWS-managed): API server request rates, errors and latency, scheduler queues, admission webhooks and etcd size. You can’t log in to these machines, so you read their metrics and logs through AWS.
- Nodes (yours): node conditions, CPU, memory, disk and the kubelet. This applies to EC2 managed node groups, self-managed nodes, Karpenter nodes and EKS Auto Mode. Fargate pods have no node for you to manage.
- Pod networking: the Amazon VPC CNI assigns VPC IP addresses to pods, and running out of them is a common EKS failure.
- Workloads: pod status, restarts, resource requests against limits, and the metrics, logs and traces your applications produce.
The Kubernetes monitoring metrics that apply to any cluster apply to EKS too. The rest of this guide focuses on what’s different about EKS.
Which EKS control plane metrics do you get for free?
For clusters on Kubernetes version 1.28 and above, Amazon EKS publishes basic control plane metrics to CloudWatch in the AWS/EKS namespace at no charge. Every metric has a one-minute frequency. The EKS console’s observability dashboard graphs the same data under Control plane monitoring.
These are the metrics to watch first:
| Metric (AWS/EKS) | What it tells you |
|---|---|
apiserver_request_total_5XX | API server requests that returned a server error |
apiserver_request_total_429 | Requests rejected because clients exceeded rate limits |
apiserver_request_duration_seconds_GET_P99, _LIST_P99, _PUT_P99 | 99th percentile API server latency by verb |
apiserver_current_inflight_requests_MUTATING, _READONLY | Requests the API servers are processing right now |
scheduler_pending_pods_UNSCHEDULABLE | Pods the scheduler tried to place and couldn’t |
scheduler_schedule_attempts_ERROR | Scheduling attempts that failed inside the scheduler itself |
apiserver_admission_webhook_rejection_count | Admission webhook requests that were rejected |
apiserver_admission_webhook_admission_duration_seconds | 99th percentile latency of third-party admission webhooks |
etcd_mvcc_db_total_size_in_use_in_bytes | Actual etcd data size, which AWS says determines whether the cluster will exceed the database size quota and enter read-only mode |
Two of these are easy to overlook. A rise in 429 responses usually means a controller or operator is calling the API server too often, and slow admission webhooks slow down every create and update that passes through them. Both show up as slow deployments long before anything fails outright.
How do you get EKS control plane metrics in Prometheus format?
The API server exposes its own metrics, which you can read without deploying Prometheus:
kubectl get --raw /metricsOn 1.28 and above, EKS also exposes kube-scheduler and kube-controller-manager metrics under the metrics.eks.amazonaws.com API group:
kubectl get --raw "/apis/metrics.eks.amazonaws.com/v1/ksh/container/metrics"kubectl get --raw "/apis/metrics.eks.amazonaws.com/v1/kcm/container/metrics"To scrape them continuously, the EKS User Guide gives a Prometheus job for each. This is the scheduler job; the controller manager job is the same with kcm in place of ksh:
- job_name: "ksh-metrics" kubernetes_sd_configs: - role: endpoints metrics_path: /apis/metrics.eks.amazonaws.com/v1/ksh/container/metrics scheme: https tls_config: ca_file: /var/run/secrets/kubernetes.io/serviceaccount/ca.crt insecure_skip_verify: true bearer_token_file: /var/run/secrets/kubernetes.io/serviceaccount/token relabel_configs: - source_labels: [ __meta_kubernetes_namespace, __meta_kubernetes_service_name, __meta_kubernetes_endpoint_port_name, ] action: keep regex: default;kubernetes;httpsThe Prometheus service account also needs get on the kcm/metrics and ksh/metrics resources in the metrics.eks.amazonaws.com API group. The guide patches an existing ClusterRole like this:
kubectl patch clusterrole <role-name> --type=json -p='[ { "op": "add", "path": "/rules/-", "value": { "verbs": ["get"], "apiGroups": ["metrics.eks.amazonaws.com"], "resources": ["kcm/metrics", "ksh/metrics"] } }]'The Prometheus version of the scheduler data gives you more than CloudWatch does. For example, scheduler_pending_pods comes with a queue label (active, backoff, gated, unschedulable), and the separate resourcemetrics endpoint returns kube_pod_resource_request and kube_pod_resource_limit for every pod.
How do you turn on EKS control plane logs?
Control plane logs aren’t sent anywhere by default. You enable each of the five log types per cluster:
| Log type | What it records |
|---|---|
api | API server logs, including its startup flags if you enable logging at or shortly after launch |
audit | Which users, administrators or system components affected the cluster |
authenticator | IAM authentication for Kubernetes RBAC; unique to EKS |
controllerManager | The core control loops shipped with Kubernetes |
scheduler | When and where pods were placed |
This AWS CLI command turns on all five:
aws eks update-cluster-config \ --region region-code \ --name my-cluster \ --logging '{"clusterLogging":[{"types":["api","audit","authenticator","controllerManager","scheduler"],"enabled":true}]}'Logs go to a CloudWatch Logs group named /aws/eks/my-cluster/cluster, with log streams named after each component. AWS describes delivery as arriving “within a few minutes” and “best effort”, so don’t build second-by-second alerts on them. Standard CloudWatch Logs ingestion and storage charges apply.
Audit logs are the most useful for investigations, because they answer “who deleted that deployment?” They record requests from controllers and system components as well as people, so they can grow large on a busy cluster. Enable them, then set a retention period on the log group that matches how far back your investigations go. CloudWatch subscription filters let you forward the logs to another system for analysis.
How do you monitor EKS nodes?
Node monitoring on EKS starts with standard Kubernetes node conditions: Ready, MemoryPressure and DiskPressure. kube-state-metrics exposes them, so the usual alerts work unchanged.
EKS adds the node monitoring agent. It reads node logs to detect problems and sets extra node conditions:
| Condition | What it reports |
|---|---|
KernelReady | Kernel errors, panics or resource exhaustion |
NetworkingReady | Problems with interfaces, routing or connectivity |
StorageReady | Problems with disks, filesystems or I/O |
ContainerRuntimeReady | Whether containerd can run containers |
AcceleratedHardwareReady | Whether GPU or Neuron hardware is working |
The agent is included in EKS Auto Mode. On other compute types you can install it as an EKS add-on or with Helm, except on Fargate. It runs on Linux only.
Pair it with automatic node repair, which replaces or reboots nodes based on these conditions when the agent is installed. Without the agent, it acts on Ready alone. Note what it leaves alone: automatic node repair doesn’t react to DiskPressure, MemoryPressure or PIDPressure, because those usually point to workload behavior rather than a broken node. You still need alerts for those.
Why do EKS pods fail to start on nodes with spare CPU?
With the Amazon VPC CNI, the default networking plugin for EKS, every pod gets a real IP address from your VPC subnet. Each node can hold only as many addresses as its elastic network interfaces (ENIs) allow, and that number depends on the instance type.
So a node can run out of pod IPs while it still has plenty of CPU and memory, and a busy subnet can run out of addresses for every node in it.
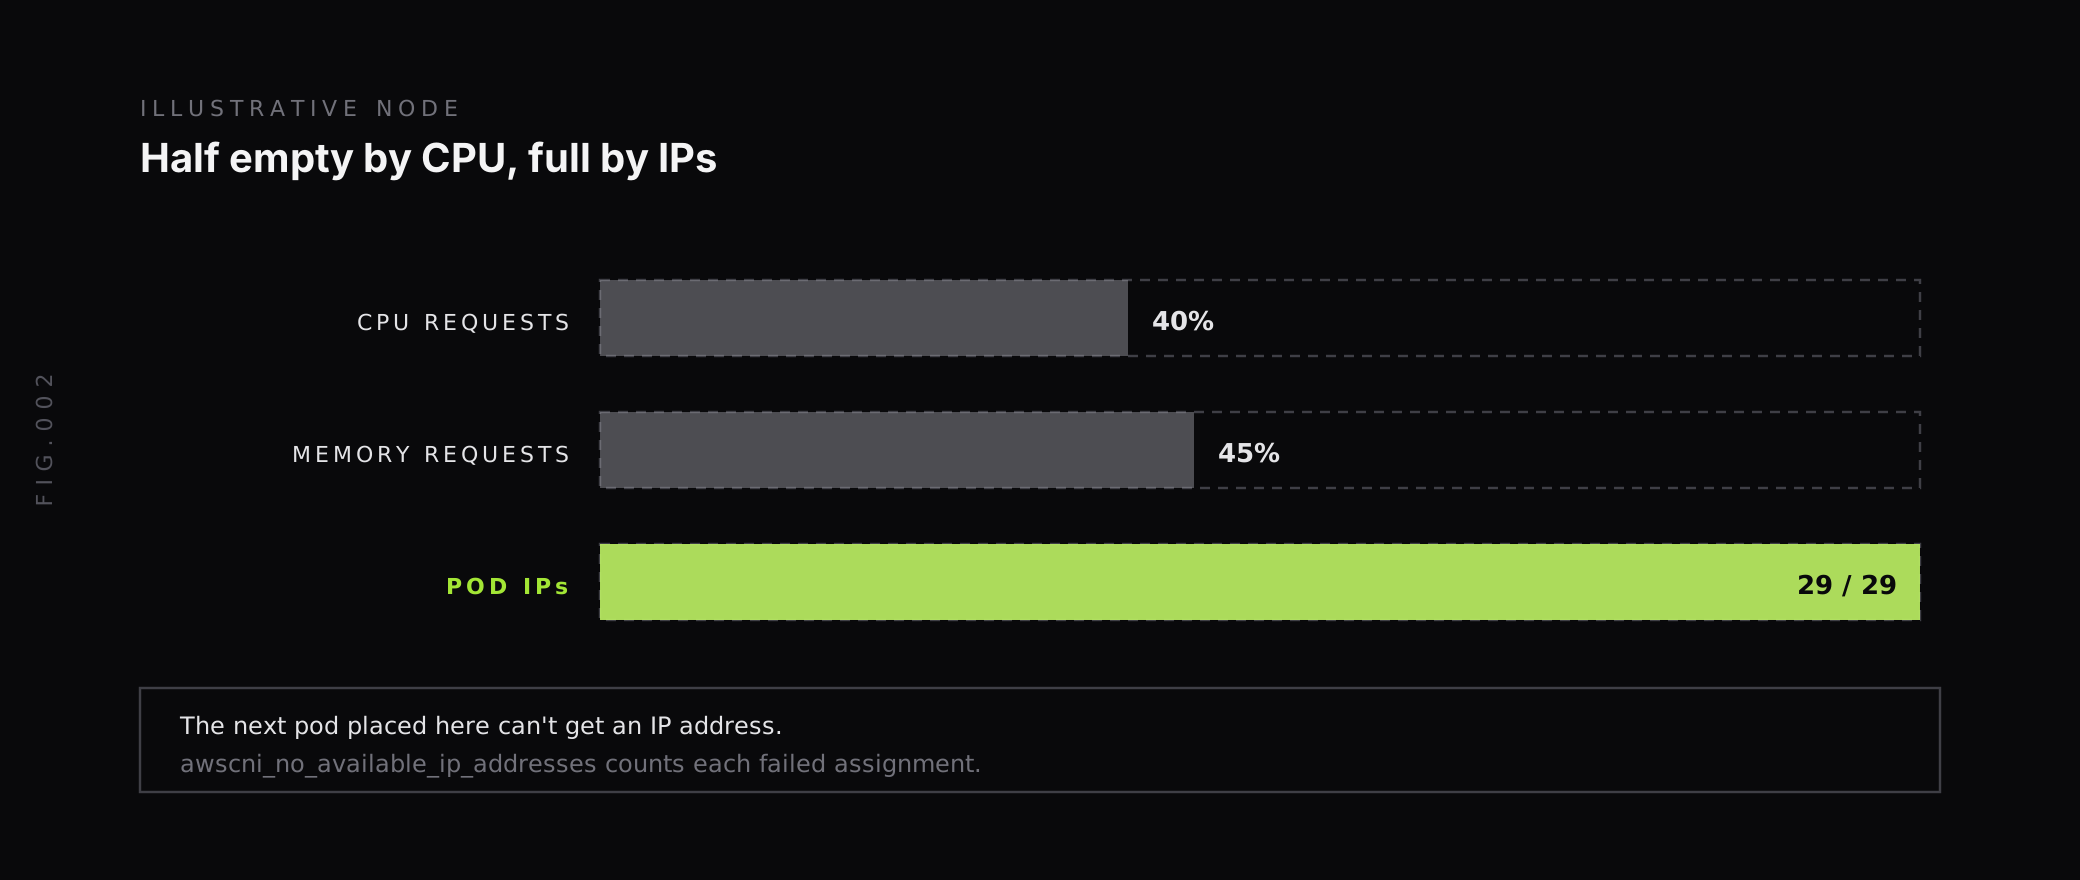
The CNI’s IP address management daemon, ipamd, publishes Prometheus metrics on port 61678 of each node. These answer the IP question directly:
| Metric | Definition (from the VPC CNI source) |
|---|---|
awscni_ip_max | The maximum number of IP addresses that can be allocated to the instance |
awscni_total_ip_addresses | The total number of IP addresses |
awscni_assigned_ip_addresses | The number of IP addresses assigned to pods |
awscni_no_available_ip_addresses | The number of pod IP assignments that fail due to no available IP addresses |
awscni_eni_allocated, awscni_eni_max | ENIs attached, and the most the instance can take |
awscni_aws_api_error_count, awscni_ec2api_error_count | Failed AWS and EC2 API calls made by the CNI |
awscni_ipamd_error_count | Errors inside ipamd |
Assigned against max shows how close each node is to its ceiling, and the failure counter tells you when pods have already hit it:
awscni_assigned_ip_addresses / awscni_ip_maxincrease(awscni_no_available_ip_addresses[10m]) > 0If you would rather have these in CloudWatch, the CNI metrics helper aggregates them per cluster and publishes them there. Its README notes that the API server connects to each worker node on TCP 61678, so if you use AWS’s recommended restricted security groups, you need a rule that allows that inbound connection.
Which alerts should you set for EKS?
Start with the control plane and pod IPs, because those are the failures that look different on EKS, then add the standard Kubernetes alerts. Thresholds are starting points to tune:
| Alert | Source | Condition |
|---|---|---|
| API server errors | AWS/EKS apiserver_request_total_5XX | Above zero for 5 minutes |
| API throttling | AWS/EKS apiserver_request_total_429 | Sustained increase over baseline |
| Slow API server | AWS/EKS apiserver_request_duration_seconds_LIST_P99 | Above 1 second for 10 minutes |
| Unschedulable pods | AWS/EKS scheduler_pending_pods_UNSCHEDULABLE | Above zero for 10 minutes |
| etcd growth | AWS/EKS etcd_mvcc_db_total_size_in_use_in_bytes | Rising week over week |
| Node not ready | kube_node_status_condition{condition="Ready",status="true"} == 0 | For 5 minutes |
| Node health condition | Node monitoring agent conditions | Any condition false |
| Pod IPs exhausted | increase(awscni_no_available_ip_addresses[10m]) > 0 | Any increase |
| Node IP headroom | awscni_assigned_ip_addresses / awscni_ip_max | Above 0.9 |
| Crash looping | increase(kube_pod_container_status_restarts_total[15m]) > 3 | Per container |
Route them by owner. Control plane alerts usually go to the platform team, and workload alerts to the team that owns the namespace. Our guide to Prometheus Alertmanager covers routing, grouping and inhibition, so one node failure doesn’t page you once per pod.
How does Last9 fit with EKS monitoring?
Our Kubernetes Cluster Monitoring integration installs with one setup script and Helm, and sends node metrics, pod metrics, kube-state-metrics and cAdvisor data to Last9 over Prometheus remote write. The same script can also ship Kubernetes logs and Kubernetes events through the OpenTelemetry Collector, so a pod restart, the event that explains it and the logs around it sit together.
For the EKS-specific signals, add the control plane scrape jobs above and a scrape of ipamd on port 61678 to the Prometheus or Collector you run, and send them with remote write. The PromQL in this guide runs unchanged on Last9.
Kubernetes metrics carry pod, container and node labels, and on EKS those change with every deployment and every node that Karpenter or a node group replaces. Last9 handles 20M series per metric per day by default, with no sampling, and our Control Plane lets you drop, remap, redact, forward and aggregate metrics, logs and traces at ingest, so short-lived pod labels don’t have to reach storage.
If you run on more than one cloud, see our guides to GKE monitoring and AKS monitoring.
Watch the control plane, nodes and pod IPs
EKS gives you a lot before you install anything. The AWS/EKS CloudWatch namespace covers API server errors, latency, throttling, scheduler queues and etcd size on clusters running 1.28 and above, and the scheduler and controller manager publish Prometheus metrics you can scrape. Control plane logs need turning on, one type at a time.
On your side, watch node conditions and add the node monitoring agent, and treat pod IPs as a resource as limited as CPU. Alert on unschedulable pods, nodes that aren’t Ready and IP assignment failures first. When you want EKS metrics, logs and events next to the services running on the cluster, Last9 takes Prometheus remote write and OpenTelemetry and queries them together.
FAQ
How do you monitor an EKS cluster?
Monitor four layers. For the AWS-managed control plane, use the free AWS/EKS CloudWatch metrics on Kubernetes 1.28 and above, the API server’s Prometheus endpoints and control plane logs. On nodes, watch node conditions. In pod networking, watch VPC CNI IP allocation. Workloads need kube-state-metrics and application telemetry. Alert first on API server errors, unschedulable pods, node health and IP exhaustion.
Does EKS provide control plane metrics?
Yes. On Kubernetes 1.28 and above, Amazon EKS publishes basic control plane metrics to CloudWatch in the AWS/EKS namespace at no charge, at a one-minute frequency. They cover API server requests, errors and latency, pending pods, admission webhooks and etcd database size. The kube-scheduler and kube-controller-manager also expose Prometheus metrics through the metrics.eks.amazonaws.com API group.
Are EKS control plane logs enabled by default?
No. Amazon EKS doesn’t send control plane logs to CloudWatch Logs by default. You enable each log type individually: api, audit, authenticator, controllerManager and scheduler. Logs go to a log group named /aws/eks/your-cluster/cluster, delivery is best effort within a few minutes, and standard CloudWatch Logs ingestion and storage charges apply.
Why are EKS pods stuck even though nodes have spare CPU?
With the Amazon VPC CNI, every pod gets an IP address from your VPC, and each node can hold only as many IPs as its ENIs allow. A node can run out of pod IPs while it still has spare CPU and memory. The VPC CNI metric awscni_no_available_ip_addresses counts pod IP assignments that fail because no address was available.
What is the EKS node monitoring agent?
The EKS node monitoring agent reads node logs to detect health issues and sets node conditions such as KernelReady, NetworkingReady, StorageReady, ContainerRuntimeReady and AcceleratedHardwareReady. It is included in EKS Auto Mode and can be added as an EKS add-on on other compute types except Fargate. It runs on Linux only.
Which EKS metrics should you alert on?
Start with API server 5XX responses and 429 throttling, API server request latency, pods that the scheduler marks unschedulable, nodes that are not Ready, etcd database size in use, and VPC CNI IP assignment failures. Add pod restart and pending-pod alerts per namespace for your workloads.


