

Honeycomb pricing is based on events: every span, log line and events-based metric you send counts toward a monthly allotment. The Free plan covers up to 20 million events a month. Pro starts at $150 a month for 50 million events and goes up to 750 million. Enterprise is custom priced from a base of 10 billion events a year.
Since July 1, 2026, Honeycomb’s docs give the Pro rate as $3.00 per million events, up from $1.30 on legacy plans. Because each span is a separate event, trace depth and request volume decide the bill, and sampling is the main lever for keeping it down.
The figures below come from Honeycomb’s public pricing page and its usage documentation as of October 2026. Honeycomb doesn’t publish a price for every Pro tier, so treat any figure above the starting tier as an estimate and check the billing page in your account.
What are Honeycomb’s pricing plans?
Honeycomb sells three plans, and its pricing page lists unlimited seats, so the number of engineers using it doesn’t change the price.
| Free | Pro | Enterprise | |
|---|---|---|---|
| Price | $0, “free forever” | Starting at $150 a month | Custom quote |
| Events per month | Up to 20M | 50M to 750M | Base of 10B events a year |
| Metrics data points per month | Up to 100M | 250M to 3.75B | Variable |
| Triggers (alerts) | 2 | 100 | Starts at 300 |
| SLOs | None | 2 | Starts at 100 |
| Service Map | No | No | Yes |
| SSO | Not listed | Yes | Yes |
| Throttling when over the limit | Yes | Yes | Exempt |
| Billing | n/a | Monthly or annual | Contract |
Every plan includes distributed tracing, BubbleUp, OpenTelemetry support, Honeycomb Metrics, and AI features such as Canvas and the Honeycomb MCP server. Enterprise adds the Query Data API, AWS PrivateLink, an SLO Reporting API, enterprise support for Refinery, and the option of Honeycomb Private Cloud.
Honeycomb’s usage docs list retention by data type rather than by plan: 60 days of fixed retention for events and logs, and 13 months by default for time series metrics. Retention counts from the day Honeycomb ingests the data, not from the timestamps inside it.
What changed in Honeycomb Pro pricing in 2026?
Honeycomb changed Pro pricing on July 1, 2026. Its docs list these changes:
- Price per event: $3.00 per million events, compared with $1.30 per million on legacy plans.
- Tiers: Pro moved from three event tiers to four, topping out at 750 million events a month.
- Features: Pro now includes time series metrics and AI features such as Canvas and the Honeycomb MCP.
- Unchanged: triggers, SLOs, support tier, usage measurement and retention.
Existing Pro customers can stay on their legacy plan until December 31, 2026. During that grace period they can commit to an annual term on their legacy tier at the legacy rate plus 20 percent. If they do nothing, Honeycomb moves them at the next billing boundary to the 2026 tier closest to their current plan, based on the plan they’re on and not their actual usage. Annual customers keep their plan until renewal.
For a team at the same volume, the per-event rate is more than double the legacy rate. The included time series metrics offset part of that. Moving infrastructure metrics from events to time series metrics frees event capacity, which Honeycomb itself suggests reviewing before picking a new tier.
Honeycomb publishes the $150 starting price for 50 million events, which matches the $3.00 rate. At the same rate, the 750 million event top tier would be about $2,250 a month. Honeycomb doesn’t list the price of each tier publicly, so confirm the exact figure on your billing page.
How does Honeycomb count events?
An event is one unit of work, and the rules for what that means differ by signal:
- Traces: every span is an event. Honeycomb’s docs say it counts each span, including OpenTelemetry span events and span links, as an event. A trace with 150 spans is 150 events.
- Logs: Honeycomb stores logs as events, and its logs documentation says log data counts against the event allotment alongside trace data.
- Time series metrics: counted as data points, with a separate monthly allotment. Each successfully ingested observation is one data point. Honeycomb tracks the two allotments separately, but going over either one can lead to throttling.
- Events-based metrics: if you send metrics into an events dataset, they are stored and counted as events.
The trace rule matters most. Adding auto-instrumentation for a database client or an HTTP library adds a span to every request that touches it, so a library upgrade can raise your event count without any change in traffic.
The events-based metrics rule can trip teams up too. Honeycomb combines data points into one event only when they share a timestamp (truncated to the second), arrive in the same OTLP request, and have the same resource and data point attributes. In the docs’ own example, a metric with host.name, http.method and http.host attributes, each with 2 values, produces 8 time series and 80 events over 10 minutes. Every new attribute multiplies the count.
What does Honeycomb cost for a real service?
Take one API service with this traffic:
- 20 requests a second, all day
- 15 spans per request on average, from the service and its database and cache clients
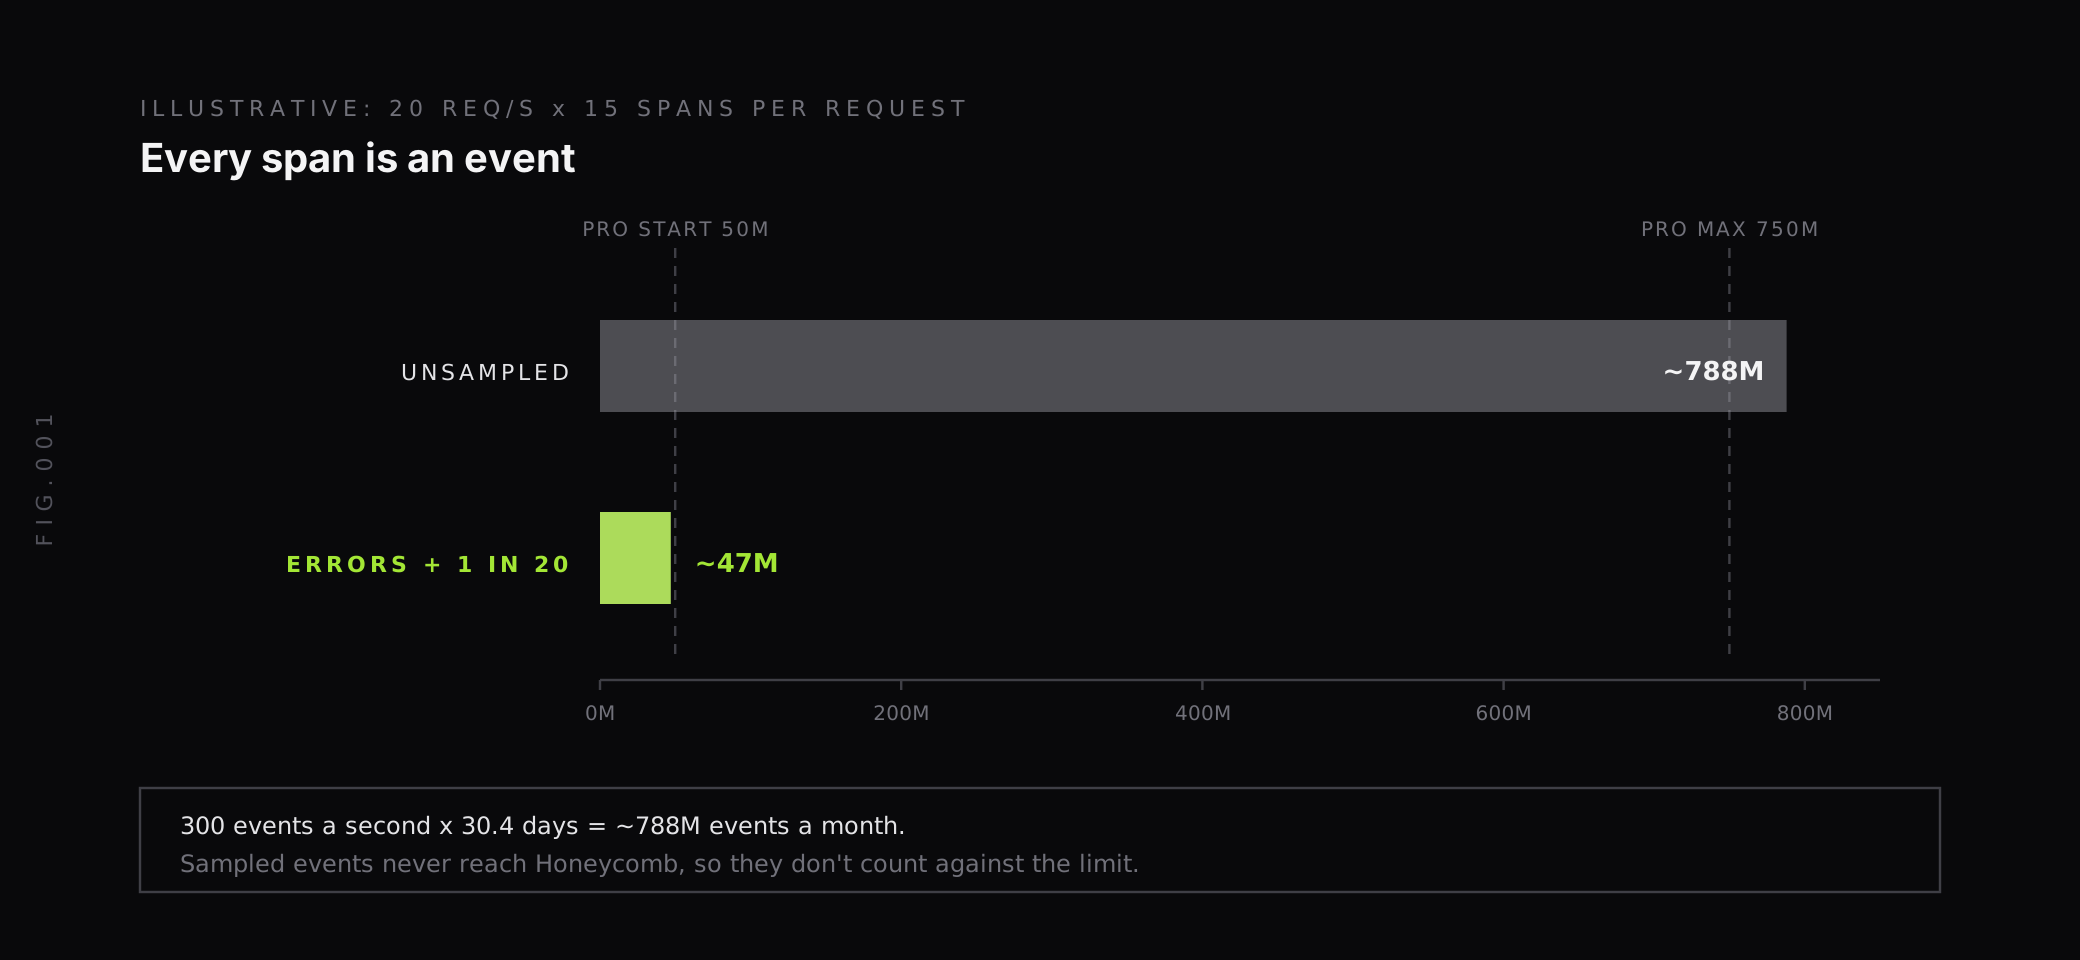
That works out to 300 events a second. Over Honeycomb’s 30.4-day month, it comes to about 788 million events, which is above Pro’s 750 million ceiling. Without sampling, this one service needs an Enterprise plan.
With tail-based sampling, the numbers change. Suppose 1 percent of requests fail, you keep every failed trace and 1 in 20 successful ones. That keeps about 6 percent of traffic:
| Events per month | Plan that fits | |
|---|---|---|
| Unsampled | ~788M | Above Pro, so Enterprise |
| Keep all errors and 1 in 20 successes | ~47M | Pro starting tier, 50M events at $150 a month |
Two things move this estimate the most. Doubling traffic doubles events. Doubling trace depth, for example by instrumenting another client library, doubles them too.
How do Honeycomb limits, bursts and throttling work?
Free and Pro plans have monthly limits for events and data points. Usage follows the calendar month, not your billing date, and Honeycomb sets a daily target of the monthly limit divided by 30.4. For a 50 million event plan, that is about 1.6 million events a day.
Burst protection covers short spikes. If a day’s events exceed twice the daily target, the excess isn’t counted against your monthly limit. It can trigger up to three times a calendar month, separately for events and data points, and the burst data is still ingested and stored.
Going over the limit follows a set sequence on Free and Pro:
- The first month over the limit brings a warning and an email at the start of the next month.
- A second consecutive month over brings a 10-day warning before throttling.
- Throttled, the Event API accepts one of every ten events and rejects the other nine, which are not ingested or stored.
- Throttling lifts only after incoming events and data points both stay under their daily targets for at least 72 hours.
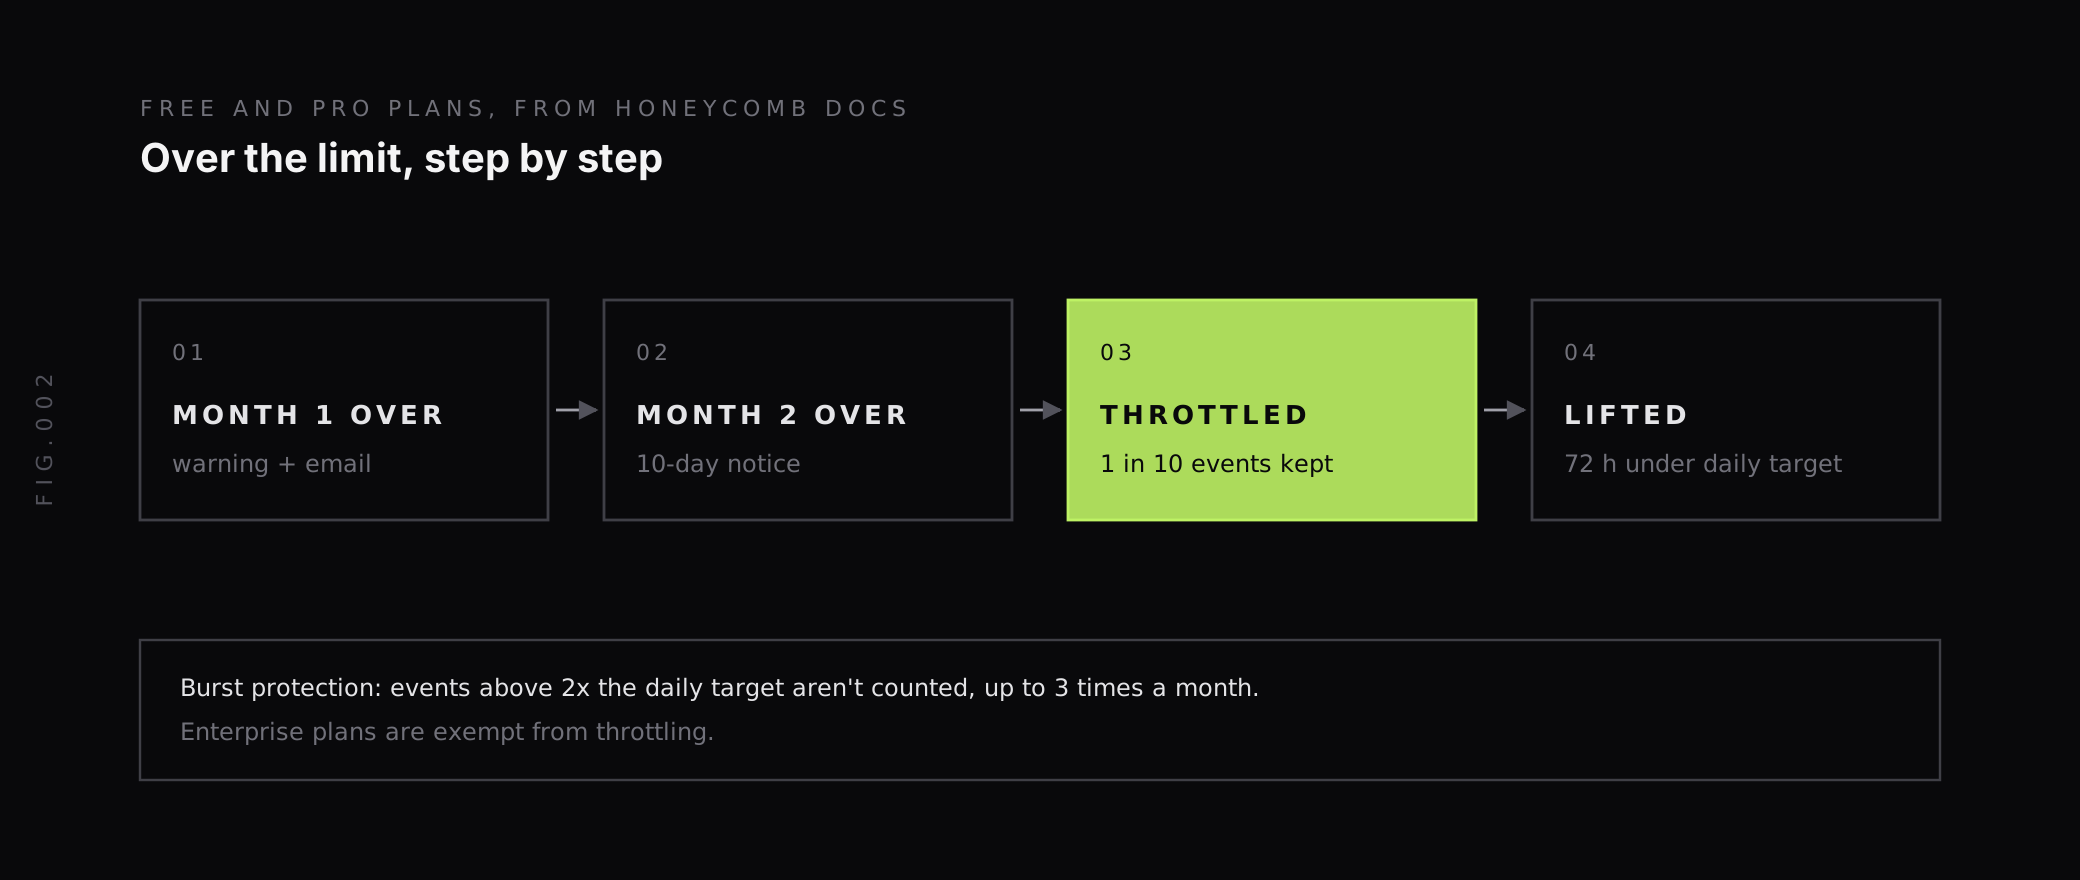
Enterprise plans are exempt from throttling.
How can you reduce your Honeycomb bill?
Most Honeycomb savings come from sending fewer events without losing the ones you need.
Sample with Refinery. Refinery is Honeycomb’s open source, Apache 2.0 licensed tail-based sampling proxy. It looks at whole traces before deciding, so it can keep every trace with an error and a fraction of the rest.
Events sampled out before they reach Honeycomb don’t count against your limit, and Honeycomb weights query results by sample rate so counts still reflect real traffic. The trade-off is that you run Refinery yourself, and every span of a trace has to reach it before it can decide.
Trim span depth. Look at which instrumentation libraries add spans you never query, such as per-call spans for a fast cache, and turn them off or collapse them.
Send infrastructure metrics as time series metrics. Since July 2026, Pro includes time series metrics with their own data point allotment. Sending host and container metrics there keeps them out of your event count.
Reduce metric attributes. If you do send events-based metrics, batch OTLP requests and drop or change high-cardinality attributes with the OpenTelemetry Collector’s Filter and Metrics Transform processors, as Honeycomb’s docs recommend.
Watch the daily target. A dashboard of events per day against the daily target warns you weeks before the second over-limit month that triggers throttling.
How do you keep trace volume and cost under control?
Event-based pricing ties the bill to how much detail you keep. Sampling solves that for traces, but it also means the traces you dropped aren’t there when an unusual request needs investigating.
At Last9, we take OpenTelemetry traces, metrics and logs, keep high-cardinality labels with no sampling, and handle 20M series per metric per day by default.
Our Control Plane lets you drop, remap, redact, forward and aggregate metrics, logs and traces at ingest, so you decide what to keep with rules you control rather than by tier limits. Because the data arrives over OpenTelemetry, the same instrumentation works with either backend, and our guide to tracing tools for observability covers what to look for.
Honeycomb’s strength is fast, ad hoc exploration of high-cardinality event data, with BubbleUp to find what sets slow or failing requests apart. If you’re comparing it with other vendors, see our breakdowns of Datadog pricing, New Relic pricing, Grafana Cloud pricing and Dynatrace pricing.
Budget for spans per request, not seats
Honeycomb’s pricing is simple to read: unlimited seats, a monthly event allotment, and a published starting price for Pro. The part that needs care is the unit. Every span is an event, so request rate multiplied by trace depth sets your tier, and the 2026 Pro rate of $3.00 per million events makes that multiplication more expensive than it was.
Before choosing a tier, estimate events from your request rate and average spans per trace, decide on a sampling policy, and move infrastructure metrics to time series metrics. If you want to keep full-fidelity telemetry and control volume at ingest instead, Last9 takes the same OpenTelemetry data.
FAQ
How much does Honeycomb cost?
Honeycomb has three plans. Free includes up to 20 million events and 100 million metrics data points a month. Pro starts at $150 a month for 50 million events and scales up to 750 million events a month, at $3.00 per million events since July 2026. Enterprise is custom priced, starting from a base allowance of 10 billion events a year.
Is Honeycomb free?
Yes, Honeycomb has a Free plan that its pricing page calls free forever. It includes up to 20 million events and 100 million metrics data points a month, distributed tracing, BubbleUp, OpenTelemetry support and 2 triggers. It doesn’t include SLOs or the Service Map. Teams that need more events, more triggers or SLOs move to Pro or Enterprise.
What counts as an event in Honeycomb?
An event is one unit of work sent to Honeycomb. For traces, every span counts as an event, including OpenTelemetry span events and span links, so a trace with 150 spans counts as 150 events. Logs are stored as events and count against the same monthly allotment. Time series metrics are counted separately, as data points.
What happens if you go over your Honeycomb event limit?
On Free and Pro, the first month over the limit brings a warning. A second consecutive month over brings a 10-day notice, after which Honeycomb throttles ingest by accepting one of every ten events and rejecting the rest. Throttling lifts after incoming events and data points both stay under their daily targets for at least 72 hours. Enterprise plans are exempt from throttling.
What changed in Honeycomb Pro pricing in 2026?
From July 1, 2026, Honeycomb Pro is priced at $3.00 per million events, compared with $1.30 per million on legacy plans, and has four event tiers instead of three, topping out at 750 million events a month. Pro now includes time series metrics. Legacy Pro plans can stay as they are until December 31, 2026.
Does sampling reduce Honeycomb costs?
Yes. Events that are sampled out before they reach Honeycomb don’t count against your monthly event limit. Honeycomb’s open source Refinery proxy does tail-based sampling, so it can keep every trace with an error and a small share of successful ones. Honeycomb weights query results by sample rate, so counts and averages still reflect real traffic.


