


Most PHP performance problems trace back to one of three places: the PHP-FPM process pool running out of workers, OPcache not actually caching what you think it is, or a single slow database call or external API request blocking a whole worker process. None of these show up clearly in a generic “response time went up” alert.
This guide covers what to actually watch for each of the three, using PHP’s own built-in status endpoints, before reaching for a third-party tool.
If you’re choosing between APM vendors, Last9’s roundup of PHP APM tools compares them directly. If you’re setting up OpenTelemetry instrumentation specifically, the step-by-step OpenTelemetry PHP guide covers that. This piece is about what to look at once something is already instrumented, or before you instrument anything at all.
What actually causes most PHP performance problems in production?
Three failure modes account for the large majority of PHP slowdowns that show up as “the site got slow” reports.
PHP-FPM runs out of worker processes. Each PHP-FPM pool has a fixed or dynamically capped number of worker processes. When every worker is busy handling a request, and particularly when one of those requests is itself stuck waiting on something slow, new requests queue up instead of running immediately.
From the outside this looks like the whole application getting slow at once, even though most requests were never actually doing anything wrong. They were just waiting in line.
OPcache isn’t caching what you expect. PHP compiles source files into opcode before running them, and OPcache exists specifically to skip that recompilation on every request. When OPcache is disabled, too small to hold the whole codebase, or restarting under memory pressure, PHP pays the full compilation cost repeatedly instead of once.
Timestamp validation is a separate and much smaller cost: it adds a filesystem check per file, but an unchanged file is still served from the cache rather than recompiled.
This is invisible in application code. Nothing in your codebase looks wrong. The cost is sitting entirely in PHP’s own execution layer.
A single blocking call holds a worker hostage. A slow database query, an external API call without a timeout, or a synchronous file operation ties up one PHP-FPM worker for the full duration of that call.
One slow dependency doesn’t just slow down the request that triggered it. It reduces your available worker capacity for every other request arriving at the same time, which is how one bad database query can look like a site-wide outage under load.
What should you watch on the PHP-FPM status page?
PHP-FPM exposes a built-in status page (pm.status_path in your pool config, commonly served at a path like /fpm-status), and it answers the process-starvation question directly without needing any third-party agent. A handful of its fields matter more than the rest:
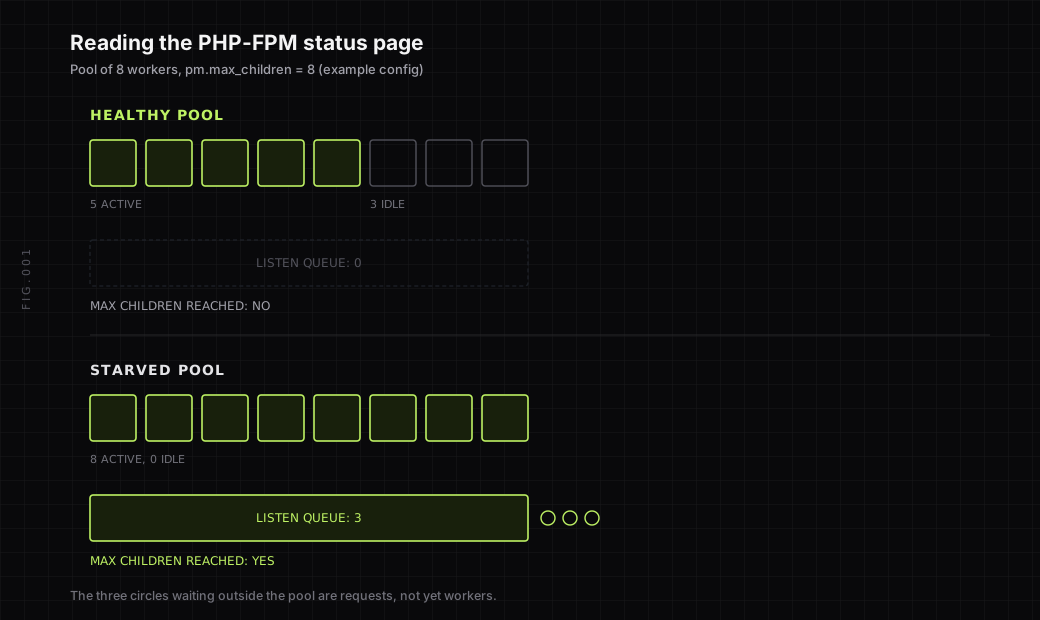
- listen queue: requests currently waiting for a free worker. This should sit at zero most of the time. Any sustained value above zero means requests are queuing, not just running slowly.
- max children reached: whether the pool ever hit its configured worker limit. If this is climbing, your
pm.max_childrensetting is too low for your actual traffic and concurrency, or something upstream is holding workers longer than it should. - slow requests: a running count of requests that exceeded
request_slowlog_timeout, PHP-FPM’s own built-in slow-request logging. This is often the fastest way to find the specific blocking call described above, since FPM logs a full backtrace of exactly where that request was stuck. The backtraces only land somewhere if you also setslowlogto a file path;request_slowlog_timeouton its own sets the threshold and nothing else. - active processes vs total processes: how close the pool is running to its ceiling right now, not just historically.
All three settings live in the pool file, usually /etc/php/8.3/fpm/pool.d/www.conf:
; expose the status pagepm.status_path = /fpm-status
; log a backtrace for any request over 5 secondsrequest_slowlog_timeout = 5sslowlog = /var/log/php-fpm/www-slow.log
Reload FPM, then read the page. The json and full query parameters are the useful pair: json for a machine-readable pool summary, full to add a per-process breakdown.
# pool-level counterscurl -s 'http://127.0.0.1/fpm-status?json' | jq '{ "listen queue": ."listen queue", "active processes": ."active processes", "max children reached": ."max children reached", "slow requests": ."slow requests"}'{ "listen queue": 0, "active processes": 3, "max children reached": 0, "slow requests": 0}A non-zero listen queue or a climbing max children reached in that output is worker starvation, and no further tooling is needed to see it. Setting pm.status_path and checking it costs nothing extra, since it’s built into PHP-FPM itself, and it’s the fastest way to confirm or rule out worker starvation before looking anywhere else.
How do you know if OPcache is actually helping?
opcache_get_status() returns the real numbers directly from PHP, most usefully a hit rate and a breakdown of memory usage. A healthy setup looks different from a starving one in a few specific ways, not just a single “OPcache is on” checkbox.
The function returns false when OPcache is disabled, so check that before reading any field. Pass false to skip the per-script list, which is large on a real codebase:
<?php$status = opcache_get_status(false);
if ($status === false) {    exit("OPcache is not enabled\n");}
$stats = $status['opcache_statistics'];
echo json_encode([    'hit_rate'        => round($stats['opcache_hit_rate'], 2),    'cache_full'      => $status['cache_full'],    'wasted_percent'  => round($status['memory_usage']['current_wasted_percentage'], 2),    'cached_keys'     => $stats['num_cached_keys'] . '/' . $stats['max_cached_keys'],    'restart_pending' => $status['restart_pending'],    'oom_restarts'    => $stats['oom_restarts'],    'hash_restarts'   => $stats['hash_restarts'],    'manual_restarts' => $stats['manual_restarts'],], JSON_PRETTY_PRINT), "\n";
Run it through a request rather than the CLI, since the CLI process has its own cache and will report an almost empty one.
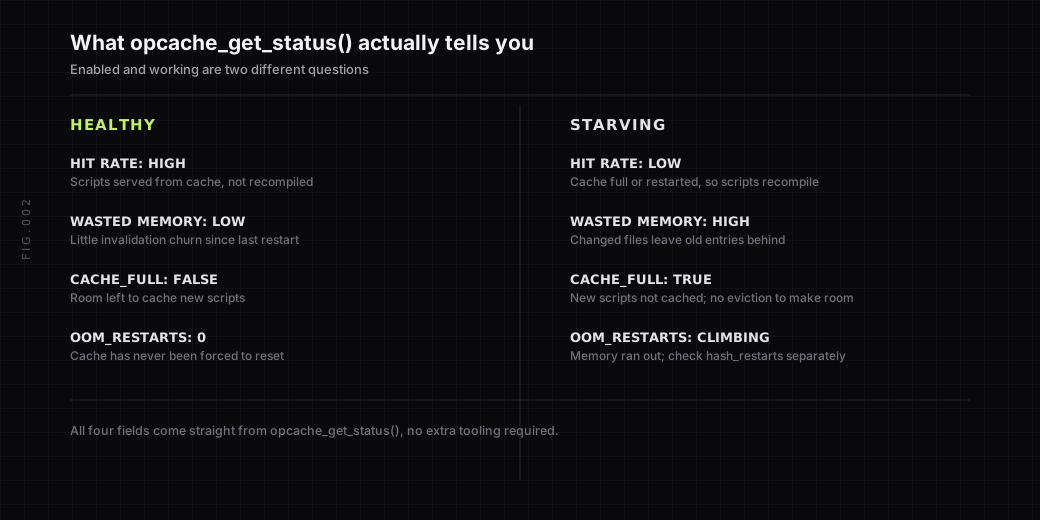
The same comparison in fields you can read off that output:
| Field | Healthy | Starving | What the bad value points at |
|---|---|---|---|
opcache_hit_rate | High and flat | Low, or falling | Cache full, a restart, or a pool still warming up |
cache_full | false | true | memory_consumption or max_accelerated_files too small |
current_wasted_percentage | Low | High | Invalidation churn from deploys, not sizing alone |
num_cached_keys / max_cached_keys | Room left | At the ceiling | max_accelerated_files too low |
oom_restarts / hash_restarts | 0 | Climbing | Memory exhausted, or the script table filled |
The fields it reports are worth reading individually rather than as one health score, because they fail for different reasons.
A low hit rate means scripts are being compiled instead of read back from the cache, and the usual causes are that the cache can’t hold them or has recently been thrown away: cache_full is true, a restart counter is climbing, or the pool was reloaded a moment ago and is still warming up.
The rate is cumulative since the cache last started, so a dip straight after a deploy is expected rather than a misconfiguration.
Timestamp validation is not on that list, which is worth being precise about. With opcache.validate_timestamps enabled, OPcache checks whether a file has changed before reusing its cached opcode, and an unchanged file is still a hit. opcache.revalidate_freq controls how often that check runs, with 0 meaning every request.
What frequent revalidation costs you is a filesystem stat per included file, which is worth tuning on a network filesystem, but it isn’t what drives misses.
A cache_full flag set to true has two distinct causes, and opcache_get_status() tells them apart: either shared memory is exhausted, which points at opcache.memory_consumption, or the table of cached scripts is full, which points at opcache.max_accelerated_files. Compare num_cached_keys against max_cached_keys to see which one you’ve hit.
Either way, OPcache doesn’t evict old entries to make room, so once it’s full, new scripts simply aren’t cached and are recompiled on every request.
A high wasted memory percentage is usually churn rather than sizing. OPcache can’t reclaim an individual entry when a file changes, so every deploy leaves the previous version behind as wasted space. Small amounts are normal, and waste on its own doesn’t reset anything.
opcache.max_wasted_percentage is a gate rather than a trigger: OPcache only considers a restart once it has actually run out of room, either a failed shared-memory allocation or a full script table, and the threshold then decides whether that failure escalates into a full restart. A cache with ample free memory can sit above the threshold indefinitely.
Confirm a real restart from restart_pending and the restart counters rather than inferring one from the waste percentage.
The restart counters each point somewhere specific: oom_restarts means memory ran out, hash_restarts means opcache.max_accelerated_files is too low for the number of files, and manual_restarts means something in your own deploy path called opcache_reset().
If you do switch opcache.validate_timestamps off, which is a reasonable production setting, the trade-off is that PHP stops noticing changed files at all. Deploys then have to invalidate the cache explicitly, by calling opcache_reset() or reloading PHP-FPM as part of the release, or the old code keeps serving.
None of these require a third-party tool to check. They’re a PHP function call away, which makes them a reasonable first stop before assuming a slowdown needs a bigger infrastructure fix.
How do you find the specific request that’s actually slow?
The FPM status page and OPcache stats tell you whether the platform layer is healthy. They don’t tell you which specific code path, query, or external call is eating the time inside an individual request. That’s what distributed tracing is for: following one request through every function call, database query, and outbound HTTP call it makes, with the actual time each step took.
This is where OpenTelemetry’s PHP instrumentation becomes useful rather than optional. Last9’s OpenTelemetry PHP guide walks through setting up auto-instrumentation and connecting it to an observability backend, which turns “the checkout page is slow” into “80% of that request’s time is one uncached database query,” without guessing.
What should you actually alert on?
Not every one of these numbers needs its own page. A small, specific set catches the real failure modes above before they turn into an outage:
- FPM listen queue sustained above zero for more than a minute or two
- Active processes staying near
pm.max_childrenfor a sustained period, not just a brief spike - A rising count of FPM slow requests, since this is a leading indicator, not just a symptom
- OPcache hit rate dropping or
cache_fullflipping true - p95 and p99 response time, not just the average, since a slow-worker problem often hides inside the tail rather than moving the mean
Conclusion: check the platform before you chase the code
A surprising share of “PHP is slow” investigations turn out to be a PHP-FPM pool running out of workers or an OPcache configuration quietly recompiling files it should have cached, both of which are visible from PHP’s own built-in status tools without installing anything.
Check those two first. If they’re both healthy and a specific request is still slow, that’s when distributed tracing earns its keep, by showing exactly which call inside that request is actually taking the time.
That’s the point where the two layers need to sit side by side: the FPM and OPcache numbers telling you whether the platform has capacity, and a trace telling you where a single request spent its time.
Last9’s Traces module accepts OpenTelemetry data from PHP auto-instrumentation and correlates those spans with the metrics and logs from the same request, so “the pool ran out of workers” and “this query held the worker for four seconds” show up as one story rather than two dashboards you compare by hand.
FAQ
What is the PHP-FPM status page and how do I enable it?
The PHP-FPM status page is a built-in monitoring endpoint you enable by setting pm.status_path in your FPM pool configuration file, commonly to a path like /fpm-status. Once enabled and exposed through your web server config, it reports pool-level metrics like active and idle process counts, the listen queue, and a slow-request counter, in HTML, JSON, XML, or (on PHP 8.1 and later) OpenMetrics format depending on the query parameter used.
Why is my PHP application slow even though CPU usage looks normal?
Low CPU usage alongside a slow application is a strong signal that requests are waiting rather than computing, most often because PHP-FPM has run out of available worker processes and new requests are sitting in the listen queue. A worker blocked on a slow database query or an external API call without a timeout doesn’t use CPU while it waits, but it does hold a process that another request needs.
Does enabling OPcache automatically fix PHP performance?
Enabling OPcache helps, but the sizing matters as much as whether it’s on. If opcache.memory_consumption or opcache.max_accelerated_files is too small for your codebase, the cache fills up, and because OPcache doesn’t evict entries to make room, new scripts stop being cached at all and get recompiled on every request. Timestamp validation is a different and much smaller cost: with opcache.validate_timestamps on, OPcache checks whether a file changed, and an unchanged file is still served from the cache rather than recompiled. Checking the actual hit rate, cache_full, and restart counters from opcache_get_status() is the only way to confirm it’s working as intended, rather than assuming from the on/off setting alone.
What’s the difference between PHP-FPM’s slow request log and general error logs?
PHP-FPM’s slow request log needs two pool directives: request_slowlog_timeout sets the threshold, and slowlog sets the file the backtraces are written to. Set only the timeout and no backtrace file appears. With both set, FPM captures requests that took longer than the threshold and logs a full backtrace of where that request was at the timeout. General PHP error logs capture actual errors, warnings, and notices raised by the application code itself. A request can be slow without ever throwing an error, which is exactly the case the slow request log is built to catch.
Do I need APM software to monitor a PHP application, or are PHP’s built-in tools enough?
PHP’s built-in tools, the FPM status page and opcache_get_status(), are enough to catch the two most common platform-level problems: worker starvation and opcode cache misconfiguration. They can’t show you which specific line of code or query inside a single request is slow, which is what distributed tracing and APM tooling are built for. Most teams end up using both: the built-in status endpoints as a fast first check, and tracing for the harder per-request investigations.


