


High Cardinality in ClickHouse at Scale: What Actually Breaks
ClickHouse swallows high-cardinality telemetry at ingest, then breaks at query time weeks later. Here is what fails, and how we keep it fast in production.
Prathamesh Sonpatki

ClickHouse LowCardinality: When It Helps and When It Hurts
ClickHouse LowCardinality cuts storage and speeds up queries on low-cardinality columns, but backfires on trace IDs. How to tell the difference.
Prathamesh Sonpatki

Zero-Code OpenTelemetry for Vert.x
Drop a JAR on the JVM. Get distributed tracing, RxJava context propagation, log-trace correlation, and Vert.x internal metrics. No code changes. No Maven dependency. Java 8–21. Inside the design of last9/vertx-opentelemetry v2.3.4.
Prathamesh Sonpatki

Kubernetes Monitoring Tools: What Actually Works at Scale
What actually works for Kubernetes monitoring at scale — not what looks good in a vendor demo with a five-pod cluster.
Faiz Shaikh

Stop ECS Containers From Collapsing Into One Service in OpenTelemetry
Why ECS containers collapse under service.name = aws_ecs and how to fix it for both EC2 launch type and Fargate, including the resource-vs-log-record pitfall that quietly breaks log filtering.
Prathamesh Sonpatki

End-to-End Trace Propagation Across SQS and Lambda with OpenTelemetry
SQS doesn't propagate trace context automatically. You instrument both sides, deploy, and get two disconnected traces. This post shows how to wire them into one waterfall — and the ESM format gotcha that silently breaks it every time.
Prathamesh Sonpatki
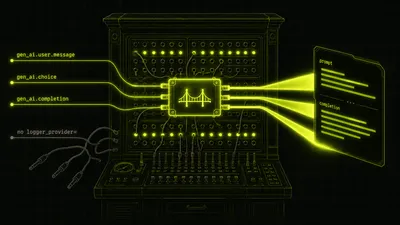
last9-genai: Closing the Conversation Gap in LLM Observability
OpenTelemetry's GenAI instrumentation gives you spans and token counts. It does not give you conversations, workflow cost rollups, or prompts visible in your dashboard. last9-genai is an OTel extension that fills those three gaps — without replacing your existing observability stack.
Prathamesh Sonpatki

How to Exclude Health Check Endpoints from Python OTel Traces
Health check endpoints generate thousands of identical, useless spans per day. Here are two production-ready approaches to filter them from your Python OTel traces — and the correctness trap most implementations miss.
Prathamesh Sonpatki

Argo Rollouts Canary Monitoring: Metrics, Gotchas, and Automated Gates with Last9
Argo Rollouts exposes Prometheus metrics on port 8090 — but the docs lie about which labels exist. Here's how to scrape them into Last9, build a canary dashboard, and use Last9 as an automated AnalysisTemplate gate, including the auth and base64 gotchas.
Prathamesh Sonpatki
What is AI SRE? The Complete Guide to AI-Assisted Site Reliability Engineering
It's 2:47 AM. PagerDuty fires. You open a Slack alert and see: p99 latency spike on checkout-service. You SSH into the host, check dashboards in four tabs, grep logs for the last 20 minutes, and eventually find a slow query introduced in a deploy six hours ago. It took 34 minutes. You resolved it, w
Prathamesh Sonpatki
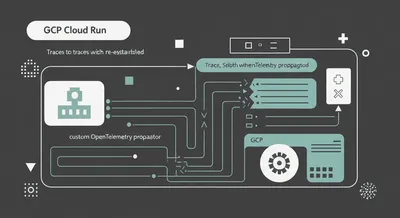
Fixing Broken Traces in GCP Cloud Run: A Custom OpenTelemetry Propagator
GCP's load balancer silently rewrites your traceparent header, orphaning spans in any OTLP backend. Here's the custom propagator that fixes it.
Prathamesh Sonpatki

Why Your PromQL Availability Query Returns Nothing When Services Are Healthy
Your SLI query shows 100% availability as No Data. Here's why PromQL returns empty results instead of zero — and the label-preserving fix.
Prathamesh Sonpatki

Instrumenting WordPress with OpenTelemetry: PHP Tracing, Browser RUM, and Error Capture in Production
WordPress powers 40% of the web but has no native observability story. Here's how to instrument it end-to-end with OpenTelemetry - PHP, browser RUM, and errors.
Prathamesh Sonpatki

Logs vs Metrics: A Practical Guide for Engineers
Metrics tell you something is wrong. Logs tell you what is wrong. A practical guide on when to use each for effective observability.
Mukta Aphale

Log Analytics: How to Turn Raw Logs Into Actionable Insights
The difference between storing logs and actually learning from them — querying, pattern detection, anomaly analysis, and choosing the right log analytics tool.
Tripad Mishra

How to Handle Cloud Monitoring Overload?
Learn how to reduce cloud monitoring overload without dropping critical signals or blowing up observability costs.
Anjali Udasi

Which Observability Tool Helps with Visibility Without Overspend
A detailed look at observability platforms so you can choose tools that keep visibility high and costs steady as your systems scale.
Anjali Udasi

7 Observability Solutions for Full-Fidelity Telemetry
A quick guide to how seven leading observability tools support full-fidelity telemetry and the architectural choices behind them.
Anjali Udasi

Top 7 Observability Platforms That Auto-Discover Services
Auto-discovery tools now detect services as they appear and build dashboards instantly. Here are seven platforms that do it well.
Anjali Udasi

Observability vs. Visibility: What's the Difference?
Understand observability vs visibility: visibility shows current states, while observability uncovers why systems act the way they do.
Faiz Shaikh

What is Asynchronous Job Monitoring?
Know how asynchronous job monitoring tracks background tasks, ensuring they finish reliably, perform well, and stay visible at scale.
Anjali Udasi

Background Job Observability Beyond the Queue
Understand what makes background jobs slow or fail by looking past queue depth to real execution signals.
Anjali Udasi

What is Service Catalog Observability and How Does It Work?
Service catalog observability tracks discovery, adoption, and runtime accuracy, turning catalogs into measurable infrastructure.
Faiz Shaikh

Log Format Standards: JSON, XML, and Key-Value Explained
A practical look at common log format standards, how JSON, XML, and key-value logs work, and when to use each in production systems.
Faiz Shaikh

PostgreSQL Performance Tuning: Cut Query Latency 50-80%
Slow Postgres queries killing your app? Learn proven tuning techniques for indexes, VACUUM, connection pooling, and query optimization. Real fixes that cut latency 50-80%.
Faiz Shaikh

What are Application Metrics?
Application metrics are key performance signals, like latency, error rate, and throughput, that help you understand how your app behaves in production.
Anjali Udasi

Jaeger Monitoring: Essential Metrics and Alerting for Production Tracing Systems
Monitor Jaeger in production with core metrics and alerting rules, track trace completion, queue depth, and storage performance at scale.
Anjali Udasi

Why Your Loki Metrics Are Disappearing (And How to Fix It)
Diagnose missing Loki metrics by fixing recording rule gaps, remote write failures, and high-cardinality issues in production setups.
Faiz Shaikh

Use Telegraf Without the Prometheus Complexity
Collect metrics with Telegraf without running Prometheus. No scraping, no TSDB tuning, just clean, push-based telemetry to your backend.
Anjali Udasi

Ship Confluent Cloud Observability in Minutes
Push metrics into Last9 and start tracking Kafka lag, retries, and throughput in real-time.
Anjali Udasi

Query and Analyze Logs Visually, Without Writing LogQL
Visually build, parse, and analyze logs across services, no LogQL required. Get structured insights faster with Query Builder.
Anjali Udasi

Build Log Automation with Last9's Query API
Here's how you can build automated log analysis workflows with Last9's Query Logs API
Prathamesh Sonpatki

Elasticsearch with Python: A Detailed Guide to Search and Analytics
Know how to use Elasticsearch with Python for indexing, searching, and analyzing data, complete with code, tips, and integration examples.
Anjali Udasi

What is Log Loss and Cross-Entropy
Log loss and cross-entropy are core loss functions for classification tasks, measuring how well predicted probabilities match actual labels.
Faiz Shaikh

Cloud Log Management: A Developer's Guide to Scalable Observability
Centralized logging lets you debug across services without SSH or ad-hoc grep scripts. This is how to set it up so it holds up as you scale.
Anjali Udasi

How to Run Elasticsearch on Kubernetes
Understand how to deploy, scale, and manage Elasticsearch on Kubernetes with the right configs for storage, availability, and performance.
Anjali Udasi

An Easy and Practical Guide to CDN Monitoring
Understand how to monitor your CDN effectively with this easy, practical guide focused on key metrics, common issues, and real-world tips.
Preeti Dewani

JVM Metrics: A Complete Guide for Performance Monitoring
Learn which JVM metrics matter, how to track them, and use that data to troubleshoot and improve Java application performance.
Faiz Shaikh

Solr Key Metrics: The Essential Guide for DevOps & SREs
Track what matters in Solr. This guide covers key Solr metrics every DevOps and SRE team should monitor to keep search performance sharp.
Faiz Shaikh

CloudWatch vs OpenTelemetry: Choosing What Fits Your Stack
CloudWatch vs OpenTelemetry: Understand the trade-offs and choose the observability approach that fits your team's architecture and workflows.
Anjali Udasi

The Complete Guide to Observing RabbitMQ
Learn how to monitor, troubleshoot, and improve RabbitMQ performance with the right metrics, tools, and observability practices.
Faiz Shaikh

SQL Server Observability: Monitoring, Troubleshooting, and Best Practices
Essential techniques for comprehensive SQL Server observability: from setting up monitoring to troubleshooting performance issues and implementing best practices.
Preeti Dewani

Getting Started with Jaeger for Distributed Tracing
Learn how to set up Jaeger for distributed tracing, track requests across services, and troubleshoot issues in modern microservice apps.
Preeti Dewani

Simplifying Container Observability for DevOps Teams
Learn how to simplify container observability for your DevOps team by effectively tracking metrics, logs, and traces to improve performance.
Anjali Udasi

RUM vs Synthetic Monitoring: Understanding the Core Differences
Learn the key differences between RUM and synthetic monitoring, and how each approach helps track performance in real-time and preemptively.
Anjali Udasi

What is API Monitoring and How to Build API Metrics Dashboards
API monitoring helps track performance, uptime, and errors. Learn how to build dashboards that give you real-time insights into API health.
Anjali Udasi

The Ultimate HBase Monitoring Guide for Engineers
Learn how to effectively monitor HBase performance with key metrics, tools, and best practices to ensure your cluster runs smoothly.
Faiz Shaikh

Trace ID vs Correlation ID: Understanding the Key Differences
Learn the difference between Correlation IDs and Trace IDs, and how they help track requests and diagnose issues in distributed systems.
Faiz Shaikh

Traces & Spans: Observability Basics You Should Know
Learn how traces and spans help you see inside distributed systems—so you can troubleshoot faster and build more reliable software.
Anjali Udasi

How to Use MySQL Performance Analyzer
Learn how to optimize MySQL queries and identify bottlenecks with a performance analyzer to keep your database running smoothly.
Anjali Udasi

APM Observability: A Practical Guide for DevOps and SREs
A no-fluff guide to APM observability for DevOps and SREs—tools, tips, and what actually matters when keeping systems healthy.
Anjali Udasi

Observability vs APM: Complete Comparison Guide 2025
Observability goes beyond APM—it's not just about metrics, it's about understanding why things break, not just that they did.
Anjali Udasi

Zero Code Instrumentation: The Missing Link in Observability
Struggling with gaps in your monitoring? Zero code instrumentation fills them by capturing key telemetry without modifying your code.
Anjali Udasi
Observability Pipeline: An Easy-to-Follow Guide for Engineers
Learn how to build and optimize observability pipelines with this easy-to-follow guide designed for engineers.
Anjali Udasi

Your Observability Questions, Answered
Get clear answers to the most common observability questions—tools, best practices, and strategies for better monitoring.
Anjali Udasi
![Full-Stack Observability: What It Is [Minus the Fluff]](/_astro/observability.OKih7oml_26prIw.webp)
Full-Stack Observability: What It Is [Minus the Fluff]
Get a clear, no-nonsense look at full-stack observability—what it is, why it matters, and how it helps you stay on top of your systems.
Anjali Udasi
Less War, More Room: Breaking Down Operational Silos
Our Dev Evangelist, Prathamesh Sonpatki, shared insights on alert fatigue at a ClickHouse meetup—sparking great conversations on observability.
Prathamesh Sonpatki
Sahil Khan

How to Build Observability into Chaos Engineering
Learn how to integrate observability into chaos engineering to better understand system behavior and improve resilience during failures.
Anjali Udasi

Telemetry Data Platform: Everything You Need to Know
Learn how a telemetry data platform helps monitor, analyze, and optimize system performance for complex, scalable environments.
Anjali Udasi
Distributed Tracing 101: Definition, Working and Implementation
Learn the basics of distributed tracing, how it works, and how to implement it for better observability in your microservices architecture.
Anjali Udasi

How Azure Observability Optimizes Performance and Monitoring
Learn how Azure Observability empowers you to monitor, optimize, and enhance the performance of your cloud applications and infrastructure.
Anjali Udasi

What is Single Pane of Glass Monitoring and How It Works
Single pane of glass monitoring provides a unified view of your system's data, making it easier to track performance and troubleshoot issues.
Anjali Udasi

Why Data Observability is Important for Your Business
Learn how data observability helps your business catch issues early, ensuring accurate insights, smarter decisions, and smoother growth.
Anjali Udasi

What Unified Observability Means for Your System
Learn how unified observability helps you track system health, improve performance, and quickly resolve issues across your environment.
Anjali Udasi

Observability Platform Migration: What You Need to Know
Ready to migrate your observability platform? Here’s what you need to know to make the process smooth and set your team up for success.
Anjali Udasi

Kafka Observability: Key to Managing Distributed Systems
Effective Kafka observability is crucial for tracking performance, ensuring reliability, and troubleshooting issues in complex, distributed systems.
Preeti Dewani
eBPF for Enhanced Observability in Modern Systems
eBPF enhances observability by providing deep insights into system performance and security with minimal overhead, ideal for modern, distributed systems.
Anjali Udasi

Optimizing Systems with the Observability Maturity Model
The Observability Maturity Model helps organizations optimize systems by advancing through stages to improve reliability, performance, and troubleshooting.
Anjali Udasi

Why Cloud Security Monitoring is Crucial for Your Business
Cloud security monitoring is essential to protect data, ensure compliance, and safeguard against growing cyber threats in cloud environments.
Anjali Udasi

DNS Monitoring: Everything You Need to Know
DNS monitoring ensures your domain records are accurate, secure, and performing well, helping prevent outages and attacks.
Anjali Udasi
What is LLM Observability? A Complete Guide (with OpenTelemetry)
> LLM observability is the practice of tracking what goes into an LLM, what comes out, and everything in between — latency, token usage, errors, and model behavior — so you can debug, optimize, and trust AI applications in production.
Prathamesh Sonpatki

MongoDB vs Elasticsearch: Key Differences Explained
Learn the key differences between MongoDB and Elasticsearch, and understand when to use each for your database and search needs.
Anjali Udasi

A Beginner's Guide to GCP Monitoring
Learn how to monitor and optimize your GCP resources effortlessly. Simplify performance tracking and keep your services running smoothly.
Prathamesh Sonpatki
Anjali Udasi

Fluentd vs Fluent Bit – A Comprehensive Overview
Fluentd vs Fluent Bit: Discover the key differences, use cases, and how to choose the right tool for your log processing needs.
Prathamesh Sonpatki
Anjali Udasi

Enhancing Observability with Fluent Bit and OpenTelemetry
Boost observability with Fluent Bit and OpenTelemetry! Collect, process, and export logs and metrics easily for smarter monitoring.
Prathamesh Sonpatki

Full-Stack Observability for Better Application Performance
Achieve better application performance with full-stack observability, gaining real-time insights to troubleshoot, optimize, and enhance user experience.
Anjali Udasi

A Complete Guide to Kubernetes Observability
Learn how to implement effective Kubernetes observability with metrics, logs, and traces to monitor and optimize your clusters at scale.
Prathamesh Sonpatki

Your Guide to the 7 Best Tracing Tools in Observability
Discover the top tracing tools in observability to monitor, analyze, and troubleshoot your systems for better performance and reliability.
Anjali Udasi

Proactive Monitoring: What It Is, Why It Matters, & Use Cases
Proactive monitoring helps IT teams spot issues early, ensuring smooth operations, minimal disruptions, and a better user experience.
Anjali Udasi

OpenSearch vs. Elasticsearch: What’s the Real Difference?
OpenSearch and Elasticsearch are both powerful search engines, but OpenSearch offers an open-source alternative with community-driven development.
Anjali Udasi

Why Golden Signals Matter for Monitoring
Golden Signals—latency, traffic, error rate, and saturation—help SRE teams monitor system health and avoid costly performance issues.
Anjali Udasi
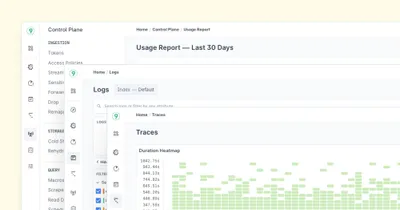
Last9’s Single Pane for High Cardinality Observability
Last9’s Telemetry Warehouse now supports Logs and Traces, offering a unified view for high cardinality observability to simplify monitoring and troubleshooting.
Sahil Khan

How to Cut Down Amazon CloudWatch Costs
Check out these straightforward tips to manage your metrics and logs better. You can keep your monitoring effective while cutting down on costs!
Anjali Udasi

The Ultimate Guide to Application Performance Monitoring (APM)
Learn everything about Application Performance Monitoring (APM), from its definition to its crucial role in optimizing application performance.
Anjali Udasi
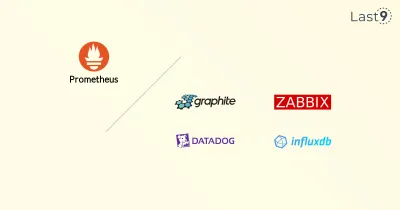
Prometheus Alternatives in 2026: 6 Monitoring Tools Compared
Prometheus is a powerful open-source monitoring tool, but it has real limits at scale. Here is how the top Prometheus alternatives compare: InfluxDB, Zabbix, Datadog, Graphite, Grafana, and Last9, across storage, architecture, APIs, and language support.
Gabriel Diaz

What is Prometheus Remote Write
Explore Prometheus Remote Write: scale your monitoring effortlessly. Learn how it works, its benefits, and top tips for cloud-native setups.
Prathamesh Sonpatki

Streaming Aggregation: Real-Time Data Processing in 2024
We break down the essentials of streaming aggregation and its impact on modern data processing.
Anjali Udasi

kube-state-metrics: Your Guide to Kubernetes Observability
This guide provides an in-depth look at its setup and usage, helping you monitor and manage your Kubernetes clusters more efficiently.
Prathamesh Sonpatki
Anjali Udasi

2024's Best Cloud Monitoring Tools: Updated Insights
Get a detailed look at the top cloud monitoring tools of 2024. Compare leading solutions to understand their features and performance, helping you choose the best fit for your cloud infrastructure.
Anjali Udasi

Top Observability Best Practices for Microservices in 2024
Practical tips for monitoring, analyzing, and improving system performance.
Anjali Udasi

A Deep Dive into Log Aggregation Tools
The guide discusses the essential components, challenges, popular tools, and advanced techniques that define effective log aggregation.
Anjali Udasi

OpenTelemetry vs. Traditional APM Tools
This article explores OpenTelemetry vs. traditional APM tools, comparing their strengths, weaknesses, and use cases to help you choose wisely.
Anjali Udasi

The Anatomy of a Modern Observability System
This article breaks down the fundamentals, from data collection to analysis, to help you gain deeper insights into your applications.
Anjali Udasi

Observability vs. Telemetry vs. Monitoring
Observability is the continuous analysis of operational data, telemetry is the operational data that feeds into that analysis, and monitoring is like a radar for your system observing everything about your system and alerting when necessary.
Anjali Udasi

Think Data Warehouse, NOT Database.
The software monitoring world is broken because of a TSDB. We deserve a TSDW
Aniket Rao

OpenTelemetry Collector: Architecture & How It Works
How the OpenTelemetry Collector works: receivers, processors, exporters, and extensions, how it deploys on Kubernetes, and how to run it locally.
Prathamesh Sonpatki

What needs to change in software monitoring?
A wishlist of things that need to change in the world of software monitoring
Aniket Rao

Everything in software monitoring is dead, apparently
Chasing shiny new toys, as always ;)
Aniket Rao

Why your monitoring costs are high
If you want to bring down your monitoring costs, you need to shake up a decision paralysis in engineering
Aniket Rao
Software Observability from the Lens of Radar and a Black Box
Observability is often a misunderstood and misused term. It has come to mean nothing and everything at this point. Read more on how Observability can be viewed from the lens of a Radar and a Black Box.
Nishant Modak

This arctic winter — time to repay your tech debt
We're in a peak tech winter. What should engineering teams focus on when product velocity dwindles?
Ajey Gore

Understanding the Rasmussen model for failures
What does the Rasmussen model teach us about Site Reliability Engineering?
Nishant Modak

How we tame High Cardinality by Sharding a stream
Using 'Sharding' to tame High Cardinality data for Last9 - Our Time Series Data Warehouse
Piyush Verma

What Site Reliability Engineering Needs: A Swarm of Bees
If all companies are software companies, all companies need better Observability to understand how performative their software is
Aniket Rao

QCon New York 2023 Recap
Recap of QCon New York 2023 Conference
Prathamesh Sonpatki

Observability is a practice, not a job
Engineering organizations that ship fast have Observability as part of their core DNA.
Aniket Rao

Metrics, Events, Logs, and Traces: Observability Essentials
Understanding Metrics, Logs, Events and Traces - the key pillars of observability and their pros and cons for SRE and DevOps teams.
Prathamesh Sonpatki

SRE vs Platform Engineering
What's the difference between SREs and Platform Engineers? How do they differ in their daily tasks?
Last9
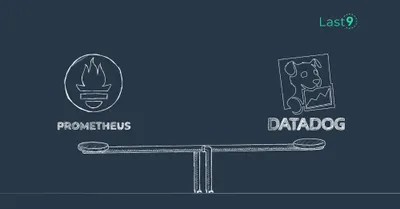
Prometheus vs Datadog: Cost, Scale, and How to Choose
Compare Prometheus and Datadog on cost, scale, integrations, and lock-in: when open-source wins, when managed is worth it, and where Last9 fits.
Last9

SRE vs DevOps: Definition, Key Differences, and Similarities
What's the difference between SREs and DevOps professionals? How do they differ in their daily tasks?
Nishant Modak

Who should define Reliability — Engineering, or Product?
Whoever owns Reliability should define its parameters. But who owns the Reliability of a Product? Engineering? Product Management? Or the Customer success team?
Piyush Verma

What do self-driving cars tell us about Site Reliability Engineering?
From Robocars to Reliability — SRE with self-driving cars; mapping out where the Observability space is in conjunction with self-driving cars
Mohan Dutt Parashar

Observability—OSS vs Paid vs Managed OSS
The Reliability industry needs a managed, non-vendor lock-in answer to spiraling costs, high cardinality and the toil of managing a tsdb
Satyajeet Jadhav

Recap of SRECon Americas 2023
SRECon is a conference hosted by USENIX and is focused on site reliability, distributed systems, and systems engineering at scale. A Recap of SRECon Americas 2023.
Last9

Understanding “Cricket Scale”
How does a DevOps/Site Reliability Engineer plan for "Cricket scale"? How do you warm systems' about to witness 30+ million concurrent users?
Aniket Rao

Reliability Engineering for Dummies: ELI5
Explaining Reliability Engineering to a 5-year-old.
Mohan Dutt Parashar

Rethinking Anomaly Detection: Focus on business outcomes
From the trenches at Games24x7 — Sanjay, on how Reliability engineering should drive core business metrics
Sanjay Singh

Interesting talks on Observability from Fosdem 2023
A recap of the talks from the Observability and Monitoring dev room at Fosdem 2023.
Prathamesh Sonpatki

Observability is dead, long live observability
No tool can magically offer you 99.999s. Observability is largely about the basics. And basics are boring. But, boring is hard. Boring is battle tested.
Aniket Rao

Introducing Levitate: Uplift Your Metrics Management
Managing time series databases is hard. We've evolved to services, yet monitoring lags. Our solution powers critical workloads at a lower cost.
Nishant Modak

Best Practices Using and Writing Prometheus Exporters
This article will go over what Prometheus exporters are, how to properly find and utilize prebuilt exporters, and tips, examples, and considerations when building your own exporters.
Last9
The difference between DevOps, SRE, and Platform Engineering
In reliability engineering, three concepts keep getting talked about - DevOps, SRE and Platform Engineering. How do they differ?
Prathamesh Sonpatki

How to improve Prometheus remote write performance at scale
Deep dive into how to improve the performance of Prometheus Remote Write at Scale based on real-life experiences
Saurabh Hirani

India vs Pakistan: SRE and the Shannon Limit
How does one ‘detect change’ in a complex infrastructure, so you don’t lose out on critical revenues — A short SRE story
Satyajeet Jadhav

Why MTTR should be a ‘business’ metric
A key challenge is aligning engineering health metrics with business goals. How can business measure engineering, and engineering show its value?
Sidu Ponnappa

Sample vs Metrics vs Cardinality
When dealing with Time Series databases, I always got confused with Sample vs Metrics vs Cardinality. Here’s an explanation as I have understood it.
Piyush Verma

Comparing Popular Time Series Databases
A comparison of all the popular time series databases. Prometheus, Influx, M3Db, Last9.
Abhi Puranam

Latency is the new downtime
In the early days of Google, a lot of users were asking for 30 results on the first page of search results. So after long deliberation, Marissa Mayer, then the Product Manager for google.com, decided to run the A/B test for ten vs 30 results. When the results came in, they were in for a surprise.
Sahil Khan
We’ve raised a $11M Series A led by Sequoia Capital India!
Exciting news! We've secured an $11M Series A funding round led by Sequoia Capital India to fuel our growth and innovation at Last9!
Nishant Modak

Why Service Level Objectives?
Understanding how to measure the health of your servcie, benefits of using SLOs, how to set compliances and much more...
Piyush Verma

The origin of Service Level Objectives
Service Level Objectives (SLOs) dominate the software industry, but where did they come from?
Akshay Chugh
Piyush Verma

Doing SRE the Right Way!
A well-thought-out approach to SRE, which will help site reliability engineers and software engineers develop and maintain a useful, consistent, and effective SRE strategy for their products!
Piyush Verma

SLOs eased
You can either love running or hate running, but you will definitely love this analogy - take a fresh look at SLOs!
Piyush Verma
Saurabh Hirani

Latency SLO
How do you set latency-based alerts? A common approach is 95% of requests completed in 350ms, but is it really that simple?
Piyush Verma
Services; not Server
Gone are the days of yore when we named are our servers Etsy, Betsy, and Momo, fed them fish, and cleaned their poop.
Nishant Modak
Piyush Verma

Systems Observability
Observability is not just about being able to ask questions to your systems. It's also about getting those answers in minutes and not hours.
Nishant Modak
Piyush Verma