


Logs vs Metrics: A Practical Guide for Engineers
Metrics tell you something is wrong. Logs tell you what is wrong. A practical guide on when to use each for effective observability.
Mukta Aphale

How to Handle Cloud Monitoring Overload?
Learn how to reduce cloud monitoring overload without dropping critical signals or blowing up observability costs.
Anjali Udasi

What is Asynchronous Job Monitoring?
Know how asynchronous job monitoring tracks background tasks, ensuring they finish reliably, perform well, and stay visible at scale.
Anjali Udasi

A Practical Guide to Python Application Performance Monitoring(APM)
Monitor, debug, and optimize Python apps in production with APM—track transactions, DB queries, errors, and external calls.
Anjali Udasi

What is Database Monitoring
Database monitoring tracks performance, health, and availability, helping detect issues early and maintain optimal operations.
Anjali Udasi

A Detailed Guide to Azure Kubernetes Service Monitoring
Track the right AKS metrics, integrate with Azure Monitor, and optimize dashboards for reliable, cost-efficient Kubernetes operations.
Faiz Shaikh

Top 13 Application Performance Monitoring Tools
Discover 7 reliable APM tools that help you monitor performance, spot issues early, and keep your applications running without surprises.
Anjali Udasi

PostgreSQL Performance Tuning: Cut Query Latency 50-80%
Slow Postgres queries killing your app? Learn proven tuning techniques for indexes, VACUUM, connection pooling, and query optimization. Real fixes that cut latency 50-80%.
Faiz Shaikh

What are Application Metrics?
Application metrics are key performance signals, like latency, error rate, and throughput, that help you understand how your app behaves in production.
Anjali Udasi

Jaeger Monitoring: Essential Metrics and Alerting for Production Tracing Systems
Monitor Jaeger in production with core metrics and alerting rules, track trace completion, queue depth, and storage performance at scale.
Anjali Udasi

How to Set Up Real User Monitoring
Set up Real User Monitoring (RUM) with safe defaults, proper sampling, and consent handling,without breaking your production code.
Anjali Udasi

Elasticsearch with Python: A Detailed Guide to Search and Analytics
Know how to use Elasticsearch with Python for indexing, searching, and analyzing data, complete with code, tips, and integration examples.
Anjali Udasi

Cloud Log Management: A Developer's Guide to Scalable Observability
Centralized logging helps you debug faster, scale smarter, and cut through noise. Here's how to get it right from the start.
Anjali Udasi

Amazon SQS Metrics: Monitor, Debug, and Optimize Your Message Queues
Get visibility into your SQS queues with key CloudWatch metrics, custom insights, and alerting strategies for smooth, reliable processing.
Anjali Udasi

11 Best Log Monitoring Tools for Developers in 2025
A technical comparison of 11 log monitoring tools developers use in 2025—features, trade-offs, pricing, and platform compatibility
Anjali Udasi

An Easy Guide to Getting Started with Elastic APM
Learn how to set up Elastic APM, track what your app’s doing in production, and catch slowdowns before your users do.
Faiz Shaikh

How to Monitor Kafka Producer Metrics
Monitor critical Kafka producer metrics like record-send-rate, error-rate, and buffer-available-bytes to troubleshoot performance issues in production.
Anjali Udasi

Jaeger vs Zipkin: Which is Right for Your Distributed Tracing
Compare Jaeger and Zipkin to find the best fit for your distributed tracing needs, infrastructure, and observability goals.
Anjali Udasi

An Easy and Practical Guide to CDN Monitoring
Understand how to monitor your CDN effectively with this easy, practical guide focused on key metrics, common issues, and real-world tips.
Preeti Dewani

Monitoring Node.js: Key Metrics You Should Track
Understand which metrics matter in Node.js applications, why they’re important, and how to track them effectively in production.
Faiz Shaikh

JVM Metrics: A Complete Guide for Performance Monitoring
Learn which JVM metrics matter, how to track them, and use that data to troubleshoot and improve Java application performance.
Faiz Shaikh

Solr Key Metrics: The Essential Guide for DevOps & SREs
Track what matters in Solr. This guide covers key Solr metrics every DevOps and SRE team should monitor to keep search performance sharp.
Faiz Shaikh

CloudWatch vs OpenTelemetry: Choosing What Fits Your Stack
CloudWatch vs OpenTelemetry: Understand the trade-offs and choose the observability approach that fits your team's architecture and workflows.
Anjali Udasi

Track MongoDB Performance Metrics Without the Noise
Learn which MongoDB performance metrics matter most, how to track them, and avoid the noise that clutters your monitoring setup.
Anjali Udasi

The Complete Guide to Observing RabbitMQ
Learn how to monitor, troubleshoot, and improve RabbitMQ performance with the right metrics, tools, and observability practices.
Faiz Shaikh

Essential Python Monitoring Techniques You Need to Know
Learn the key techniques to monitor Python performance, catch bottlenecks early, and keep your applications fast and reliable at scale.
Anjali Udasi

Getting Started with Jaeger for Distributed Tracing
Learn how to set up Jaeger for distributed tracing, track requests across services, and troubleshoot issues in modern microservice apps.
Preeti Dewani

A Practical Guide to Monitoring Ubuntu Servers
Learn how to set up effective monitoring for your Ubuntu servers, from basic to advanced strategies, to keep your systems running smoothly.
Anjali Udasi

Apache Tomcat Performance Monitoring: Basics and Troubleshooting Tips
Learn how to monitor Apache Tomcat performance, troubleshoot common issues, and optimize your server for better reliability and efficiency.
Faiz Shaikh

RUM vs Synthetic Monitoring: Understanding the Core Differences
Learn the key differences between RUM and synthetic monitoring, and how each approach helps track performance in real-time and preemptively.
Anjali Udasi

What is API Monitoring and How to Build API Metrics Dashboards
API monitoring helps track performance, uptime, and errors. Learn how to build dashboards that give you real-time insights into API health.
Anjali Udasi

The Ultimate HBase Monitoring Guide for Engineers
Learn how to effectively monitor HBase performance with key metrics, tools, and best practices to ensure your cluster runs smoothly.
Faiz Shaikh

Trace ID vs Correlation ID: Understanding the Key Differences
Learn the difference between Correlation IDs and Trace IDs, and how they help track requests and diagnose issues in distributed systems.
Faiz Shaikh

Why Should You Care About Endpoint Monitoring?
Understand why endpoint monitoring is crucial for tracking and securing key touchpoints between services, users, and security defenses.
Anjali Udasi

Metrics Monitoring: The Only Guide You'll Need
Everything you need to know about metrics monitoring—what they are, why they matter, and how to use them to keep your systems healthy.
Faiz Shaikh

Traces & Spans: Observability Basics You Should Know
Learn how traces and spans help you see inside distributed systems—so you can troubleshoot faster and build more reliable software.
Anjali Udasi

Distributed Network Monitoring: Guide to Getting Started & Troubleshooting
A practical guide to getting started with distributed network monitoring and solving common issues across modern, complex systems.
Anjali Udasi

How to Use MySQL Performance Analyzer
Learn how to optimize MySQL queries and identify bottlenecks with a performance analyzer to keep your database running smoothly.
Anjali Udasi

Apache Cassandra Monitoring: Tools, Challenges & Best Practices
A quick guide to monitoring Apache Cassandra—tools that help, challenges to watch for, and tips to keep things running smoothly.
Anjali Udasi

Everything You Need to Know to Start Monitoring Postgres
Learn the essentials of Postgres monitoring, from key metrics to best practices, and ensure your database stays healthy in production environments.
Faiz Shaikh

Database Monitoring Metrics: Each Stage Guide (2025)
Not all database metrics are created equal. Learn which ones to track, why they matter, and how they help you stay ahead of performance issues.
Faiz Shaikh

Logging vs Monitoring: What’s the Real Difference?
Logging and monitoring work together, but they’re not the same. Here’s how they help you understand, fix, and improve your systems.
Anjali Udasi

Observability vs APM: Complete Comparison Guide 2025
Observability goes beyond APM—it's not just about metrics, it's about understanding why things break, not just that they did.
Anjali Udasi

API Latency: Definition, Measurement, and Optimization Techniques
Learn what API latency really means, how to measure it the right way, and practical ways to make your APIs respond faster.
Anjali Udasi

The Ultimate Guide to Ubuntu Performance Monitoring
A practical guide to monitoring performance on Ubuntu—tools, tips, and commands to keep your system running efficiently.
Faiz Shaikh

Why Do You Need a Redis Monitor in Place?
A Redis monitor helps track performance, spot memory issues, and prevent unexpected failures—ensuring stability before problems escalate.
Prathamesh Sonpatki

9 Best Container Monitoring Tools You Should Know in 2025
Discover the 9 best container monitoring tools of 2025—optimize performance, track issues, and keep your infrastructure running smoothly!
Anjali Udasi

Top 7 Microservices Monitoring Tools to Consider in 2025
Get the right tools to monitor your microservices in 2025. Track performance, detect issues, and keep your systems running smoothly.
Anjali Udasi

End-to-End Monitoring: Your Guide to System Visibility
Get full visibility into your system with end-to-end monitoring. Understand issues faster and keep your applications running smoothly.
Faiz Shaikh

An In-Depth Metricbeat Guide for DevOps Teams
Learn how to set up, configure, and optimize Metricbeat for system monitoring. A must-read guide for DevOps teams looking to streamline observability.
Preeti Dewani

No-Jargon Guide to Application Dependency Mapping
Cut through the complexity! This no-jargon guide simplifies application dependency mapping for better system clarity and reliability.
Faiz Shaikh
![Full-Stack Observability: What It Is [Minus the Fluff]](https://last9.ghost.io/content/images/2025/03/observability.webp)
Full-Stack Observability: What It Is [Minus the Fluff]
Get a clear, no-nonsense look at full-stack observability—what it is, why it matters, and how it helps you stay on top of your systems.
Anjali Udasi

How Do Dropwizard Metrics Help Monitor Application Performance?
Learn how Dropwizard Metrics tracks performance, latency, and system health, helping you monitor and optimize your applications effectively.
Anjali Udasi

Why Server Health Monitoring Matters (And How to Do It Right)
Monitoring server health helps prevent downtime, spot issues early, and keep systems running smoothly. Here’s how to do it the right way.
Anjali Udasi

EC2 Monitoring: A Practical Guide for AWS Engineers
Learn how to monitor EC2 instances effectively, reduce costs, and prevent outages with practical insights for AWS engineers.
Anjali Udasi

How to Effectively Monitor Nginx and Prevent Downtime
Learn how to monitor Nginx effectively, track key metrics, analyze logs, and prevent downtime with the right tools and best practices.
Anjali Udasi

How to Use OpenSearch with Python for Search and Analytics
Learn how to set up, index data, run queries, and secure OpenSearch with Python for efficient search and analytics.
Preeti Dewani

MongoDB Monitoring: Everything You Need to Know
Discover the essentials of MongoDB monitoring, including key metrics, best practices, and top tools to optimize performance and security.
Anjali Udasi

An In-Depth Guide to Java Performance Monitoring for SREs
Learn how SREs can optimize Java performance with real-time monitoring, proactive insights, and the right observability tools.
Preeti Dewani

Your 2025 Guide to the 11 Best Infrastructure Monitoring Tools
Discover the top 11 infrastructure monitoring tools for 2025, from open-source to fully managed solutions, and find the best fit for your stack.
Anjali Udasi

Redis Metrics: Monitoring, Performance, and Best Practices
Learn how to monitor Redis metrics, optimize performance, and follow best practices to ensure reliability and efficiency in your deployments.
Anjali Udasi

10 Kubernetes Monitoring Tools You Can't-Miss in 2025
Discover the top 10 Kubernetes monitoring tools in 2025 that help optimize performance, ensure reliability, and provide comprehensive observability.
Anjali Udasi

Top 11 API Monitoring Tools You Need to Know
Discover 11 top API monitoring tools to track performance, uptime, and reliability—helping you keep your APIs running smoothly.
Anjali Udasi

JMX Monitoring: Your Go-To Guide for Java Application Management
Learn JMX monitoring to master Java app management, track performance, and ensure optimal health with this ultimate guide.
Anjali Udasi

MySQL Monitoring: Key Metrics, Built-in Tools, and Open-Source Solutions
Explore the pros and cons of open-source and commercial MySQL monitoring tools to find the best fit for your database needs.
Anjali Udasi

RUM Metrics Explained: What to Track for Better User Experience
Learn the key metrics in Real User Monitoring (RUM) and how to measure them for better performance and user experience insights.
Anjali Udasi

TCP Monitoring Made Simple: Keep Your Network in Check
Learn how TCP monitoring keeps your network fast, reliable, and free from issues like latency, packet loss, and connection hiccups.
Anjali Udasi

IoT Monitoring: Why It Matters and How to Do It Right?
Learn about IoT monitoring, its benefits, best practices, and use cases to optimize your systems and improve operational efficiency.
Anjali Udasi

8 Leading Network Monitoring Tools for Enterprises
Explore 8 top network monitoring tools that help enterprises ensure performance, reliability, and security across their networks.
Anjali Udasi

Total Blocking Time (TBT): What It Is, Why It Matters, and How to Fix It
Learn what Total Blocking Time (TBT) is, why it matters, and how to optimize it for better website performance and user experience.
Anjali Udasi

What is Single Pane of Glass Monitoring and How It Works
Single pane of glass monitoring provides a unified view of your system's data, making it easier to track performance and troubleshoot issues.
Anjali Udasi

Loki S3 Storage: A Guide for Efficient Log Management
Learn how to optimize Grafana Loki with S3 storage for scalable, cost-effective log management and improved performance.
Anjali Udasi

Java Application Monitoring: How It Works, Tools, and Best Practices
Learn how Java application monitoring works, explore essential tools and discover best practices to optimize performance and reliability.
Faiz Shaikh

Windows Server Monitoring: Tools, Best Practices & Strategies
Discover essential tools, best practices, and strategies for effective Windows server monitoring to ensure smooth performance and minimize downtime.
Anjali Udasi

10 Steps to Fix Upstream Connect Errors
Learn quick fixes for upstream connect errors, including troubleshooting tips, monitoring tools, and configuration adjustments to resolve issues fast.
Prathamesh Sonpatki

eBPF for Enhanced Observability in Modern Systems
eBPF enhances observability by providing deep insights into system performance and security with minimal overhead, ideal for modern, distributed systems.
Anjali Udasi

Optimizing Systems with the Observability Maturity Model
The Observability Maturity Model helps organizations optimize systems by advancing through stages to improve reliability, performance, and troubleshooting.
Anjali Udasi

Application Monitoring Best Practices: A Comprehensive Guide
Ensure your app's reliability with best practices in monitoring: choose key metrics, configure alerts, and stay proactive for optimal performance.
Anjali Udasi

The Essentials of SNMP Monitoring in Networks
SNMP monitoring is crucial for tracking network device performance, helping optimize and secure your network with real-time insights.
Anjali Udasi

The Basics of Network Device Monitoring Explained
Network device monitoring tracks the performance and health of your network's devices, helping detect issues early, optimize performance, and ensure security.
Anjali Udasi

Why You Need Server Monitoring Tools and How to Choose
Discover the importance of server monitoring tools and how to choose the best one to optimize performance, prevent downtime, and ensure security.
Anjali Udasi

Why Cloud Security Monitoring is Crucial for Your Business
Cloud security monitoring is essential to protect data, ensure compliance, and safeguard against growing cyber threats in cloud environments.
Anjali Udasi

DNS Monitoring: Everything You Need to Know
DNS monitoring ensures your domain records are accurate, secure, and performing well, helping prevent outages and attacks.
Anjali Udasi

A Guide to Database Optimization for High Traffic
Learn how to optimize your database for high traffic, ensuring performance, scalability, and reliability under heavy load.
Prathamesh Sonpatki

Grafana and Docker: A Simple Way to Monitor Everything
Grafana and Docker make monitoring effortless with easy deployment, scalability, and isolation, helping you track data efficiently in any environment.
Anjali Udasi

LLM Observability: Architecture, Key Components, and Common Challenges
LLM observability is key to ensuring model performance. Learn its importance, best practices, and actionable steps for optimal results and reliability.
Anjali Udasi

MongoDB vs Elasticsearch: Key Differences Explained
Learn the key differences between MongoDB and Elasticsearch, and understand when to use each for your database and search needs.
Anjali Udasi

API Monitoring: A Comprehensive Guide for Developers
Learn how to keep your APIs running smoothly! From tracking performance to boosting reliability, this guide has everything developers need.
Anjali Udasi

A Beginner's Guide to GCP Monitoring
Learn how to monitor and optimize your GCP resources effortlessly. Simplify performance tracking and keep your services running smoothly.
Prathamesh Sonpatki
Anjali Udasi

Top 5 Open Source SIEM Tools for Security Monitoring
Explore open-source SIEM tools to enhance your security monitoring. Learn about features, deployment, and how they compare to commercial solutions.
Anjali Udasi

Full-Stack Observability for Better Application Performance
Achieve better application performance with full-stack observability, gaining real-time insights to troubleshoot, optimize, and enhance user experience.
Anjali Udasi

Proactive Monitoring: What It Is, Why It Matters, & Use Cases
Proactive monitoring helps IT teams spot issues early, ensuring smooth operations, minimal disruptions, and a better user experience.
Anjali Udasi

Prometheus Metrics Types - A Deep Dive
A deep dive on different metric types in Prometheus and best practices
Tripad Mishra
AWS Monitoring Tools to Optimize Cloud Performance
Learn how AWS monitoring tools like CloudWatch, X-Ray, and others can help boost your cloud performance and make everything run smoothly.
Anjali Udasi

OpenSearch vs. Elasticsearch: What’s the Real Difference?
OpenSearch and Elasticsearch are both powerful search engines, but OpenSearch offers an open-source alternative with community-driven development.
Anjali Udasi

Why Golden Signals Matter for Monitoring
Golden Signals—latency, traffic, error rate, and saturation—help SRE teams monitor system health and avoid costly performance issues.
Anjali Udasi

What is ELK: Core Components, Ecosystem & Setup Guide
Learn about the ELK Stack’s core components, extended ecosystem, and setup guide for efficient log management and data analysis.
Anjali Udasi
Datadog vs. Grafana: Finding Your Ideal Monitoring Tool
Discover the key differences between Datadog and Grafana to find the ideal monitoring tool that fits your needs and budget.
Anjali Udasi

How to Cut Down Amazon CloudWatch Costs
Check out these straightforward tips to manage your metrics and logs better. You can keep your monitoring effective while cutting down on costs!
Anjali Udasi

OTEL Collector Monitoring: Best Practices & Guide
Learn how to effectively monitor the OTEL Collector with best practices and implementation strategies for improved system performance.
Anjali Udasi

The Ultimate Guide to Application Performance Monitoring (APM)
Learn everything about Application Performance Monitoring (APM), from its definition to its crucial role in optimizing application performance.
Anjali Udasi

Docker Monitoring with Prometheus: A Step-by-Step Guide
This guide walks you through setting up Docker monitoring using Prometheus and Grafana, helping you track container performance and resource usage with ease.
Prathamesh Sonpatki
Anjali Udasi

Synthetic Monitoring Explained: A Developer's Guide
Synthetic monitoring empowers developers to stay ahead of potential problems by simulating real user actions. This guide breaks down how it works, its benefits, and how you can use it to keep your web applications and APIs performing at their best.
Anjali Udasi

Adding Cluster Labels to Kubernetes Metrics
A definitive guide on adding cluster label to all Kubernetes metrics
Prathamesh Sonpatki

What is Prometheus Remote Write
Explore Prometheus Remote Write: scale your monitoring effortlessly. Learn how it works, its benefits, and top tips for cloud-native setups.
Prathamesh Sonpatki

Prometheus Operator Guide
What is Prometheus Operator, how it can be used to deploy Prometheus Stack in Kubernetes environment
Anjali Udasi
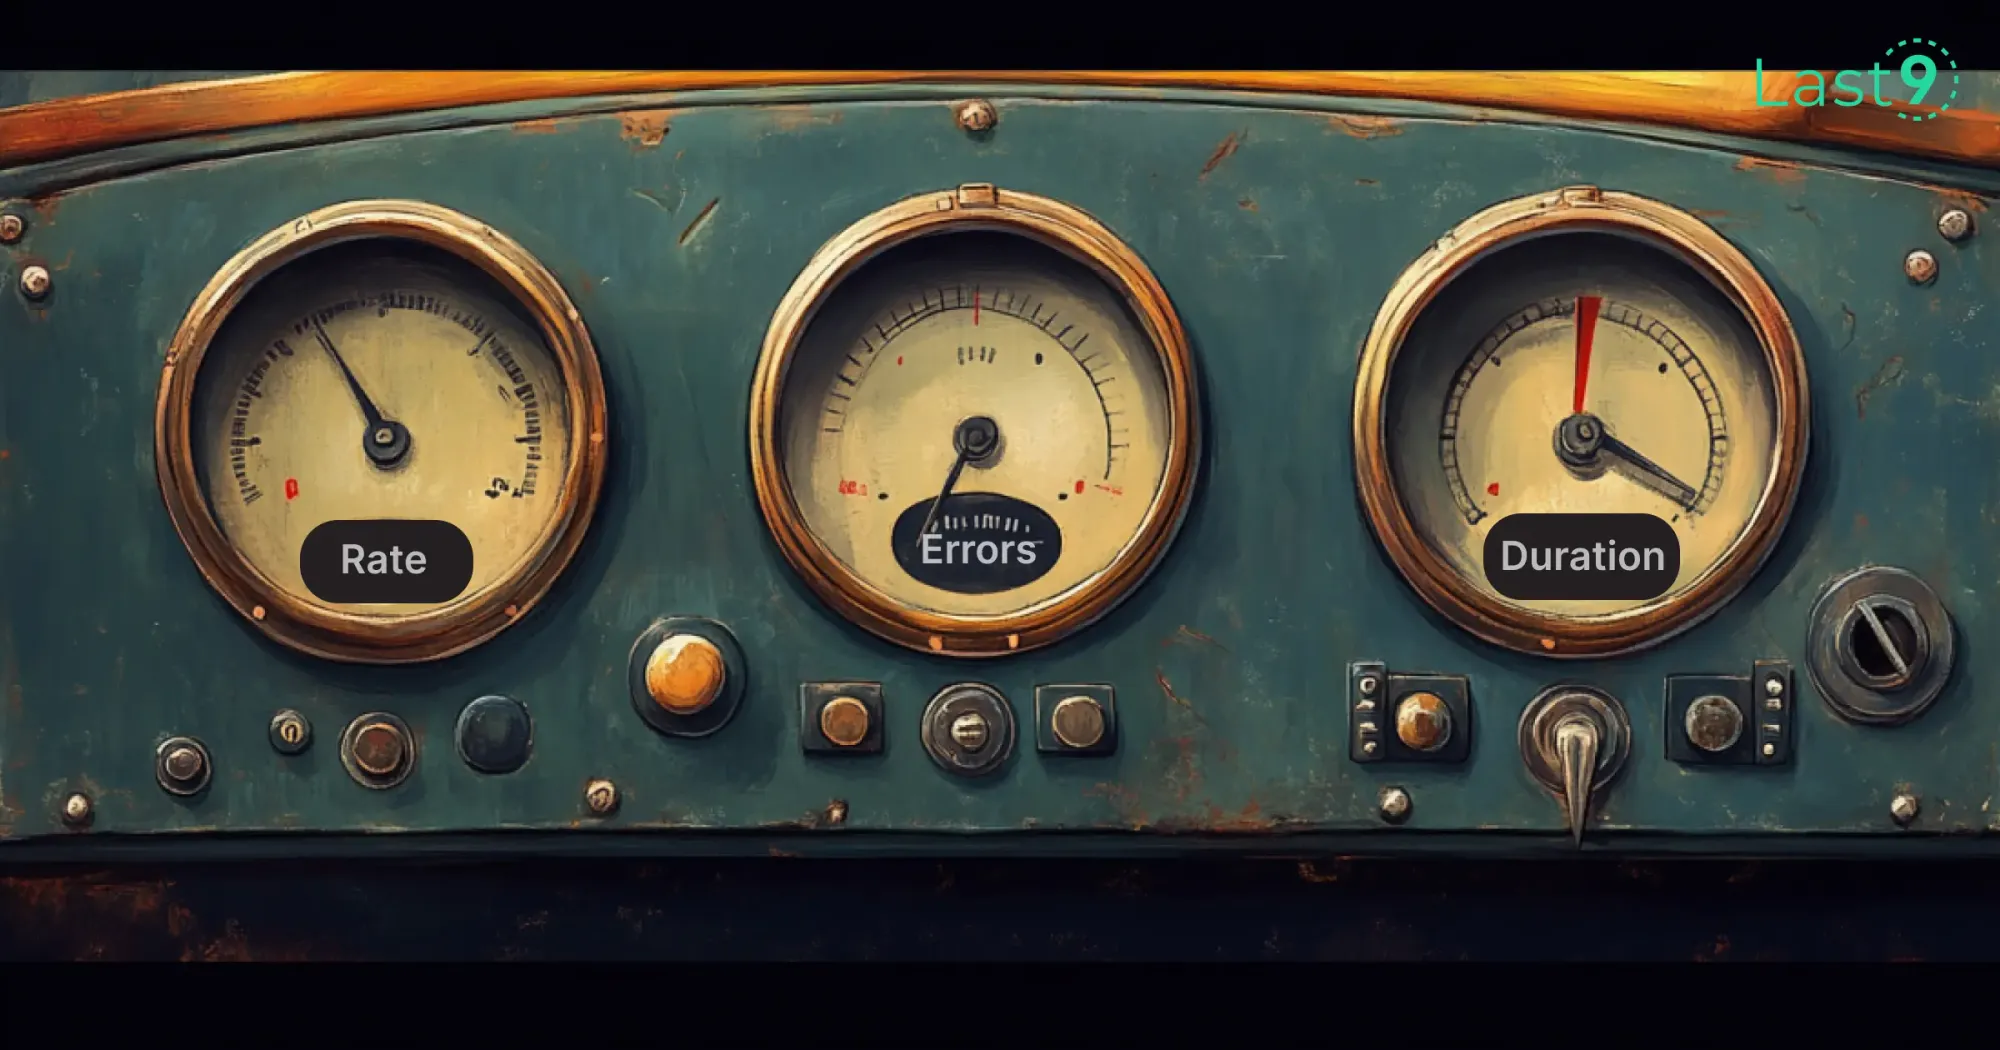
Microservices Monitoring with the RED Method
This blog introduces the RED method—an approach that simplifies microservices monitoring by honing in on requests, errors, and latency.
Prathamesh Sonpatki

What is Prometheus
What is Prometheus, how to use it and challenges of scaling Prometheus
Gabriel Diaz

2024's Best Cloud Monitoring Tools: Updated Insights
Get a detailed look at the top cloud monitoring tools of 2024. Compare leading solutions to understand their features and performance, helping you choose the best fit for your cloud infrastructure.
Anjali Udasi

Observability vs. Telemetry vs. Monitoring
Observability is the continuous analysis of operational data, telemetry is the operational data that feeds into that analysis, and monitoring is like a radar for your system observing everything about your system and alerting when necessary.
Anjali Udasi

Think Data Warehouse, NOT Database.
The software monitoring world is broken because of a TSDB. We deserve a TSDW
Aniket Rao

What is the OpenTelemetry Collector and How Does It Work?
The OpenTelemetry Collector simplifies data collection, processing, and export for metrics, logs, and traces. Learn about its architecture, deployment, and examples.
Prathamesh Sonpatki

Building Monitoring with Auto-Discovery for 70+ Microservices
The promise of a managed SaaS partner — Reducing monitoring costs at all costs
Preeti Dewani

What needs to change in software monitoring?
A wishlist of things that need to change in the world of software monitoring
Aniket Rao
How We Cut Monitoring Costs and Deprecated Thanos at Replit
Winning Replit over by taming High Cardinality data and deprecating Thanos
Prathamesh Sonpatki

Software Monitoring — Stuck in the 00s
A short history of software monitoring, from the 00s. What has changed? Why are things so arcane?
Piyush Verma

A checklist to choose a monitoring system
A detailed checklist of points you should consider before choosing a monitoring system
Prathamesh Sonpatki

Controlling Kubernetes Costs with OpenCost and Last9
Setting up OpenCost with Last9 to monitor the cost of Kubernetes clusters
Aniket Rao

Why your monitoring costs are high
If you want to bring down your monitoring costs, you need to shake up a decision paralysis in engineering
Aniket Rao

Monitor Cloudflare Workers using Prometheus Exporter
Complete guide to monitor Cloudflare workers using Prometheus Exporter
Aniket Rao

Why you need a Time Series Data Warehouse
What is a Time Series Data Warehouse? How does it help in your monitoring journey? How does it differ from a Time Series Database? That and more
Rishi Agrawal

Instrumenting Golang Apps with OpenTelemetry
A comprehensive guide to instrument Golang applications using OpenTelemetry libraries for metrics and traces.
Last9

Building Logs to Metrics pipelines with Vector
How to build a pipeline to convert logs to metrics and ship them to long term Prometheus storage like Last9.
Aniket Rao

SaaS Monitoring with Levitate
How Levitate solves today's challenges of B2B SaaS monitoring, including noisy neighbors by unlocking per-tenant observability
Prathamesh Sonpatki

Troubleshooting Common Prometheus Issues: Cardinality & More
Common Prometheus pitfalls and ways to handle them
Last9

Downsampling & Aggregating Metrics in Prometheus
A comprehensive guide to downsampling metrics data in Prometheus with alternate robust solutions
Last9

Mastering Prometheus Relabeling: A Comprehensive Guide
A comprehensive guide to relabeling strategies in Prometheus
Last9
Real-Time Canary Deployment Tracking with Argo CD & Last9
Use Last9's powerful change events to track success of canary rollouts via ArgoCD
Preeti Dewani
Monitor Google Cloud Functions using Pushgateway and Levitate
How to monitor serverless async jobs from Google Cloud Functions with Prometheus Pushgateway and Levitate using the push model
Aniket Rao

Prometheus vs. ELK
Comparison and differences between Prometheus and ELK
Last9

What is Thanos and How Does it Scale Prometheus?
A guide on what is Thanos and how it can be used with Prometheus
Last9

A case for Observability outside engineering teams
Observability is being built by engineers for engineers. In reality, o11y is for all.
Aniket Rao

Understanding the Rasmussen model for failures
What does the Rasmussen model teach us about Site Reliability Engineering?
Nishant Modak

How to Manage High Cardinality Metrics in Prometheus
A comprehensive guide on understanding high cardinality Prometheus metrics, proven ways to find high cardinality metrics and manage them.
Last9

Metrics, Events, Logs, and Traces: Observability Essentials
Understanding Metrics, Logs, Events and Traces - the key pillars of observability and their pros and cons for SRE and DevOps teams.
Prathamesh Sonpatki

SRE vs Platform Engineering
What's the difference between SREs and Platform Engineers? How do they differ in their daily tasks?
Last9
Prometheus vs Datadog
Comparison between Prometheus and Datadog - two of the most popular monitoring tools in the market today
Last9

Who should define Reliability — Engineering, or Product?
Whoever owns Reliability should define its parameters. But who owns the Reliability of a Product? Engineering? Product Management? Or the Customer success team?
Piyush Verma

Interesting talks on Observability from Fosdem 2023
A recap of the talks from the Observability and Monitoring dev room at Fosdem 2023.
Prathamesh Sonpatki

Prometheus Monitoring
Prometheus is a popular open-source monitoring system. In this blog, we'll cover the basics of Prometheus monitoring, including its architecture, key features, and alternatives.
Last9

When should I start thinking of observability?
How does one scale metrics maturity in a cloud-native world — A guide on observability tooling as your engineering org scales.
Piyush Verma
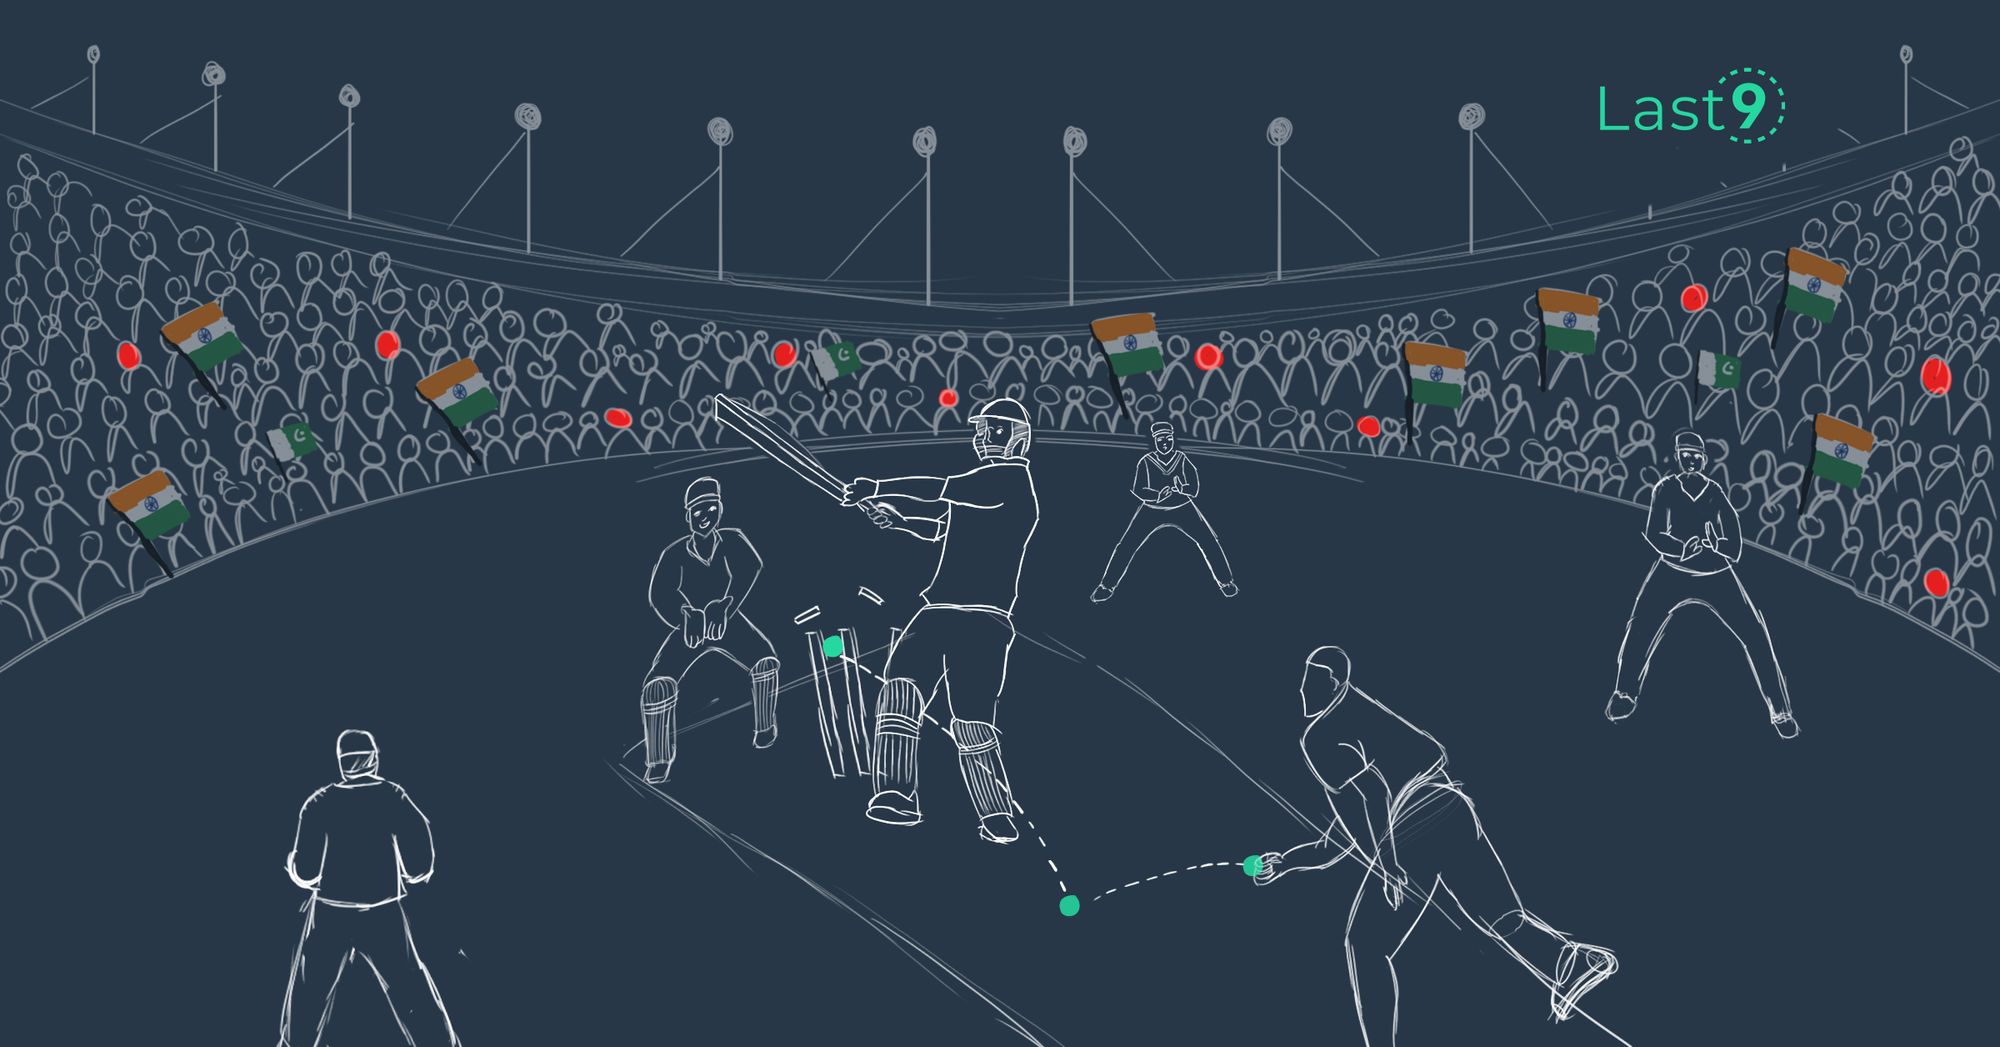
India vs Pakistan: SRE and the Shannon Limit
How does one ‘detect change’ in a complex infrastructure, so you don’t lose out on critical revenues — A short SRE story
Satyajeet Jadhav

Kubernetes Monitoring with Prometheus and Grafana
A guide to help you implement Prometheus and Grafana in your Kubernetes cluster
Last9

Static Threshold vs. Dynamic Threshold Alerting
What's the difference between Static Threshold vs Dynamic Threshold Alerting? Do you really know when and how to use each threshold type?
Last9

Sample vs Metrics vs Cardinality
When dealing with Time Series databases, I always got confused with Sample vs Metrics vs Cardinality. Here’s an explanation as I have understood it.
Piyush Verma