


Kubernetes Monitoring Tools: What Actually Works at Scale
What actually works for Kubernetes monitoring at scale — not what looks good in a vendor demo with a five-pod cluster.
Faiz Shaikh

Argo Rollouts Canary Monitoring: Metrics, Gotchas, and Automated Gates with Last9
Argo Rollouts exposes Prometheus metrics on port 8090 — but the docs lie about which labels exist. Here's how to scrape them into Last9, build a canary dashboard, and use Last9 as an automated AnalysisTemplate gate, including the auth and base64 gotchas.
Prathamesh Sonpatki

Why Your PromQL Availability Query Returns Nothing When Services Are Healthy
Your SLI query shows 100% availability as No Data. Here's why PromQL returns empty results instead of zero — and the label-preserving fix.
Prathamesh Sonpatki

High Cardinality Metrics: How Prometheus and ClickHouse Handle Scale
Prometheus pays for high cardinality metrics at write time. ClickHouse pays at query time. Neither solves it : they fail differently. Here's how to choose.
Aditya Godbole
Preeti Dewani

Build Your Kubernetes Monitoring Foundation with kube-prometheus-stack
Set up production-grade Kubernetes monitoring with kube-prometheus-stack using Prometheus, Grafana, and Alertmanager.
Anjali Udasi

How Prometheus Exporters Work With OpenTelemetry
Learn how Prometheus exporters expose OTLP metrics in Prometheus format, making it easier to scrape OpenTelemetry data.
Anjali Udasi

AWS Prometheus: Production Patterns That Help You Scale
Run Prometheus reliably on AWS with patterns for scale, cost control, and visibility across EKS, EC2, and multi-region setups.
Anjali Udasi

How sum_over_time Works in Prometheus
Understand how sum_over_time() aggregates metrics in Prometheus, handles gaps, and why step size and staleness can affect accuracy.
Faiz Shaikh

Use Telegraf Without the Prometheus Complexity
Collect metrics with Telegraf without running Prometheus. No scraping, no TSDB tuning, just clean, push-based telemetry to your backend.
Anjali Udasi

Prometheus Group By Label: Advanced Aggregation Techniques for Monitoring
Know how to use group by in Prometheus for advanced metric aggregation, reduce noise, and improve observability across services.
Faiz Shaikh

Prometheus Gauges vs Counters: What to Use and When
Understand the difference between Prometheus gauges and counters, when to use each, and how to avoid common metric pitfalls.
Anjali Udasi

Prometheus and CloudWatch Integration for AWS Metric Collection
Understand how to collect and query AWS CloudWatch metrics in Prometheus using the CloudWatch exporter, setup, IAM config, and best practices.
Anjali Udasi

Prometheus Logging Explained for Developers
Understand how Prometheus logging captures structured metrics, improves query performance, and scales observability in production systems.
Prathamesh Sonpatki

How to Integrate OpenTelemetry Collector with Prometheus
Understand how to set up OpenTelemetry Collector with Prometheus for easy, vendor-neutral metrics collection and storage.
Prathamesh Sonpatki

How to Configure and Optimize Prometheus Data Retention
Learn how to set Prometheus retention limits, avoid storage bloat, and keep the metrics that matter for your systems.
Preeti Dewani
Prometheus Alerting Examples for Developers
Know how to set up smarter Prometheus alerts from basic CPU checks to app-aware rules that reduce noise and catch real issues early.
Prathamesh Sonpatki

How to Monitor and Optimize Prometheus CPU Usage
Know how to monitor, understand, and optimize Prometheus CPU usage to keep your observability reliable and efficient.
Faiz Shaikh

Easily Query Multiple Metrics in Prometheus
Learn how to efficiently query multiple metrics in Prometheus, simplifying your monitoring workflow and enhancing visibility into your systems.
Preeti Dewani

Prometheus Distributed Tracing: An Easy-to-Follow Guide for Engineers
Learn how to implement Prometheus distributed tracing in your microservices architecture to quickly identify and resolve performance issues.
Preeti Dewani

Getting Started with Prometheus Metrics Endpoints
Learn how to get started with Prometheus metrics endpoints to collect, expose, and query critical data for better system monitoring.
Anjali Udasi
Prometheus Histograms: Buckets, Queries & histogram_quantile
Learn how Prometheus histogram buckets work, why they matter, and how to fine-tune them for better observability and smarter alerting.
Prathamesh Sonpatki

How to Use Prometheus for APM
Learn how to turn Prometheus into a powerful APM tool—track app performance, reduce guesswork, and get real visibility into your systems.
Prathamesh Sonpatki

21 PromQL Tricks Every Developer Should Know
Boost your PromQL skills with these 21 handy tricks—optimize queries, troubleshoot faster, and get deeper insights from your metrics.
Preeti Dewani

An Easy and Comprehensive Guide to Prometheus API
Unlock the full potential of Prometheus API with this easy yet comprehensive guide—learn how to query, integrate, and automate monitoring.
Faiz Shaikh

Essential Prometheus Queries: Simple to Advanced
Learn essential Prometheus queries, from simple to advanced, to monitor, troubleshoot, and optimize your systems with confidence.
Anjali Udasi

Prometheus Port Configuration: A Detailed Guide
Learn how to configure Prometheus ports correctly, whether using defaults or custom settings, to keep your monitoring setup running smoothly.
Prathamesh Sonpatki

Prometheus API: From Basics to Advanced Usage
Learn how to use the Prometheus API, from basic queries to advanced techniques, to monitor and analyze your system metrics effectively.
Prathamesh Sonpatki

Prometheus Functions: How to Make the Most of Your Metrics
Dig into your Prometheus metrics with functions that help you filter, analyze, and spot trends—so you can make sense of your data faster.
Preeti Dewani

Prometheus with Docker Compose: The Complete Setup Guide
Learn how to set up, configure, and run Prometheus with Docker Compose for efficient monitoring, alerting, and visualization.
Prathamesh Sonpatki

OpenTelemetry vs. Prometheus: An Easy to Follow Comparison
OpenTelemetry vs. Prometheus - Difference in architecture, and metrics
Anjali Udasi
Prometheus Metrics Types - A Deep Dive
How Prometheus counters, gauges, histograms, and summaries work, which PromQL functions fit each, the cardinality traps to avoid, and how to choose the right type.
Tripad Mishra

Prometheus Pushgateway: How to Track Short-Lived Jobs
Learn how to use Prometheus Pushgateway to track metrics from short-lived jobs and ensure reliable monitoring for all your processes.
Anjali Udasi

Scaling Prometheus: Tips, Tricks, and Proven Strategies
Learn how to scale Prometheus with practical tips and strategies to keep your monitoring smooth and efficient, even as your needs grow!
Prathamesh Sonpatki

Prometheus Alertmanager: What You Need to Know
Explore how Prometheus Alertmanager simplifies alert handling, reducing fatigue by smartly grouping and routing notifications for your team.
Anjali Udasi

Prometheus RemoteWrite Exporter: A Comprehensive Guide
A comprehensive guide showing how to use PrometheusRemoteWriteExporter to send metrics from OpenTelemetry to Prometheus compatible backends
Prathamesh Sonpatki

Docker Monitoring with Prometheus: A Step-by-Step Guide
This guide walks you through setting up Docker monitoring using Prometheus and Grafana, helping you track container performance and resource usage with ease.
Prathamesh Sonpatki
Anjali Udasi

High Availability in Prometheus: Best Practices and Tips
This blog defines high availability in Prometheus, discusses challenges, and offers essential tips for reliable monitoring in cloud-native environments.
Anjali Udasi

Prometheus Recording Rules: Developer Guide to Optimization
This guide breaks down how recording rules can help, with simple tips to improve performance and manage complex data.
Prathamesh Sonpatki

Prometheus Rate Function: A Practical Guide to Using It
A practical guide to the Prometheus rate() function: how it works, when to use rate() vs irate() vs increase(), time range best practices, common pitfalls, and advanced patterns for aggregation and alerting.
Anjali Udasi

Adding Cluster Labels to Kubernetes Metrics
A definitive guide on adding cluster label to all Kubernetes metrics
Prathamesh Sonpatki
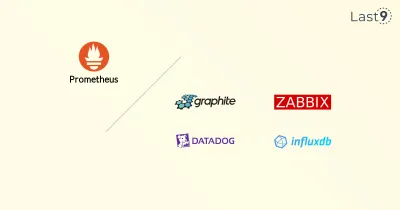
Prometheus Alternatives in 2026: 6 Monitoring Tools Compared
Prometheus is a powerful open-source monitoring tool, but it has real limits at scale. Here is how the top Prometheus alternatives compare: InfluxDB, Zabbix, Datadog, Graphite, Grafana, and Last9, across storage, architecture, APIs, and language support.
Gabriel Diaz

Optimizing Prometheus Remote Write Performance: Guide
Master Prometheus remote write optimization. Learn queue tuning, cardinality management, and relabeling strategies to scale your monitoring infrastructure efficiently.
Gabriel Diaz

What is Prometheus Remote Write
Explore Prometheus Remote Write: scale your monitoring effortlessly. Learn how it works, its benefits, and top tips for cloud-native setups.
Prathamesh Sonpatki

Prometheus Operator Guide
What is Prometheus Operator, how it can be used to deploy Prometheus Stack in Kubernetes environment
Anjali Udasi

PromCon 2024 — Day 1
Get a quick overview of Day 1 at PromCon 2024, which featured significant announcements on Prometheus 3.0 and OpenTelemetry compatibility
Prathamesh Sonpatki

PromQL: A Developer's Guide to Prometheus Query Language
Our developer’s guide breaks down Prometheus Query Language in an easy-to-understand way, helping you monitor and analyze your metrics like a pro.
Gabriel Diaz

PromQL for Beginners: Getting Started with Prometheus
New to Prometheus? My PromQL beginner's guide teaches you how to write queries, understand data types, and use key functions.
Gabriel Diaz

What is Prometheus
What is Prometheus, how to use it and challenges of scaling Prometheus
Gabriel Diaz

Prometheus Toolkit: Your Essential Companion for Monitoring
Building a standardized open-source resource across instrumentation, query, and alerting pipelines to start your monitoring journey with Prometheus.
Sahil Khan

Prometheus Federation ⏤ Scaling Prometheus Guide
We discuss the nuances of Federation in Prometheus, address Prometheus Scaling Challenges along with alternatives to Prometheus federation
Tripad Mishra

Monitor Cloudflare Workers using Prometheus Exporter
Complete guide to monitor Cloudflare workers using Prometheus Exporter
Aniket Rao

Building Logs to Metrics pipelines with Vector
How to build a pipeline to convert logs to metrics and ship them to long term Prometheus storage like Last9.
Aniket Rao
Troubleshooting Common Prometheus Issues: Cardinality & More
Common Prometheus pitfalls and ways to handle them
Last9

Downsampling & Aggregating Metrics in Prometheus
A comprehensive guide to downsampling metrics data in Prometheus with alternate robust solutions
Last9

Mastering Prometheus Relabeling: A Comprehensive Guide
A comprehensive guide to relabeling strategies in Prometheus
Last9
Monitor Google Cloud Functions using Pushgateway and Levitate
How to monitor serverless async jobs from Google Cloud Functions with Prometheus Pushgateway and Last9 using the push model
Aniket Rao

Challenges with Running Prometheus at Scale
Understanding limitations and challenges scaling Prometheus in modern cloud-native environments. Here we delve into long-term retention, downsampling, high availability, and other challenges.
Last9

Prometheus vs. ELK
Comparison and differences between Prometheus and ELK
Last9

What is Thanos and How Does it Scale Prometheus?
A guide on what is Thanos and how it can be used with Prometheus
Last9

GCP Managed Service For Prometheus vs. Levitate
A detailed comparison of Levitate and Google Managed Prometheus - Cost, Scale and Ease of Use
Prathamesh Sonpatki

Thanos vs. VictoriaMetrics
A deep dive comparison between Thanos and VictoriaMetrics: Performance and Differences
Last9

Ingest OpenTelemetry metrics with Prometheus natively
Native support for OpenTelemetry metrics in Prometheus
Prathamesh Sonpatki

How we tame high cardinality in time series databases
Engineering innovation to solve high cardinality with Last9 - a multi-part series
Piyush Verma
Swati Modi
Prometheus vs. VictoriaMetrics (VM)
Comparing Prometheus vs. VictoriaMetrics (VM) - Scalability, Performance, Integrations
Nishant Modak
Prometheus vs. Cortex
Comparing Prometheus vs. Cortex - Scalability, Cost, Performance, Known Weaknesses
Last9

Graphite vs Prometheus
Compare Graphite and Prometheus, two leading open-source monitoring solutions.
Prathamesh Sonpatki

Prometheus vs Thanos: Key Differences & Best Practices
Everything you want to know about Prometheus and Thanos, their differences, and how they can work together.
Last9

High Cardinality in Prometheus: How to Find and Fix It
Find high cardinality metrics with tsdb status and PromQL, then cut series with relabeling, recording rules, sample_limit, and histogram buckets.
Nishant Modak

Prometheus vs Grafana: Key Differences and When to Use Each
Explore the differences between Prometheus and Grafana and how these two powerful tools work together to enhance monitoring and data visualization.
Prathamesh Sonpatki

Prometheus vs Datadog: Cost, Scale, and How to Choose
Compare Prometheus and Datadog on cost, scale, integrations, and lock-in: when open-source wins, when managed is worth it, and where Last9 fits.
Last9

Filtering Metrics by Labels in OpenTelemetry Collector
How to filter metrics by labels using OpenTelemetry Collector
Prathamesh Sonpatki

Learnings integrating jmxtrans
JMX metrics give solid insights into the workings of your application. Integrating them with Last9 (our time series data warehosue) required us to jump some hoops with vmagent.
Saurabh Hirani

Prometheus Monitoring
Prometheus is a popular open-source monitoring system. In this blog, we'll cover the basics of Prometheus monitoring, including its architecture, key features, and alternatives.
Last9

Self-managed Prometheus vs Managed Prometheus
What are the differences between Self-managed Prometheus vs Managed prometheus? How do you choose what works for you?
Last9

Best Practices Using and Writing Prometheus Exporters
This article will go over what Prometheus exporters are, how to properly find and utilize prebuilt exporters, and tips, examples, and considerations when building your own exporters.
Last9

How to improve Prometheus remote write performance at scale
Deep dive into how to improve the performance of Prometheus Remote Write at Scale based on real-life experiences
Saurabh Hirani

Prometheus vs InfluxDB: Side-by-Side Comparison
What are the differences between Prometheus and InfluxDB - use cases, challenges, advantages and how you should go about choosing the right tsdb
Anjali Udasi

Kubernetes Monitoring with Prometheus and Grafana
A guide to help you implement Prometheus and Grafana in your Kubernetes cluster
Last9