

Prathamesh Sonpatki
Prathamesh works as an evangelist at last9, runs sre stories - where sre and devops folks share their stories, and maintains o11y.wiki - a glossary of all terms related to observability.

High Cardinality in ClickHouse at Scale: What Actually Breaks
ClickHouse swallows high-cardinality telemetry at ingest, then breaks at query time weeks later. Here is what fails, and how we keep it fast in production.
Prathamesh Sonpatki

ClickHouse LowCardinality: When It Helps and When It Hurts
ClickHouse LowCardinality cuts storage and speeds up queries on low-cardinality columns, but backfires on trace IDs. How to tell the difference.
Prathamesh Sonpatki

Zero-Code OpenTelemetry for Vert.x
Drop a JAR on the JVM. Get distributed tracing, RxJava context propagation, log-trace correlation, and Vert.x internal metrics. No code changes. No Maven dependency. Java 8–21. Inside the design of last9/vertx-opentelemetry v2.3.4.
Prathamesh Sonpatki

Stop ECS Containers From Collapsing Into One Service in OpenTelemetry
Why ECS containers collapse under service.name = aws_ecs and how to fix it for both EC2 launch type and Fargate, including the resource-vs-log-record pitfall that quietly breaks log filtering.
Prathamesh Sonpatki

How to Test SQS Workflows Locally with LocalStack and OpenTelemetry
LocalStack lets you run SQS, Lambda, and S3 locally in Docker — but there's a hidden trap: OpenTelemetry's default AWS propagator doesn't work with free LocalStack. Here's how to set up end-to-end local testing with working trace propagation.
Prathamesh Sonpatki

End-to-End Trace Propagation Across SQS and Lambda with OpenTelemetry
SQS doesn't propagate trace context automatically. You instrument both sides, deploy, and get two disconnected traces. This post shows how to wire them into one waterfall — and the ESM format gotcha that silently breaks it every time.
Prathamesh Sonpatki

last9-genai: Closing the Conversation Gap in LLM Observability
OpenTelemetry's GenAI instrumentation gives you spans and token counts. It does not give you conversations, workflow cost rollups, or prompts visible in your dashboard. last9-genai is an OTel extension that fills those three gaps — without replacing your existing observability stack.
Prathamesh Sonpatki

How to Exclude Health Check Endpoints from Python OTel Traces
Health check endpoints generate thousands of identical, useless spans per day. Here are two production-ready approaches to filter them from your Python OTel traces — and the correctness trap most implementations miss.
Prathamesh Sonpatki

Argo Rollouts Canary Monitoring: Metrics, Gotchas, and Automated Gates with Last9
Argo Rollouts exposes Prometheus metrics on port 8090 — but the docs lie about which labels exist. Here's how to scrape them into Last9, build a canary dashboard, and use Last9 as an automated AnalysisTemplate gate, including the auth and base64 gotchas.
Prathamesh Sonpatki

What is AI SRE? The Complete Guide to AI-Assisted Site Reliability Engineering
It's 2:47 AM. PagerDuty fires. You open a Slack alert and see: p99 latency spike on checkout-service. You SSH into the host, check dashboards in four tabs, grep logs for the last 20 minutes, and eventually find a slow query introduced in a deploy six hours ago. It took 34 minutes. You resolved it, w
Prathamesh Sonpatki

Capturing HTTP Request and Response Bodies in .NET Traces with PHI Redaction
> Standard OTel .NET instrumentation captures headers, status codes, and timing — not request or response bodies. Here's how to add body capture to your traces while keeping PHI out of your observability backend.
Prathamesh Sonpatki
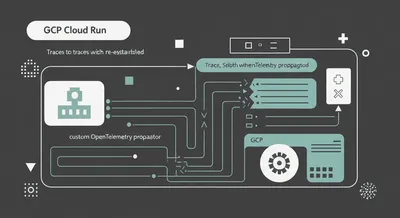
Fixing Broken Traces in GCP Cloud Run: A Custom OpenTelemetry Propagator
GCP's load balancer silently rewrites your traceparent header, orphaning spans in any OTLP backend. Here's the custom propagator that fixes it.
Prathamesh Sonpatki

Why Your PromQL Availability Query Returns Nothing When Services Are Healthy
Your SLI query shows 100% availability as No Data. Here's why PromQL returns empty results instead of zero — and the label-preserving fix.
Prathamesh Sonpatki

Instrumenting WordPress with OpenTelemetry: PHP Tracing, Browser RUM, and Error Capture in Production
WordPress powers 40% of the web but has no native observability story. Here's how to instrument it end-to-end with OpenTelemetry - PHP, browser RUM, and errors.
Prathamesh Sonpatki
Database Partitioning: Types, Strategies, and When to Use Each
How database partitioning works in PostgreSQL and MySQL. Range, list, and hash partitioning with SQL examples and guidance on when to partition vs shard.
Prathamesh Sonpatki
Database Sharding: How It Works and When You Actually Need It
How database sharding works, common strategies (hash, range, directory), shard key selection, and the operational cost of running a sharded database in production.
Prathamesh Sonpatki
Why High-Cardinality Metrics Break Everything
What actually breaks when teams add high cardinality metrics and why those failures are hard to avoid unless the system is built for it.
Prathamesh Sonpatki
Mukta Aphale

Monitor Nginx with OpenTelemetry Tracing
Instrument NGINX with OpenTelemetry to capture traces, track latency, and connect upstream and downstream services in a single request flow.
Prathamesh Sonpatki

Build Log Automation with Last9's Query API
Here's how you can build automated log analysis workflows with Last9's Query Logs API
Prathamesh Sonpatki

Prometheus Logging Explained for Developers
Understand how Prometheus logging captures structured metrics, improves query performance, and scales observability in production systems.
Prathamesh Sonpatki

How to Integrate OpenTelemetry Collector with Prometheus
Understand how to set up OpenTelemetry Collector with Prometheus for easy, vendor-neutral metrics collection and storage.
Prathamesh Sonpatki

Prometheus Alerting Examples for Developers
Know how to set up smarter Prometheus alerts from basic CPU checks to app-aware rules that reduce noise and catch real issues early.
Prathamesh Sonpatki

Angular OpenTelemetry Setup and Troubleshooting
Learn how to set up OpenTelemetry in your Angular app and troubleshoot common issues with tracing, instrumentation, and export configuration.
Prathamesh Sonpatki

A Guide to OpenTelemetry Tracing in Distributed Systems
Learn how OpenTelemetry tracing helps monitor and optimize distributed systems, providing valuable insights for DevOps teams.
Prathamesh Sonpatki

Adding OpenTelemetry to Your React Apps: A Practical Guide
Learn how to integrate OpenTelemetry into your React apps for improved observability and better performance tracking.
Prathamesh Sonpatki

Everything You Need to Know About OpenTelemetry Histograms
OpenTelemetry histograms help you go beyond averages. Learn how they work and why they matter for real-world observability in DevOps.
Prathamesh Sonpatki

Getting Started with OpenTelemetry Custom Metrics
Learn how to use OpenTelemetry custom metrics to track what truly matters in your systems—and build more reliable, observable services.
Prathamesh Sonpatki

GDPR Log Management: A Practical Guide for Engineers
Learn how to manage logs under GDPR—handle personal data, set retention rules, and stay compliant without losing observability.
Prathamesh Sonpatki

Prometheus Histograms: Buckets, Queries & histogram_quantile
Learn how Prometheus histogram buckets work, why they matter, and how to fine-tune them for better observability and smarter alerting.
Prathamesh Sonpatki

How to Use OpenTelemetry with Postgres
Learn how to set up OpenTelemetry with Postgres to trace queries, monitor performance, and get better visibility into your database activity.
Prathamesh Sonpatki

How to Use Prometheus for APM
Learn how to turn Prometheus into a powerful APM tool—track app performance, reduce guesswork, and get real visibility into your systems.
Prathamesh Sonpatki

OpenTelemetry for Spring: Full Implementation Guide
Set up OpenTelemetry in your Spring app with ease. This guide covers implementation, common issues, and how to get tracing working right.
Prathamesh Sonpatki

Why Do You Need a Redis Monitor in Place?
A Redis monitor helps track performance, spot memory issues, and prevent unexpected failures—ensuring stability before problems escalate.
Prathamesh Sonpatki

SRECon Americas 2025 Recap Day 3
Day 3 at SRECon Americas 2025—insights, talks stories, and lessons learned. Catch the highlights from the final day!
Prathamesh Sonpatki

SRECon Americas 2025 Recap Day 2
Highlights from SREcon Americas 2025 Day 2—key takeaways, SRE challenges, and lessons from industry leaders.
Prathamesh Sonpatki

SRECon Americas 2025 Recap Day 1
Key takeaways from Day 1 at SRECon Americas 2025—insights, challenges, and what’s shaping the future of site reliability engineering.
Prathamesh Sonpatki

RabbitMQ Logs: Monitoring, Troubleshooting & Configuration
If RabbitMQ queues are backing up or messages aren’t being consumed, logs can help you figure out what’s wrong. Here’s how to monitor and fix issues.
Prathamesh Sonpatki

OpenTelemetry Backends: A Practical Implementation Guide
Learn how to choose, set up, and optimize an OpenTelemetry backend for better observability, faster troubleshooting, and improved performance.
Prathamesh Sonpatki

systemctl: The Complete Guide to Managing Linux Services
Learn how to use systemctl to start, stop, and manage services on Linux. From basics to advanced tips, this guide covers it all.
Prathamesh Sonpatki
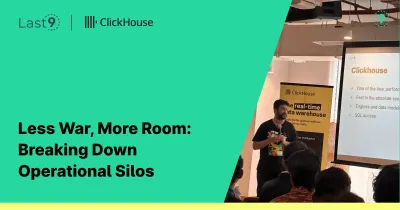
Less War, More Room: Breaking Down Operational Silos
Our Dev Evangelist, Prathamesh Sonpatki, shared insights on alert fatigue at a ClickHouse meetup—sparking great conversations on observability.
Prathamesh Sonpatki
Sahil Khan

A Practical Guide to the OpenTelemetry Java Agent
Learn how to set up, configure, and optimize the OpenTelemetry Java Agent for better observability and performance monitoring.
Prathamesh Sonpatki

Prometheus Port Configuration: A Detailed Guide
Learn how to configure Prometheus ports correctly, whether using defaults or custom settings, to keep your monitoring setup running smoothly.
Prathamesh Sonpatki

Getting Started with OpenTelemetry JavaScript
Learn how to set up OpenTelemetry JavaScript to capture traces, metrics, and logs, so you can spot issues before they become real problems.
Prathamesh Sonpatki
![A Guide to Fixing Kafka Consumer Lag [Without Jargon]](/_astro/fixing-kafka-consumer-lag.ReIkLdLL_OUmWg.webp)
A Guide to Fixing Kafka Consumer Lag [Without Jargon]
Learn simple, practical strategies to fix Kafka consumer lag and keep your data pipeline running smoothly without the jargon.
Prathamesh Sonpatki

Logging Best Practices to Reduce Noise and Improve Insights
Too many logs, not enough clarity? Follow these logging best practices to cut through the noise and get the insights that actually matter.
Prathamesh Sonpatki

Prometheus API: From Basics to Advanced Usage
Learn how to use the Prometheus API, from basic queries to advanced techniques, to monitor and analyze your system metrics effectively.
Prathamesh Sonpatki

Getting Started with the Grafana API: Practical Use Cases
Learn how to use the Grafana API to automate dashboards, manage users, and set up alerts—saving time and reducing manual effort.
Prathamesh Sonpatki

Getting Started with Golang ORMs: A Beginner's Guide
Learn how Golang ORMs simplify database interactions, explore popular options, and get started with the right choice for your project.
Prathamesh Sonpatki

How to Use journalctl --last to Check Recent System Logs
Use journalctl --last to quickly view recent system logs and troubleshoot issues by checking what happened just before an error or crash.
Prathamesh Sonpatki

How to Fix java.lang.OutOfMemoryError: Java Heap Space (with Code Examples)
Struggling with the dreaded java.lang.OutOfMemoryError? Learn the common causes and how to fix them with our step-by-step guide, including practical code examples and long-term solutions.
Prathamesh Sonpatki

OpenTelemetry Agents: A Production Guide for Zero-Code Instrumentation
Discover how OpenTelemetry agents collect, process, and export telemetry data—plus how to set them up and avoid common pitfalls.
Prathamesh Sonpatki

Elasticsearch Reindex API: A Guide to Data Management
Learn how to use the Elasticsearch Reindex API for efficient data migration, restructuring, and management in your search and analytics workflows.
Prathamesh Sonpatki

Pino.js: The Ultimate Guide to High-Performance Node.js Logging
Set up Pino in Node.js for fast, structured JSON logging covering transports, log levels, pretty-printing, redaction, and production config, with examples.
Prathamesh Sonpatki

Prometheus with Docker Compose: The Complete Setup Guide
Learn how to set up, configure, and run Prometheus with Docker Compose for efficient monitoring, alerting, and visualization.
Prathamesh Sonpatki
OpenTelemetry Visualization Setup: A Developer's Guide
Learn how to set up OpenTelemetry visualization, choose the right tools, and configure dashboards for actionable insights.
Prathamesh Sonpatki

OpenTelemetry UI: The Ultimate Guide for Developers
Explore the best OpenTelemetry UIs for tracing, metrics, and observability. Find the right tool to optimize performance and debugging.
Prathamesh Sonpatki

How to Use OpenTelemetry for Kubernetes Autoscaling Metrics
Learn how to use OpenTelemetry to collect custom metrics for Kubernetes autoscaling, enabling smarter, workload-driven scaling decisions.
Prathamesh Sonpatki

A Quick Guide for OpenTelemetry Python Instrumentation
Learn how to instrument your Python applications with OpenTelemetry to gain insights, track performance, and troubleshoot issues effectively.
Prathamesh Sonpatki

The Ultimate Guide to OpenTelemetry Visualization
Learn how to turn OpenTelemetry data into actionable insights with effective visualization techniques, best practices, and tool selection.
Prathamesh Sonpatki

Getting Started with OpenTelemetry Java SDK
Learn how to get started with the OpenTelemetry Java SDK to add observability to your application with traces, metrics, and logs.
Prathamesh Sonpatki

How to Master Zap Logger for Clean, Fast Logs
Learn how to use Zap Logger effectively for clean, fast logs in your applications with this simple, comprehensive guide.
Prathamesh Sonpatki

OpenTelemetry Processors: Workflows, Configuration Tips, and Best Practices
Explore OpenTelemetry processors: understand workflows, get configuration tips, and learn best practices for optimized observability.
Prathamesh Sonpatki

Rails Logger: How to Customize, Configure, and Optimize Your Logs
Learn how to customize, configure, and optimize Rails Logger to improve logging and debugging in your application.
Prathamesh Sonpatki

Pod Exec in K8s: Advanced Exec Scenarios and Best Practices
Learn advanced kubectl exec techniques in Kubernetes, covering best practices for troubleshooting, security, and resource management.
Prathamesh Sonpatki

Your Go-To Git Commands CheatSheet
Master Git with this cheat sheet! Learn essential and advanced commands to simplify your workflow and fix mistakes.
Prathamesh Sonpatki

OpenTelemetry Profiling: A Look into Performance Insights
OpenTelemetry profiling helps you explore app performance, pinpointing issues and improving efficiency for better, more reliable apps.
Prathamesh Sonpatki

Getting Started with Bun.js: A Quick Guide
Learn how to quickly get started with Bun.js, a fast and efficient JavaScript runtime, and optimize your development workflow.
Prathamesh Sonpatki

Node.js Worker Threads Explained (Without the Headache)
Learn how Node.js worker threads can boost performance by offloading tasks to background threads—simple, efficient, and headache-free!
Prathamesh Sonpatki

10 Steps to Fix Upstream Connect Errors
Learn quick fixes for upstream connect errors, including troubleshooting tips, monitoring tools, and configuration adjustments to resolve issues fast.
Prathamesh Sonpatki

Spring Boot Logging: Best Practices for Faster Debugging
Master Spring Boot logging with Logback, async appenders, MDC context, and OpenTelemetry integration. Debug issues 10x faster with structured logs and proper log levels.
Prathamesh Sonpatki

A Simple Guide to Understanding MongoDB Logs
Learn how to use MongoDB logs for better performance, troubleshooting, and optimization with this simple, step-by-step guide.
Prathamesh Sonpatki

How to Set Up OpenTelemetry in Django
Learn how to integrate OpenTelemetry with Django to monitor performance, trace requests, and improve observability in your applications.
Prathamesh Sonpatki

Implement Distributed Tracing with OpenTelemetry
Implementing distributed tracing with OpenTelemetry helps track requests across services, providing insights into performance and pinpointing issues.
Prathamesh Sonpatki

gRPC with OpenTelemetry: Observability Guide for Microservices
Learn how to integrate gRPC with OpenTelemetry for better observability, performance, and reliability in microservices architectures.
Prathamesh Sonpatki

Kafka with OpenTelemetry: Distributed Tracing Guide
Learn how to integrate Kafka with OpenTelemetry for enhanced distributed tracing, better performance monitoring, and effortless troubleshooting.
Prathamesh Sonpatki

Introduction to OpenTelemetry Express for Node.js Applications
OpenTelemetry Express simplifies trace collection for Node.js apps, helping you monitor performance and diagnose issues across distributed systems.
Prathamesh Sonpatki

Getting Started with OpenTelemetry Logging: A Practical Guide
Learn how to get started with OpenTelemetry Logging, streamline your observability, and enhance debugging with structured, context-rich logs.
Prathamesh Sonpatki

A Guide to Database Optimization for High Traffic
Learn how to optimize your database for high traffic, ensuring performance, scalability, and reliability under heavy load.
Prathamesh Sonpatki

AWS re:Invent 2024 Day 4 Recap
Day 4 at AWS re:Invent 2024 was filled with fresh insights, community discussions, and impactful announcements. Catch all the updates here!
Prathamesh Sonpatki

AWS re:Invent 2024 Day 3 Recap
Catch up on the highlights from AWS re:Invent 2024 Day 3, packed with fresh innovations, key announcements, and takeaways you won't want to miss!
Prathamesh Sonpatki

What is LLM Observability? A Complete Guide (with OpenTelemetry)
> LLM observability is the practice of tracking what goes into an LLM, what comes out, and everything in between — latency, token usage, errors, and model behavior — so you can debug, optimize, and trust AI applications in production.
Prathamesh Sonpatki

AWS re:Invent 2024 Day 2 Recap
Catch up on the highlights from AWS re:Invent 2024 Day 2, featuring key insights, exciting announcements, and key takeaways.
Prathamesh Sonpatki

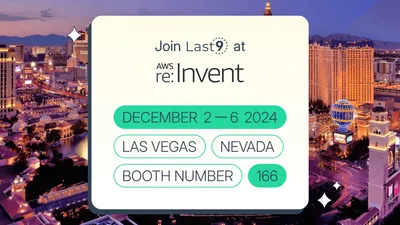
AWS re:Invent 2024 Day 1 Recap
AWS re:Invent Day 1 brought insightful talks, cool connections, and updates on AI, observability, and scaling challenges.
Prathamesh Sonpatki

A Beginner's Guide to GCP Monitoring
Learn how to monitor and optimize your GCP resources effortlessly. Simplify performance tracking and keep your services running smoothly.
Prathamesh Sonpatki
Anjali Udasi

Fluentd vs Fluent Bit – A Comprehensive Overview
Fluentd vs Fluent Bit: Discover the key differences, use cases, and how to choose the right tool for your log processing needs.
Prathamesh Sonpatki
Anjali Udasi

Enhancing Observability with Fluent Bit and OpenTelemetry
Boost observability with Fluent Bit and OpenTelemetry! Collect, process, and export logs and metrics easily for smarter monitoring.
Prathamesh Sonpatki

A Complete Guide to Kubernetes Observability
Learn how to implement effective Kubernetes observability with metrics, logs, and traces to monitor and optimize your clusters at scale.
Prathamesh Sonpatki

Extracting Account-Level CDN Metrics from Akamai Logs with Last9
Learn how to extract and analyze account-level CDN metrics from Akamai logs using Last9 for real-time insights and better customer tracking.
Prathamesh Sonpatki
Aditya Godbole
AWS re: Invent 2024: Must-Know Tips & What to Expect
Ready for AWS re:Invent 2024? Here are some tips and highlights to help you make the most of the event
Prathamesh Sonpatki
Anjali Udasi

Logging Errors in Go with ZeroLog: A Simple Guide
Learn how to log errors efficiently in Go using ZeroLog with best practices like structured logging, context-rich messages, and error-level filtering.
Prathamesh Sonpatki

Kubernetes Observability with OpenTelemetry Operator
Learn how the OpenTelemetry Operator makes monitoring Kubernetes easier, so you can focus on what matters—keeping your apps running smoothly!
Prathamesh Sonpatki
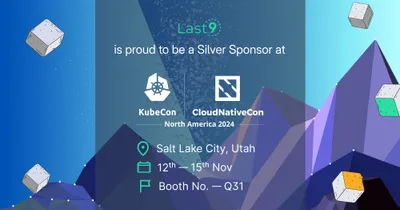
KubeCon NA 2024 Day 4 Recap
KubeCon NA 2024 Day 4 Recap: Insights, key talks, and lessons learned as the conference wraps up—looking forward to what’s next!
Prathamesh Sonpatki
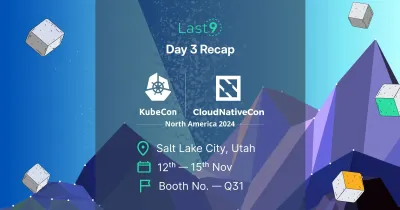
KubeCon NA 2024 Day 3 Recap
Day 3 at KubeCon NA 2024 was full of engaging discussions on platform engineering, FinOps, and the future of cloud-native.
Prathamesh Sonpatki
Getting Started with OpenTelemetry in Rust
Learn how to implement OpenTelemetry in Rust for effective observability, including tracing, metrics, and debugging in your applications.
Prathamesh Sonpatki

KubeCon NA 2024 Day 2 Recap
KubeCon NA 2024 Day 2 was packed with insights! Check out the highlights and key moments from another exciting day at the event.
Prathamesh Sonpatki

KubeCon NA 2024 Day 1 Recap: Observability Day & More
Day 1 of KubeCon NA 2024 was packed with insights, especially from Observability Day. Check out the highlights and talks that stood out!
Prathamesh Sonpatki

Flask Logging Made Simple for Developers
Learn how to implement proper logging in Flask, from development to production, and avoid the pitfalls of scattered print statements.
Prathamesh Sonpatki

SRECon EMEA 2024 - Day 3
Here’s a snapshot of the key talks, important ideas, and memorable moments that set the stage for SRECon EMEA Dublin 2024!
Prathamesh Sonpatki

SRECon EMEA 2024 - Day 2
Here’s a quick recap of the standout talks, key insights, and unforgettable moments that got things rolling at SRECon EMEA Dublin 2024!
Prathamesh Sonpatki

SRECon EMEA 2024 - Day 1
Here’s a quick rundown of the standout talks, big ideas, and memorable moments that kicked things off in SRECon EMEA Dublin 2024!
Prathamesh Sonpatki

Scaling Prometheus: Tips, Tricks, and Proven Strategies
Learn how to scale Prometheus with practical tips and strategies to keep your monitoring smooth and efficient, even as your needs grow!
Prathamesh Sonpatki

Getting Started with Host Metrics Using OpenTelemetry
Learn to monitor host metrics with OpenTelemetry. Discover setup tips, common pitfalls, and best practices for effective observability.
Prathamesh Sonpatki

Prometheus RemoteWrite Exporter: A Comprehensive Guide
A comprehensive guide showing how to use PrometheusRemoteWriteExporter to send metrics from OpenTelemetry to Prometheus compatible backends
Prathamesh Sonpatki

Log Analytics 101: Everything You Need to Know
Get a clear understanding of log analytics—what it is, why it matters, and how it helps you keep your systems running efficiently by analyzing key data from your infrastructure.
Prathamesh Sonpatki
Anjali Udasi

The Developer’s Handbook to Centralized Logging
This guide walks you through the implementation process, from defining requirements to choosing the right tools, setting up log storage, and configuring visualization dashboards.
Prathamesh Sonpatki
Anjali Udasi

Log Anything vs Log Everything
Explore the logging spectrum from "Log Anything" chaos to "Log Everything" clarity. Learn structured logging best practices in Go with zap!
Prathamesh Sonpatki

Docker Monitoring with Prometheus: A Step-by-Step Guide
This guide walks you through setting up Docker monitoring using Prometheus and Grafana, helping you track container performance and resource usage with ease.
Prathamesh Sonpatki
Anjali Udasi

Prometheus Recording Rules: Developer Guide to Optimization
This guide breaks down how recording rules can help, with simple tips to improve performance and manage complex data.
Prathamesh Sonpatki

Adding Cluster Labels to Kubernetes Metrics
A definitive guide on adding cluster label to all Kubernetes metrics
Prathamesh Sonpatki

Identify Root Spans in Otel Collector
How to identify root spans in OpenTelemetry Collector using filter and transform processors
Prathamesh Sonpatki

What is Prometheus Remote Write
Explore Prometheus Remote Write: scale your monitoring effortlessly. Learn how it works, its benefits, and top tips for cloud-native setups.
Prathamesh Sonpatki

Golang Logging: A Comprehensive Guide for Developers
Our blog covers practical insights into Golang logging, including how to use the log package, popular third-party libraries, and tips for structured logging
Prathamesh Sonpatki
Preeti Dewani

Developer's Guide to Installing OpenTelemetry Collector
Learn how to install and configure the OpenTelemetry Collector for enhanced observability. This guide covers Docker, Kubernetes, and Linux installations with step-by-step instructions and configuration examples.
Prathamesh Sonpatki

Top 10 Platform Engineering Tools in 2024
Check out these 10 tools that are making a real difference in how teams build, manage, and scale their platforms in 2024.
Prathamesh Sonpatki
PromCon 2024 — Day 2
Catch up on Day 2 of PromCon 2024. Read about the key talks and takeaways from the second day of this exciting event.
Prathamesh Sonpatki
PromCon 2024 — Day 1
Get a quick overview of Day 1 at PromCon 2024, which featured significant announcements on Prometheus 3.0 and OpenTelemetry compatibility
Prathamesh Sonpatki

PromQL Cheat Sheet: Must-Know PromQL Queries
A practical PromQL cheat sheet covering quick diagnostic queries, aggregation functions, label manipulation, SLO tracking, capacity planning, and multi-cluster patterns for Prometheus users.
Prathamesh Sonpatki
Anjali Udasi

Microservices Monitoring with the RED Method
This blog introduces the RED method—an approach that simplifies microservices monitoring by honing in on requests, errors, and latency.
Prathamesh Sonpatki

kube-state-metrics: Your Guide to Kubernetes Observability
This guide provides an in-depth look at its setup and usage, helping you monitor and manage your Kubernetes clusters more efficiently.
Prathamesh Sonpatki
Anjali Udasi

Hot Reload for OpenTelemetry Collector: Step-by-Step Guide
Learn to enable hot reload for the OpenTelemetry Collector to update configurations on the fly, improving your observability system's agility.
Prathamesh Sonpatki

OpenTelemetry Filelog Receiver: Collecting Kubernetes Logs
Learn to configure, optimize, and troubleshoot log collection from various sources including syslog and application logs. Discover advanced parser operator techniques for robust observability.
Prathamesh Sonpatki

7 Splunk Alternatives Worth Checking Out in 2025
Explore Splunk alternatives like ELK, Last9, Graylog, and Datadog. Compare features, pricing, and scalability for log management and observability.
Prathamesh Sonpatki
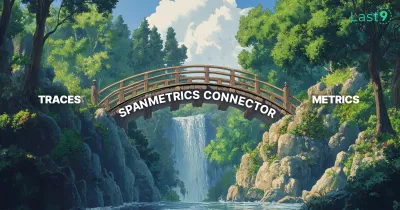
Convert OpenTelemetry Traces to Metrics with SpanMetrics
Already implemented tracing but lack metrics? With SpanConnector, you can convert trace data into actionable metrics. Here’s how to configure it.
Prathamesh Sonpatki

OpenTelemetry Collector: Architecture & How It Works
How the OpenTelemetry Collector works: receivers, processors, exporters, and extensions, how it deploys on Kubernetes, and how to run it locally.
Prathamesh Sonpatki
Whitespace in OTLP headers and OpenTelemetry Python SDK
How to handle whitespaces in the OTLP Headers with Python Otel SDK
Prathamesh Sonpatki
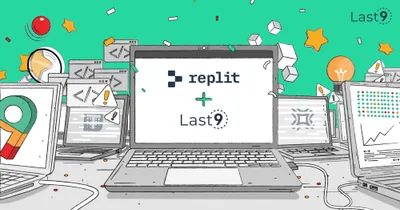
How We Cut Monitoring Costs and Deprecated Thanos at Replit
Winning Replit over by taming High Cardinality data and deprecating Thanos
Prathamesh Sonpatki
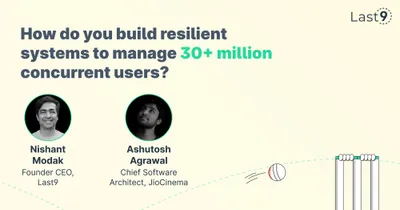
Cricket Scale e01 — Ashutosh Agrawal
Unpacking "Cricket Scale" with the person behind the scenes at JioCinema
Prathamesh Sonpatki

A checklist to choose a monitoring system
A detailed checklist of points you should consider before choosing a monitoring system
Prathamesh Sonpatki

The unresolved cost of High Cardinality
Fulfill all your food delivery orders this December 31st by taming High Cardinality data with Last9 😉
Prathamesh Sonpatki

Instrumenting Java Apps with OpenTelemetry: Guide & Tips
A comprehensive guide to instrument Java applications using OpenTelemetry libraries
Prathamesh Sonpatki

SaaS Monitoring with Levitate
How Levitate solves today's challenges of B2B SaaS monitoring, including noisy neighbors by unlocking per-tenant observability
Prathamesh Sonpatki

OpenTelemetry vs OpenTracing: What's the Difference?
Discover the key differences between OpenTelemetry and OpenTracing, and how they impact observability and tracing in modern applications.
Prathamesh Sonpatki
Levitate: Last9’s Managed TSDB Now on AWS Marketplace
Levitate - Last9's managed Prometheus Compatible TSDB is available on AWS Marketplace
Prathamesh Sonpatki

PromQL Macros in Levitate
Define PromQL Macros to standardize complex PromQL queries in Last9
Prathamesh Sonpatki
GCP Managed Service For Prometheus vs. Levitate
A detailed comparison of Levitate and Google Managed Prometheus - Cost, Scale and Ease of Use
Prathamesh Sonpatki
Ingest OpenTelemetry metrics with Prometheus natively
Native support for OpenTelemetry metrics in Prometheus
Prathamesh Sonpatki
InfluxDB vs. Thanos
InfluxDB vs Thanos: Overview, Pros and Cons, and Differences
Prathamesh Sonpatki

Graphite vs Prometheus
Compare Graphite and Prometheus, two leading open-source monitoring solutions.
Prathamesh Sonpatki

QCon New York 2023 Recap
Recap of QCon New York 2023 Conference
Prathamesh Sonpatki

Prometheus vs Grafana: Key Differences and When to Use Each
Explore the differences between Prometheus and Grafana and how these two powerful tools work together to enhance monitoring and data visualization.
Prathamesh Sonpatki

Metrics, Events, Logs, and Traces: Observability Essentials
Understanding Metrics, Logs, Events and Traces - the key pillars of observability and their pros and cons for SRE and DevOps teams.
Prathamesh Sonpatki

Filtering Metrics by Labels in OpenTelemetry Collector
How to filter metrics by labels using OpenTelemetry Collector
Prathamesh Sonpatki

Interesting talks on Observability from Fosdem 2023
A recap of the talks from the Observability and Monitoring dev room at Fosdem 2023.
Prathamesh Sonpatki

A practical guide for implementing SLO
How to set Service Level Objectives with 3 steps guide
Prathamesh Sonpatki
Saurabh Hirani
The difference between DevOps, SRE, and Platform Engineering
In reliability engineering, three concepts keep getting talked about - DevOps, SRE and Platform Engineering. How do they differ?
Prathamesh Sonpatki

Introduction to DORA Metrics
DORA metrics, what they are, why they are important, and best practices for measuring them.
Prathamesh Sonpatki

How to Improve On-Call Experience!
Better practices and tools for management of on-call practices
Prathamesh Sonpatki

Best Practices for Postmortems: A guide
The ins and outs of conducting an effective postmortem. Ready templates and examples from leading organizations around the world!
Prathamesh Sonpatki

Deployment Readiness Checklists
A ready checklist of a comprehensive list of steps and activities involved in the deployment of your application.
Prathamesh Sonpatki

Monorepos - The Good, Bad, and Ugly
Explore the pros and cons of monorepos, including their benefits, challenges, and potential pitfalls for managing large codebases.
Prathamesh Sonpatki
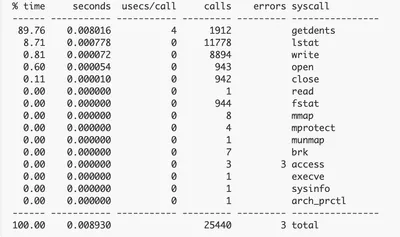
Strace – A Hidden Superpower
Like any OS, Linux isn’t immune to hiccups, especially when running closed-source apps where you can’t inspect the code for deeper insights.
Akshat Goyal
Prathamesh Sonpatki
Rescuing a SPAghetti React project
Practical tips for rescuing a SPAghetti React JS project. With confidence and a shared mental model, we made the codebase reliable and easier to manage.
Prathamesh Sonpatki

One year at Last9
Celebrating one year at Last9! From uncertainty to growth, it's been an amazing journey with an inspiring team and exciting challenges.
Prathamesh Sonpatki